Lightstep, now ServiceNow Cloud Observability, made a name for itself with precision distributed tracing, high-cardinality telemetry support, and native OpenTelemetry compatibility. It’s well-suited for debugging complex microservice environments, offering unified dashboards, intelligent alerting, and automated service maps. Its Unified Query Language (UQL) also makes querying across metrics, logs, and traces consistent and developer-friendly.
But as observability shifts from deep tracing to full-stack coverage—including frontend, infra, and synthetic layers. The platform does not offer built-in Real User Monitoring (RUM) or synthetic monitoring, does not offer on-prem or hybrid deployment support, and bloated UI. With application observability market growing rapidly, projected to reach USD 14.34 billion by 2030, DevOps, software engineers are uncertain about the Lightstep.
CubeAPM emerges as the most robust Lightstep alternative. It provides end-to-end MELT observability out of the box, with support for smart sampling, OpenTelemetry-native instrumentation, RUM, synthetic monitoring, and on-prem deployments—all at a fraction of the cost. Starting at $0.15/GB with no per-user fees, CubeAPM enables teams to cut observability costs by 60–80% without sacrificing performance, coverage, or compliance readiness. It integrates seamlessly with existing agents from Datadog, New Relic, Prometheus, and others—making migration frictionless.
In this article, we’ll break down the top 7 Lightstep alternatives in 2025, comparing tools across observability breadth, pricing transparency, deployment flexibility, and operational simplicity—so you can choose a future-ready platform that scales with your stack.
Table of Contents
ToggleTop 8 Lightstep Alternatives
- CubeAPM
- Uptrace
- SigNoz
- Datadog
- Dynatrace
- New Relic
- Better Stack
- Sumo Logic
Why Look for Lightstep Alternatives?
Lightstep is a capable tracing solution built with modern architectures in mind. Its strengths—like native OpenTelemetry support, unified dashboards, and intelligent alerting—make it an attractive choice for teams focusing on root cause analysis in complex distributed systems. But as observability expectations evolve toward full-stack coverage, compliance-ready deployment, and cost transparency, Lightstep starts to fall short in key areas.
1. No Real User Monitoring (RUM) or Synthetic Monitoring
Lightstep lacks native support for frontend observability. Without Real User Monitoring, teams are blind to real-world performance issues across browsers, locations, and devices. And without synthetic monitoring, they can’t simulate user journeys or detect regressions before users are impacted. These omissions leave major gaps in coverage and incident prevention.
2. Difficult-to-Navigate UI
Lightstep offers rich dashboards, but many users find the interface unintuitive for everyday debugging. Common actions—like locating traces or visualizing service dependencies require too many clicks or lack filtering depth. Reviews from users have shown that the US can be a bit complicated, even for experienced engineers.
3. Limited Full-Stack Observability
While Lightstep offers unified querying and dashboards, it doesn’t natively support infrastructure monitoring, error tracking, or advanced log analytics. Teams must bolt on external tools like Prometheus, Grafana, or Splunk to fill the gaps—creating silos, extra cost, and added maintenance overhead.
4. No On-Prem or Hybrid Deployment Support
Lightstep is SaaS-only, with no self-hosted or hybrid options. This makes it incompatible with strict internal policies or compliance frameworks that require full control over telemetry pipelines and data locality. In regulated sectors or enterprise environments, lack of deployment flexibility is a critical limitation.
5. Unpredictable Pricing at Scale
Lightstep’s pricing is tied to span volume and data cardinality—two variables that explode in microservices environments. As usage scales, bills become difficult to forecast and optimize. There are no flat pricing tiers or usage caps, which leads to surprises in billing and limited cost control.
6. Static Sampling Without Signal Awareness
While Lightstep integrates seamlessly with OpenTelemetry, it primarily relies on manual, fixed-rate sampling. It lacks native smart sampling or signal-aware mechanisms that dynamically prioritize traces based on latency, errors, or anomalies—potentially driving up ingestion costs or missing critical diagnostics
Criteria for Suggesting Lightstep Alternatives
When selecting the best alternatives to Lightstep, we focused on tools that solve the platform’s core limitations—especially around full-stack coverage, deployment flexibility, and cost efficiency. While Lightstep is strong in distributed tracing and OpenTelemetry support, most teams today demand broader observability capabilities and more control over data handling and pricing.
Here are the key criteria we used to evaluate better-suited Lightstep replacements:
1. Native and Deep OpenTelemetry (OTEL) Support
We prioritized platforms that go beyond basic OTEL ingestion and offer native support for OTLP metrics, logs, and traces—with minimal vendor-specific configuration. While Lightstep supports OTEL natively, some alternatives provide deeper alignment with OTEL semantic conventions, pre-built dashboards, automatic instrumentation, and full-fidelity retention pipelines. These capabilities accelerate adoption and eliminate vendor lock-in, especially for teams building long-term, open observability architectures.
2. Full-Stack Observability
Modern DevOps teams need more than backend traces—they require full visibility across the MELT stack (Metrics, Events, Logs, Traces), along with frontend monitoring and synthetic testing. Alternatives must offer built-in RUM and synthetic monitoring, so teams can simulate user flows and detect regressions before they affect production. Lightstep’s lack of these features creates major blind spots across the user journey.
3. Smart Sampling & Signal Optimization
Efficient observability isn’t about collecting everything—it’s about capturing the right data. We prioritized tools with intelligent, context-aware sampling that adjusts based on anomalies, latency, or error spikes. Static sampling, like the kind used in Lightstep, can result in either excessive ingestion (and cost) or missed signals during incidents.
4. Deployment Flexibility & Data Control
Whether due to compliance, cost, or operational policy, many teams require more than SaaS-only offerings. We selected tools that support hybrid or fully on-prem deployments, allowing teams to retain control over where data is stored, processed, and retained. Lightstep’s lack of on-prem hosting limits its suitability in compliance-sensitive environments.
5. Cost Efficiency & Transparent Billing
Volume-based pricing with unpredictable cardinality penalties doesn’t scale well. We focused on platforms with transparent, usage-based pricing (e.g., $/GB), zero per-user fees, and clear retention policies. Tools like CubeAPM charge $0.15/GB for ingestion with no added cost for users, RUM, or synthetics—often resulting in 60–80% lower total cost than Lightstep, Datadog, or New Relic.
6. Operational Simplicity & Fast Onboarding
We gave preference to tools that offer fast deployment, simple agent migration, and intuitive UIs. Alternatives must support seamless integration with OpenTelemetry, Prometheus, and legacy agents without extensive manual tuning. Lightstep’s learning curve, combined with its dependence on external systems for complete observability, can slow down rollout and onboarding.
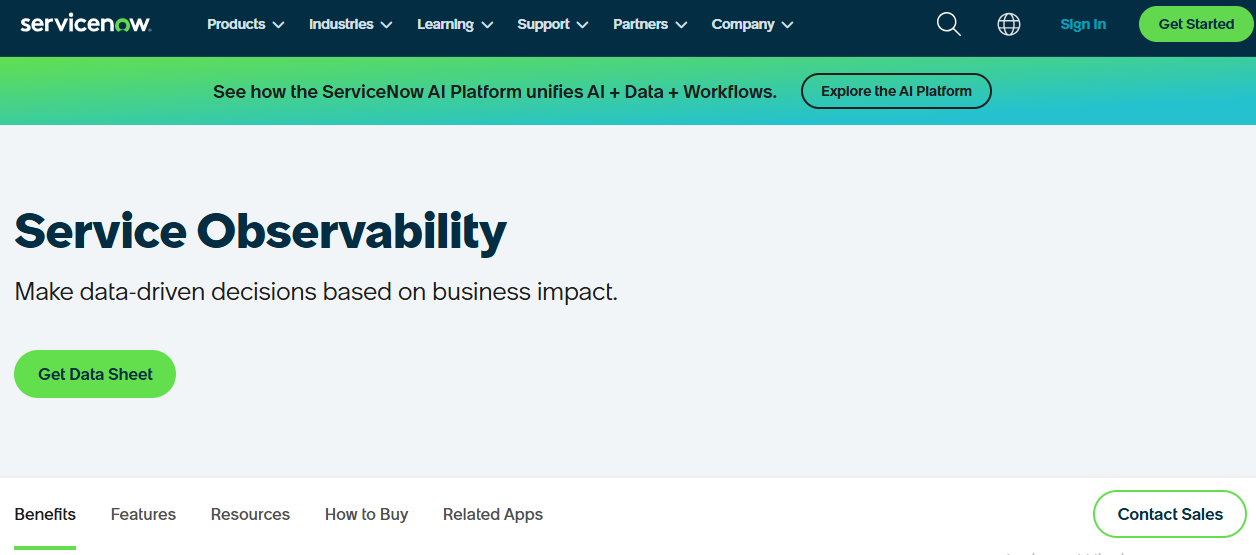
Lightstep (ServiceNow) Overview
Known for:
High-fidelity distributed tracing and root cause analysis across microservices and complex cloud-native systems. Originally built for modern observability by the team behind Google’s Dapper, Lightstep is now a ServiceNow company focused on large-scale enterprise use cases.
Standout Features:
- Streaming Telemetry Architecture: Unlike batch-based systems, Lightstep processes telemetry in real-time to give immediate visibility into system health.
- Service Diagrams with Dependency Mapping: Helps teams visualize service-to-service interactions for pinpointing bottlenecks quickly.
- Change Intelligence: Automatically correlates performance regressions with deployments, config changes, or infrastructure shifts.
- Native OpenTelemetry Integration: One of the earliest backers of the OpenTelemetry project, Lightstep supports seamless OTLP ingestion.
- Time Travel Analysis: Lets engineers replay performance snapshots across historical intervals to investigate anomalies retroactively.
Key Features:
-
End-to-End Distributed Tracing
Allows teams to trace requests across thousands of microservices and correlate logs and metrics to individual spans. This is critical for debugging complex production issues in distributed systems.
-
Service-Level Root Cause Analysis
Identifies which upstream or downstream service is introducing latency or errors, minimizing MTTR.
-
Dynamic Service Maps
Continuously updated visualization of application dependencies, reducing the need for manual instrumentation.
-
Deployment Markers & Alerts
Engineers can see exactly when a deployment occurred in context with performance regressions.
-
OpenTelemetry Support
Lightstep is built from the ground up to ingest data using OTLP (OpenTelemetry Protocol), removing the need for proprietary agents.
Pros:
- Excellent for real-time performance analysis in complex environments.
- Strong OpenTelemetry support without vendor lock-in.
- Deep integration with ServiceNow for incident response workflows.
- Stream-based ingestion supports low-latency alerts and high-cardinality telemetry.
Cons:
- Pricing is opaque and often prohibitive at scale, especially for teams with high telemetry volume
- Limited logging capabilities, often requiring teams to pair with another logging vendor or platform.
- Focused primarily on tracing — partial MELT coverage compared to platforms offering full-stack observability (metrics, logs, traces, synthetics, RUM).
- Lacks on-premise or self-hosted deployment option — restricting adoption in regulated industries.
- Consolidation under ServiceNow has led to concerns about roadmap uncertainty and slower innovation post-acquisition.
Best For:
- Platform teams and SREs in cloud-native, Kubernetes-heavy environments who need granular tracing insights.
- Enterprises already using ServiceNow ITOM/ITSM workflows and looking for native integration.
- Mid-to-large scale companies running microservices at scale who prioritize deployment correlation and root cause analysis.
Pricing & Customer Reviews:
- Pricing: Not transparently published. Based on community reports and industry forums, Lightstep uses a volume-based pricing model tied to trace ingestion and retention.
- For teams with high throughput services or long trace retention needs, costs can escalate quickly.
- Some users report $2,000–$10,000/month range for mid-size teams.
- G2 Rating: 4.4/5
- Pros (G2): “High-fidelity tracing,” “Easy OpenTelemetry setup.”
- Cons (G2): “Lack of log management,” “Limited export functionality,” “Gets expensive at scale.”
Top 8 LightStep Alternatives
1. CubeAPM

Known for:
Full-stack OpenTelemetry-native observability with built-in cost efficiency, real-time MELT visibility, and developer-first workflows. CubeAPM is purpose-built for teams looking to escape vendor lock-in and reduce observability TCO by up to 80% — without compromising on performance, flexibility, or scale.
CubeAPM is purpose-built to ingest telemetry from both applications and infrastructure, with a design that processes data locally rather than routing it through third-party cloud services. This architecture results in 2–4x faster dashboard and page load times compared to traditional cloud-hosted APM tools. A key differentiator is its context-aware smart sampling, which intelligently prioritizes valuable traces based on real-time conditions — ensuring a high signal-to-noise ratio while efficiently handling high-volume workloads with minimal resource consumption.
The platform also excels in correlating traces and metrics to deliver real-time insights and enable proactive incident resolution.
CubeAPM provides out-of-the-box monitoring for a wide range of infrastructure components, including Kubernetes, Redis, Kafka, MySQL, and MS SQL. In addition, it offers automated integration with key AWS services such as EC2, EBS, RDS, DynamoDB, and Lambda — a capability that further distinguishes it from other observability platforms.
Standout Features:
-
Smart Sampling Engine:
Retains high-value traces (e.g., 5xx errors, high latency) while dropping noise, reducing ingestion volume and cost without missing anomalies.
-
Complete MELT Stack Coverage:
Built-in support for Metrics, Events, Logs, Traces, Synthetic Monitoring, and Real User Monitoring (RUM).
-
Self-Hosted or Hybrid Deployment:
Run CubeAPM fully on-premise or in hybrid environments to meet compliance, data sovereignty, or performance needs.
-
Instant Migration from Legacy APMs:
Move from tools like Datadog, New Relic, or Lightstep in under an hour — fully OTEL-compatible and agentless.
-
Unlimited Users, Flat Pricing:
No per-seat pricing. Teams can scale usage and users without surprise bills or license constraints.
Key Features:
-
OpenTelemetry-First Design:
Natively supports OTLP and Prometheus data without requiring custom agents or translation layers.
-
Infra Monitoring & Alerting:
Built-in AWS, Linux, and Kubernetes monitoring, with automated alerts and health checks.
-
RUM & Synthetics:
Simulate user flows, track real-world frontend behavior, and tie frontend latency to backend spans.
-
Custom Dashboards & MELT Views:
Tailored dashboards across logs, metrics, traces, and uptime for fast triage and collaboration.
-
Built for Scale:
Handles high-ingest workloads and large multi-service environments with minimal overhead.
Pros:
- Smart sampling = lower costs + high signal fidelity
- Self-hosted & hybrid deployment ready
- Unlimited users and ingestion-based pricing
- Native support for RUM, synthetics, logs, metrics, and traces
- Real-time ingestion with 2–4x faster dashboard load times vs. SaaS APMs
- Slack-based engineering support with response times under 10 minutes
- 800+ integrations
- Zero cloud egress costs
Cons:
- Not SaaS-first — not ideal for teams looking only for cloud-native hosted solutions
- Observability focused — does not include native security monitoring or SIEM
Best for:
- Mid-to-large engineering orgs prioritizing control, cost-efficiency, and OpenTelemetry
- DevOps, SRE, and platform teams managing high-throughput environments
- Startups scaling out observability without wanting per-user billing surprises
Pricing & Customer Reviews:
- Pricing: Transparent ingestion-based pricing at $0.15/GB
- Zero cloud egress costs
- Customer Rating: 4.7/5 (based on pilot feedback, demos, and verified Slack customer comments)
Teams praise CubeAPM’s ease of setup, smart sampling accuracy, and dashboard responsiveness. Many highlight support quality and cost predictability as major differentiators.
CubeAPM vs Lightstep:
While both CubeAPM and Lightstep support OpenTelemetry and distributed tracing, CubeAPM offers broader coverage across the MELT stack, including RUM, logs, infra metrics, and synthetic monitoring. It also delivers smart sampling, unlimited users, and self-hosted options — features Lightstep lacks. For teams focused on cost reduction, compliance, and full-stack visibility without vendor lock-in, CubeAPM is a stronger, more scalable alternative to Lightstep’s tracing-centric SaaS model.
2. Uptrace

Known for:
OpenTelemetry-native tracing and lightweight observability. Uptrace is built around OpenTelemetry and ClickHouse, targeting small teams seeking a self-hosted, cost-effective solution for distributed tracing and basic metrics.
Standout Features:
-
Seamless OpenTelemetry Support:
Offers native OTEL compatibility out of the box — no vendor-specific agents required.
-
ClickHouse-Powered Analytics:
Leverages ClickHouse as a backend to enable fast, SQL-based trace querying.
-
Basic Metrics Integration:
Compatible with Prometheus-style metrics, providing system and service-level visibility.
-
Minimalist UI:
A no-frills, fast-loading interface suited for basic diagnostics and developers who prefer simplicity over visual richness.
Key Features:
- Distributed tracing powered by OpenTelemetry
- Self-hosted deployment (supports Docker-based collector setups)
- SQL-based trace queries for advanced troubleshooting
- Prometheus integration for capturing basic system metrics
- Basic dashboarding and alerting for trace anomalies
Pros:
- Fully OTEL-compliant, avoiding vendor lock-in
- Free community edition — highly cost-effective for early-stage teams
- Flexible deployment — runs entirely within your infrastructure
- Easy integration with Prometheus metrics stack
Cons:
- No support for Real User Monitoring (RUM) or synthetic testing
- Lacks advanced sampling or intelligent data prioritization
- Dashboards and UX are very limited compared to modern platforms
- Operational complexity — requires maintaining ClickHouse and OTEL collector setups
- Minimal enterprise support — no SLAs or managed hosting options
Best for:
- DevOps-savvy startups that prefer managing observability stacks in-house
- Teams focused primarily on traces and backend debugging
- Environments not yet ready for full MELT observability (Metrics, Events, Logs, Traces)
Pricing & Customer Reviews:
- Pricing: Logs & traces from $0.08/GB; metrics at $0.001 per series
- ProductHunt Rating: 4.8/5
While users appreciate its speed and simplicity, many cite a lack of enterprise features, advanced visualization, and end-to-end monitoring.
Uptrace vs Lightstep:
Both Lightstep and Uptrace are OpenTelemetry-native and emphasize tracing, but they serve different audiences. Uptrace is better suited to small teams who want a DIY, budget-friendly tracing stack. However, Lightstep’s edge lies in real-time streaming, change intelligence, and dynamic service maps — making it far more effective for teams operating at scale. That said, neither platform delivers full MELT observability or true cost control across the board. For engineering teams outgrowing Uptrace — and wary of Lightstep’s pricing and limitations — CubeAPM offers a unified, OpenTelemetry-native upgrade with smart sampling, compliance-friendly hosting, and 60–80% cost savings.
3. SigNoz
Known for:
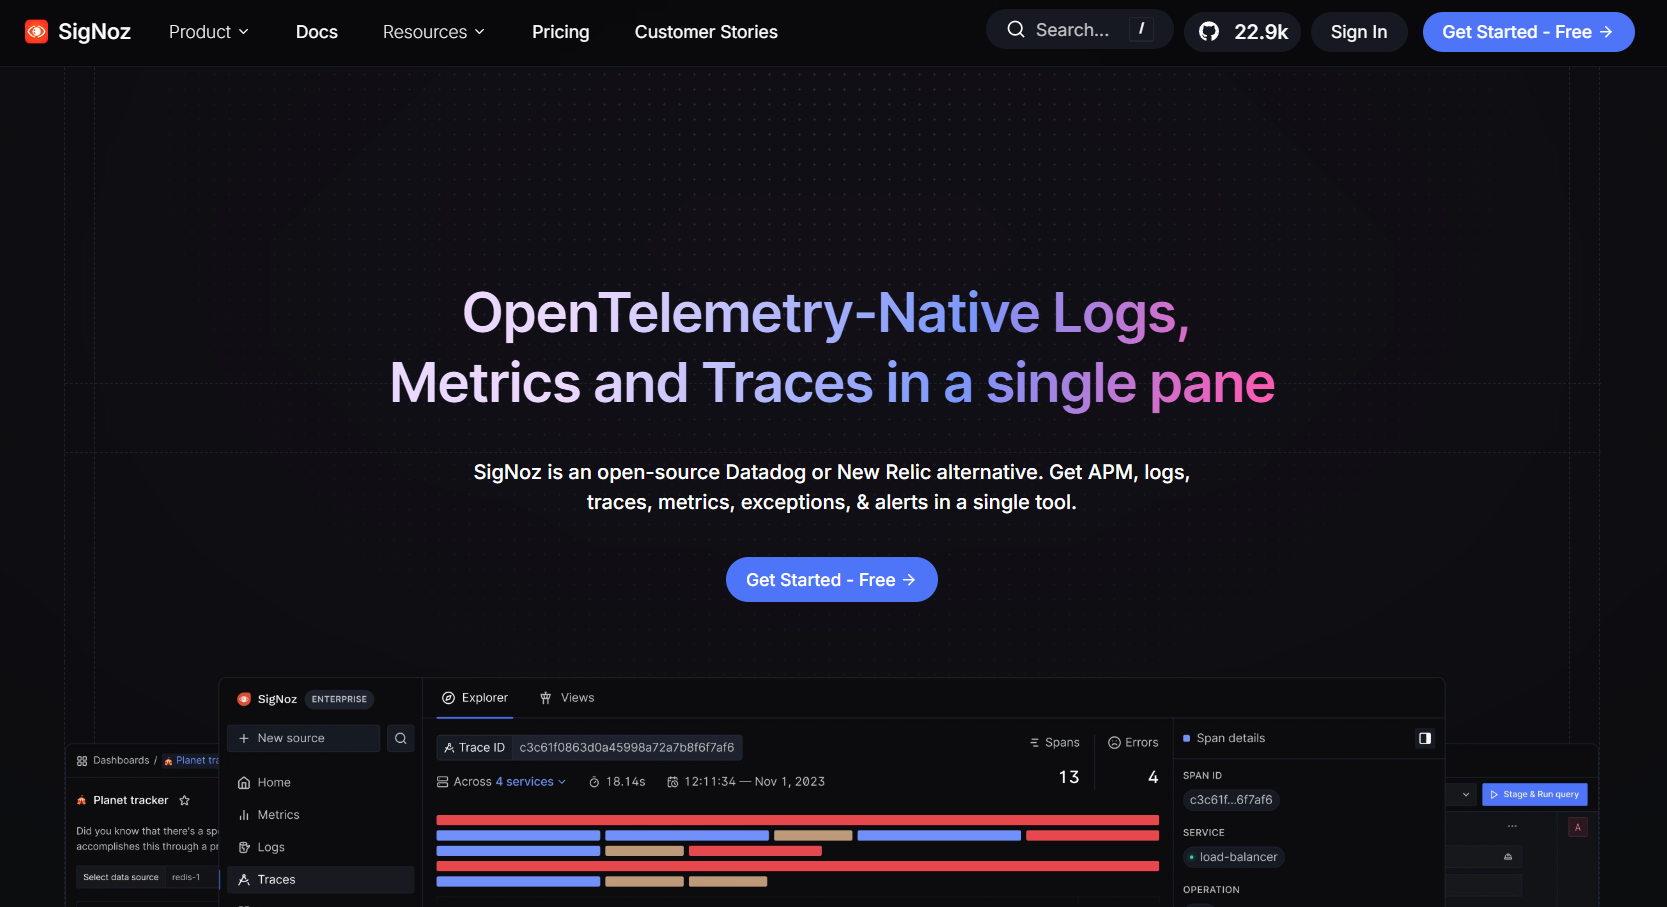
Open-source, OpenTelemetry-native observability platform offering full MELT support — Metrics, Events, Logs, and Traces. SigNoz is especially popular among engineering teams seeking a modern UI, flexible self-hosting, and transparent architecture backed by ClickHouse.
Standout Features:
-
Native OpenTelemetry Support:
SigNoz is designed from the ground up to support OTLP ingestion, making it fully compatible with OpenTelemetry SDKs and Prometheus exporters. No proprietary agents required.
-
Comprehensive MELT Observability:
Covers all major telemetry pillars:
- Distributed tracing
- Infrastructure metrics
- Log aggregation and filtering
- Event-based alerting workflows
-
Self-Hosted & Cloud Flexibility:
Can be deployed using Docker Compose or Helm charts in Kubernetes. For teams that prefer not to manage infrastructure, hosted cloud plans are also available.
-
ClickHouse-Powered Query Engine:
Leverages ClickHouse for high-speed analytics, enabling fast trace lookups and Prometheus-style metric visualizations through a unified UI.
Key Features:
- Service maps and prebuilt dashboards
- Unified query interface for logs, traces, and metrics
- Tail-based sampling support via OpenTelemetry Collector
- Integration with Alertmanager and Slack for notifications
- GitHub-driven development with frequent open-source contributions
Pros:
- Fully OTEL-native and vendor-agnostic observability stack
- Strong open-source backing — 20K+ GitHub stars
- Query logs, metrics, and traces from a single dashboard
- Flexible deployment options (self-managed or hosted)
- Actively maintained with responsive community support
Cons:
- No native smart sampling or dynamic retention logic
- Operational complexity when running with Kafka, ClickHouse, and Alertmanager
- Query latency can increase under high-cardinality trace loads
- Community support only for free tier — slower turnaround for issues
- Lacks enterprise-grade SLAs unless on a paid plan
Best for:
- Engineering teams looking to self-host and customize observability workflows
- Startups and mid-size orgs evaluating alternatives to commercial APMs
- Teams already operating ClickHouse or Kafka-based infrastructure
Pricing & Customer Reviews:
- Self-hosted: Free (infrastructure costs borne by user)
- Cloud-hosted: Starts at $49/month base + $0.30/GB (traces/logs)
- G2 Rating: 4.5/5
Highly rated for its modern UI and open-source transparency. Users appreciate its ease of setup and cost-efficiency, but mention issues with scaling, sampling controls, and the overhead of managing multiple backend services.
SigNoz vs Lightstep:
While both SigNoz and Lightstep are OpenTelemetry-friendly, they target different needs. SigNoz appeals to teams that value self-hosted flexibility, full MELT support, and open-source control. Lightstep focuses more narrowly on real-time streaming traces, deployment correlation, and performance diagnostics. However, Lightstep lacks self-hosting and can become expensive for teams with high telemetry volume. SigNoz, while cost-efficient, does not offer smart sampling or seamless scalability out of the box. For teams looking to combine trace intelligence, MELT observability, self-hosting, and efficient cost control, CubeAPM emerges as a powerful alternative to both.
4. Datadog
Known for:
Datadog is a cloud-native observability powerhouse that offers broad, integrated coverage across infrastructure, application performance, logging, and security. Datadog is widely adopted by DevOps and SRE teams for its plug-and-play integrations and rich UI.
Standout Features:
-
900+ Native Integrations:
Extensive ecosystem support, including AWS, Kubernetes, Docker, GitHub, Jenkins, and more.
-
Unified Observability Platform:
Combines APM, infrastructure metrics, logs, RUM, synthetics, and cloud security in one dashboard.
-
Watchdog AI Engine:
Automatically detects anomalies and unusual behavior using machine learning.
-
Scalable Multi-Region Support:
Handles global infrastructure with real-time telemetry ingestion and visualization.
-
Rich Visualizations & Alerts:
Offers advanced dashboards and alerts (threshold, composite, anomaly-based) to support modern CI/CD workflows.
Key Features:
- Infrastructure Monitoring:
Collects host- and container-level metrics using lightweight agents. - Application Performance Monitoring (APM):
Provides deep tracing and performance analysis across services, databases, and APIs. - Log Management:
Ingest, search, and analyze logs with Live Tail and custom retention settings. - Synthetic Monitoring & RUM:
Monitor frontend user journeys and simulate real-world conditions. - Security Monitoring:
Detect vulnerabilities and compliance violations in cloud workloads.
Pros:
- Comprehensive observability suite under one roof
- Strong support for containerized and serverless environments
- Excellent documentation and ease of onboarding
- Ideal for teams needing extensive integrations and out-of-the-box visualizations
Cons:
- High cost at scale — pricing spreads across hosts, ingested data, events, and users
- No intelligent sampling — uses static sampling rates (e.g., 1%, 5%) that often miss anomalies
- Opaque billing — users often report unpredictable invoices and overages
- SaaS-only model — lacks self-hosted deployment for teams needing compliance or data residency
- Pricing tiers per product (APM, logs, synthetics) often lead to fragmented observability budgets
Best for:
- Enterprises with large budgets that want full-stack visibility out of the box
- Cloud-native teams operating across multi-cloud or hybrid environments
- Organizations with complex integration requirements and DevSecOps workflows
Pricing & Customer Reviews:
- APM: Starts at $31/host/month
- Infrastructure Monitoring: Starts at $15/host/month
- Logs: ~$0.10/GB + $1.70/million events (15-day retention)
- Synthetics: Priced separately based on test runs
- G2 Rating: 4.4/5
While Datadog receives praise for its breadth and depth, users frequently cite billing complexity, steep pricing, and the challenge of managing cost across modular services.
Datadog vs Lightstep:
Datadog and Lightstep both offer robust APM and tracing capabilities — but with different strengths. Datadog excels in breadth, combining APM, logs, infra, synthetics, and security in a single platform. However, its pricing model is notoriously complex, and it lacks intelligent sampling.
Lightstep, in contrast, emphasizes real-time performance visibility and change intelligence, offering faster root-cause detection in complex environments. Still, both tools can become expensive at scale and fall short on self-hosting or predictable pricing. For teams that want OpenTelemetry-native ingestion, smart sampling, full MELT coverage, and cost control, CubeAPM delivers a more scalable and transparent alternative.
5. Dynatrace
Known for:
AI-driven observability and automation at enterprise scale. Dynatrace combines full-stack monitoring with automated dependency discovery and deep code-level insights, powered by its proprietary Davis® AI engine.
Standout Features:
-
Davis AI Engine:
Continuously analyzes metrics, traces, logs, and user data to detect anomalies and predict issues before they affect users.
-
Auto-Instrumentation & Auto-Discovery:
Automatically maps services, APIs, containers, databases, and their relationships without manual setup.
-
End-to-End Visibility:
Covers infrastructure, applications, frontend (RUM), synthetics, and logs within one platform.
-
Business Workflow Monitoring:
Tracks performance in the context of SLAs, business KPIs, and user journeys.
-
Application Security Module:
Identifies vulnerabilities in production code and third-party libraries in real time.
Key Features:
- Full-Stack Observability:
Unified monitoring across infra, apps, services, frontend, cloud-native workloads, and user experience. - Code-Level Tracing & Profiling:
Drill into JVM, .NET, Node.js, and PHP to analyze execution paths, memory usage, and latency. - Log Management & Indexing:
Automatically correlates logs with traces and events using dynamic sampling. - Kubernetes & Serverless Monitoring:
First-class support for modern platforms including AWS Lambda, OpenShift, and GKE. - Predictive Incident Detection:
Leverages machine learning to forecast outages and performance regressions.
Pros:
- Enterprise-scale automation with minimal configuration
- Davis AI reduces noise and accelerates root cause analysis
- Deep code-level insights without manual instrumentation
- Strong hybrid cloud and multicloud observability support
- Integrated application security for DevSecOps
Cons:
- Premium pricing model with separate costs for AI, logs, infra, and application security
- Proprietary agent and instrumentation — limited support for OpenTelemetry
- Complex deployment for on-prem or hybrid models
- Less flexibility for custom dashboards and queries compared to platforms like Grafana or CubeAPM
Best for:
- Large enterprises and global teams managing complex, dynamic infrastructure
- Organizations prioritizing predictive diagnostics and minimal manual tuning
- IT operations teams aligning observability with business KPIs
Pricing & Customer Reviews:
- Pricing: $0.08/hour per 8 GiB host (~$57.60/host/month)
- G2 Rating: 4.4/5
Users highlight Dynatrace’s powerful automation and diagnostic capabilities, but raise concerns about high costs, limited OpenTelemetry compatibility, and steep learning curves.
Dynatrace vs Lightstep:
Both Dynatrace and Lightstep excel in helping teams pinpoint root causes across distributed systems. Dynatrace offers broader coverage, spanning full-stack observability, AI-based insights, and application security, making it ideal for large enterprises. Lightstep, on the other hand, delivers streaming telemetry, OpenTelemetry-native tracing, and change intelligence in real-time — with a lighter footprint. However, neither solution offers smart sampling, predictable ingestion pricing, or frictionless self-hosting. For teams that want enterprise-grade observability with OpenTelemetry flexibility and cost-efficiency, CubeAPM is a compelling alternative that bridges these gaps.
6. New Relic
Known for:
All-in-one observability with a unified telemetry backend. New Relic delivers full-stack MELT capabilities — including APM, infrastructure monitoring, logs, RUM, synthetics, and mobile — all integrated into its Telemetry Data Platform (TDP). It’s especially popular among teams looking for quick onboarding and broad visibility through a single UI.
Standout Features:
-
Telemetry Data Platform (TDP):
A centralized ingestion and analysis engine that aggregates logs, metrics, traces, and events from OpenTelemetry, Prometheus, and New Relic agents.
-
Powerful Query Language (NRQL):
Enables flexible real-time analytics and dashboarding across any dimension of telemetry data.
-
RUM, Synthetics & Mobile Monitoring:
Built-in support for frontend session tracking, browser and app latency, and uptime simulations.
-
Auto-Instrumentation & Integrations:
Automatically instruments code in supported languages and integrates natively with major cloud providers and DevOps tools.
-
Unified MELT View:
Offers a single-pane-of-glass experience across Metrics, Events, Logs, Traces — making triage faster and reducing tool fragmentation.
Key Features:
- Full-stack observability across backend, frontend, infra, and mobile
- NRQL-powered dashboards and SLO tracking
- Native support for OpenTelemetry and Prometheus
- Over 600 prebuilt integrations for common cloud and app services
- In-app AIOps capabilities like anomaly detection and SLI/SLO monitoring
Pros:
- Rapid setup with auto-instrumentation for many platforms
- Powerful querying and flexible visualizations via NRQL
- All MELT components managed in one UI
- Supports both agent-based and OpenTelemetry ingestion
- Good frontend and mobile visibility without additional tooling
Cons:
- Pricing includes per-user licensing ($400+/user/month for full access)
- Costs scale with ingestion volume — $0.30–$0.35 per GB — can escalate quickly
- No smart sampling — uses head-based sampling that often drops valuable traces
- Cloud-only — lacks on-prem or hybrid deployment options
- Advanced capabilities like dashboards, logs, or AI require premium plans
Best for:
- DevOps and SRE teams needing full-stack visibility from day one
- Mid-to-large orgs who prefer cloud-native SaaS platforms
- Teams comfortable with usage-based pricing and NRQL-based analytics
Pricing & Customer Reviews:
- Free Tier: 100 GB/month + 1 full user
- Paid Plans: $0.30–$0.35/GB ingestion + $400/user/month (full platform access)
- G2 Rating: 4.4/5
Customers appreciate its unified platform and fast setup but often flag the steep per-user pricing, lack of control over data locality, and reduced functionality unless using New Relic’s native agents.
New Relic vs Lightstep:
New Relic and Lightstep both support OpenTelemetry ingestion and offer robust distributed tracing, but New Relic positions itself as an all-in-one observability hub with integrated MELT capabilities. Lightstep, on the other hand, focuses on streaming performance data and pinpointing root causes through real-time telemetry and change correlation. However, both platforms lack smart sampling, enforce cloud-only deployments, and charge premiums for deeper capabilities. For teams looking to maintain control, reduce ingestion cost, and access full-stack observability — CubeAPM delivers MELT coverage, intelligent sampling, and flexible hosting with predictable pricing.
7. Better Stack
Known for:
Uptime monitoring and log management with an emphasis on simplicity and sleek design. Better Stack (formerly Better Uptime) caters to developers and small teams seeking quick-to-deploy monitoring with visually appealing dashboards and minimal configuration overhead.
Standout Features:
-
Integrated Uptime Monitoring + Logs:
Combines basic infrastructure monitoring with real-time log ingestion and alerting, eliminating the need for multiple tools.
-
Modern, Developer-Friendly UI:
Clean, fast interface designed for readability and ease of use — suitable for both internal dashboards and public status pages.
-
On-Call Scheduling & Incident Response:
Built-in workflows for alert routing, escalation, and incident tracking, fully integrated with Slack, Microsoft Teams, and email.
-
Markdown-Based Dashboards & Alerts:
Allows custom dashboards, team updates, and alert descriptions using a markdown interface.
-
Git-Based Configuration:
Enables YAML-based alert definitions and GitOps-style configuration for developers favoring code over GUI.
Key Features:
- HTTP, SSL, port, and ping-based uptime checks
- Built-in log ingestion, querying, and alerting (SQL-like syntax)
- Status pages with custom branding for public communication
- Multi-channel notifications and on-call scheduling
- Fast onboarding with integrations for Heroku, Vercel, AWS, and more
Pros:
- Extremely user-friendly and visually polished
- Combines core monitoring and alerting into one lightweight product
- Great for frontend, API, or uptime-centric workflows
- Free plan available with generous limits for small projects
- Public-facing dashboards and alerts for transparency
Cons:
- No support for distributed tracing or backend APM
- Not built for high-scale or microservices environments
- Limited log retention and scalability without premium pricing
- Lacks OpenTelemetry compatibility
- No RUM, synthetics, or smart sampling capabilities
Best for:
- Indie developers, startups, or small teams focused on website or API uptime
- Teams needing a simple Pingdom or UptimeRobot alternative with alerting
- Projects prioritizing clean dashboards and fast setup over deep observability
Pricing & Customer Reviews:
- Free Tier: Includes 10 monitors, 500MB/day logs, basic alerting
- Paid Plans: Start at $25/month and scale up to ~$850+ depending on log volume, alerting frequency, and feature access
- G2 Rating: 4.6/5
Users love Better Stack’s polished UX and streamlined setup, but often mention its lack of support for backend performance monitoring, OpenTelemetry, or complex infrastructure environments.
Better Stack vs Lightstep:
Better Stack is tailored for teams focused on uptime, alerting, and basic log visibility, with a strong emphasis on design and ease of use. Lightstep, in contrast, specializes in real-time distributed tracing and performance debugging in large, microservices-heavy environments. While Better Stack is an excellent tool for lightweight use cases, it lacks the depth, scalability, and OTEL-native support that Lightstep provides. That said, neither platform offers full MELT observability or cost-optimized ingestion. For engineering teams who need OpenTelemetry-native, full-stack coverage with smart sampling and deployment flexibility, CubeAPM offers a future-ready alternative to both.
8. Sumo Logic
Known for:
Cloud-native log analytics and security monitoring tailored for large enterprises. Sumo Logic delivers unified visibility across logs, metrics, and security events — with strong compliance and DevSecOps capabilities, particularly in multi-cloud and hybrid environments.
Standout Features:
-
Log-Centric Observability:
Advanced log ingestion and querying, with real-time correlation across services, users, and infrastructure.
-
Cloud-Native Integrations:
Out-of-the-box support for AWS, Azure, GCP, Kubernetes, and serverless platforms.
-
Built-In SIEM & Security Analytics:
Enables threat detection, compliance auditing, and security event monitoring from the same platform.
-
Machine Learning Insights:
Automated anomaly detection and outlier analysis based on usage patterns and telemetry trends.
-
Compliance-Ready Architecture:
Supports HIPAA, SOC 2, GDPR, PCI, and more — designed for regulated environments.
Key Features:
- Centralized log analytics with query-based search
- Metrics collection and dashboarding with custom alerts
- Integrated security monitoring and threat detection workflows
- Real-time data correlation across logs, metrics, and security events
- Content packs for Kubernetes, cloud services, and CI/CD pipelines
Pros:
- Strong compliance and security tooling
- Scales well in enterprise multi-cloud environments
- Robust log analytics engine with fast search and retention management
- DevSecOps-friendly with unified observability and SIEM
- Supports high-ingestion environments with flexible routing options
Cons:
- Lacks full OpenTelemetry-native support — limited flexibility in trace ingestion
- Weak distributed tracing capabilities without complex configuration
- Pricing can spike with log volume and retention needs
- SaaS-only — no self-hosted deployment or data residency control
- No smart sampling or MELT-native architecture; tracing is not a core strength
Best for:
- Enterprises with heavy log ingestion needs and strong compliance requirements
- DevSecOps teams integrating observability with security
- Organizations operating in regulated industries (finance, healthcare, government)
Pricing & Customer Reviews:
- Pricing: Starts at ~$3.30–$4.50 per TB scanned (log data); security and analytics priced separately
- G2 Rating: 4.2/5
Customers praise Sumo Logic’s log performance and security integrations but often report cost unpredictability, tracing limitations, and lack of OTEL-native flexibility as key drawbacks.
Sumo Logic vs Lightstep:
Sumo Logic shines in log analytics and security monitoring, while Lightstep is built for high-resolution tracing and real-time service insights. Sumo Logic’s strength lies in log-heavy workflows and compliance, whereas Lightstep provides more actionable performance diagnostics and faster root cause detection in microservices. However, neither tool delivers a complete MELT stack or supports smart sampling and flexible hosting. For teams seeking OpenTelemetry-native ingestion, end-to-end MELT observability, smart sampling, and transparent cost control, CubeAPM is the more scalable and future-proof choice.
Conclusion: Choosing the Right Lightstep Alternative
As observability demands evolve, many engineering teams are re-evaluating tools like Lightstep — especially those limited to tracing or cloud-only deployments. While Lightstep delivers real-time telemetry and performance diagnostics, it lacks broader MELT coverage, smart sampling, and cost predictability — features that have become essential in today’s high-scale, OpenTelemetry-driven environments.
Whether the need is to support real user monitoring, deploy on-prem for data residency, or avoid unpredictable per-GB billing, the market now offers alternatives that are not only more capable but also more aligned with modern DevOps workflows.
Why CubeAPM Leads the Pack
Among all Lightstep alternatives, CubeAPM stands out for its OpenTelemetry-native architecture, full-stack observability, and smart sampling engine that cuts costs without compromising data fidelity. It offers real-time MELT coverage (metrics, events, logs, traces), synthetic monitoring, and RUM — all while supporting compliance-friendly self-hosting and flat, ingestion-based pricing. With CubeAPM, teams benefit from up to 60–80% lower costs vs. legacy APM tools.
Whether you’re outgrowing Lightstep’s tracing-only model or seeking a cost-efficient, OpenTelemetry-first observability stack, CubeAPM delivers the performance, flexibility, and transparency that modern engineering teams demand — without the operational overhead or vendor lock-in.

