Glowroot is a lightweight, open-source Java APM valued for its quick setup, JVM-level metrics, transaction traces, and error tracking, making it a solid choice for Java-centric teams. Yet, with the APM market expected to reach $46.89 billion by 2030, organizations now expect full-stack observability. Glowroot’s lack of RUM, log aggregation, infrastructure telemetry, synthetics, and native OpenTelemetry support often leads teams to explore more feature-rich, multi-stack alternatives.
CubeAPM is the best alternative to Glowroot. CubeAPM delivers full-stack observabilit, native OpenTelemetry support for vendor-neutral integration, 800+integrations. CubeAPM supports multiple languages, offers both self-hosted, and provides predictable, cost-efficient pricing $0.15/GB saving costs by upto 80% without hidden fees.
In this article, we’ll explore the top Glowroot alternatives, comparing their features, deployment models, pricing structures, and scalability, to help you choose the best fit for your observability needs.
Table of Contents
ToggleTop 7 Glowroot Alternatives
- CubeAPM
- SigNoz
- Grafana
- AppSignal
- New Relic
- Datadog
- Dynatrace
Why Look for Glowroot Alternatives?
1. Limited Scope (Java-only, agent-centric)
Glowroot is designed specifically for JVM environments, tracking slow methods, SQL queries, and traces. It cannot monitor applications built in other languages or provide insights into frontend performance.
2. No Log Aggregation or Infrastructure Monitoring
The tool does not include built-in log ingestion, aggregation, or infrastructure/host/cloud monitoring. This limits visibility into the full technology stack.
3. No Synthetic or Uptime Monitoring
Glowroot lacks the ability to perform synthetic checks or external availability monitoring, which are key for tracking user-facing uptime and service health.
4. Lacks OpenTelemetry Native Support
OpenTelemetry has become a standard for observability, but Glowroot does not natively integrate with it. This limits portability and standardization across observability pipelines.
5. Self-Hosted Only with Community Support
While being open-source and self-hosted is cost-effective, Glowroot relies solely on community channels for support, without enterprise SLAs or managed hosting options.
Criteria for Suggesting Glowroot Alternatives
1. Multi-Stack Support
Alternatives should be capable of monitoring applications across multiple programming languages, cloud providers, and containerized environments—not just Java.
2. Full-Stack Observability (MELT + RUM + Synthetics)
The ideal tool should cover metrics, events, logs, and traces, while also offering real-user monitoring and synthetic testing capabilities.
3. OpenTelemetry Integration
Native OTel instrumentation ensures flexibility, interoperability, and vendor-neutral observability.
4. Deployment Flexibility
Options for self-hosting, SaaS, and hybrid deployments allow teams to match their security, compliance, and cost requirements.
5. Scalability and Cost Efficiency
Pricing should remain predictable as data volume and infrastructure grow, avoiding steep cost spikes.
6. Efficient Data Management
Solutions should handle data storage, retention, and archival efficiently—without unnecessary egress fees or compliance risks.
7. Support and SLA Options
Enterprise-ready support, SLAs, and strong documentation are essential for organizations running mission-critical workloads.
Glowroot Overview
Known for
Glowroot is an open-source, lightweight Java APM designed for quick setup and minimal overhead. It’s best known for capturing JVM-level metrics, transaction traces, slow query detection, and error tracking, making it ideal for Java-centric environments.
Standout Features
- Lightweight Agent: Deployed via -javaagent with minimal performance impact.
- Real-Time Tracing & Profiling: Captures method-level execution details and continuous profiling data.
- Responsive UI: Works seamlessly across desktop and mobile.
- Optional Central Collector: Enables aggregation from multiple JVMs into a single dashboard.
Key Features
- JVM metrics and garbage collection stats via MBeans.
- Slow transaction and error detection with configurable thresholds.
- SQL and service call aggregation for performance analysis.
- Historical data rollups for trend tracking.
- Alerting based on custom conditions.
- Support for async request workflows.
Pros
- Extremely low resource footprint
- Simple and fast deployment
- Detailed JVM insights without extra licensing costs
- Mobile-friendly interface
- Flexible self-hosting options
Cons
- Java-only monitoring
- No real user monitoring (RUM)
- No log aggregation or infrastructure monitoring
- Lacks synthetics and uptime checks
- No native OpenTelemetry integration
- Community-only support, no enterprise SLA
Best for
Teams running Java-based applications who want a cost-free, self-hosted APM for JVM diagnostics and are comfortable operating without broader observability features.
Pricing & Customer Reviews
Glowroot is free under the Apache 2.0 license, with no licensing fees—costs are limited to hosting infrastructure.
Top 7 Glowroot Alternatives
1. CubeAPM
Known for
CubeAPM is a modern full-stack observability platform built to replace or extend limited APM setups like Glowroot. It’s designed for speed, simplicity, and cost efficiency, combining metrics, logs, traces, infrastructure monitoring, database monitoring, synthetics, RUM, and error tracking in one platform, with native OpenTelemetry support.
Key Features
- Application Performance Monitoring – End-to-end visibility into APIs, services, and transaction flows.
- Distributed Tracing – Context-aware smart sampling to retain the most valuable traces while cutting storage costs.
- Log Monitoring – Unified log collection and querying for faster troubleshooting.
- Infrastructure Monitoring – Host, container, and cloud resource health tracking.
- Synthetic Monitoring – Unlimited checks for uptime and performance from multiple locations.
- Real User Monitoring (RUM) – Measures actual end-user experience in browsers.
- Error Tracking – Unlimited error capture with detailed diagnostics.
Standout Features
- Smart Sampling – Retains high-value traces like slow or failed requests at greater efficiency, delivering over 60% cost savings compared to traditional probabilistic sampling.
- Data Localization Compliance – Stores telemetry inside the customer’s own cloud to reduce egress costs and meet data sovereignty requirements.
- High Compatibility – Works seamlessly with New Relic, Datadog, Prometheus, Elastic, and other popular agents.
Pros
- Comprehensive MELT + RUM coverage in a single platform
- Native OpenTelemetry compatibility
- Predictable flat-rate or usage-based pricing without hidden fees
- Faster support via Slack/WhatsApp channels with core developers
- Flexible self-hosted or SaaS deployment
Cons
- Not suited for teams looking for off-prem solutions
- Strictly an observability platform and does not support cloud security management
Best for
Organizations that want to move beyond Java-only monitoring to a unified, multi-stack observability platform, reduce costs through efficient sampling, and maintain data within their own cloud for compliance.
Pricing & Customer Reviews
Pricing:
- Data Ingestion: $0.15/GB
Customer Reviews:
- Customer Rating: 4.7/5 based on end-user feedback
- Users highlight CubeAPM’s affordability, responsive support, and comprehensive feature set. Some note that, as a newer platform, its ecosystem is still growing compared to longer-established solutions.
CubeAPM vs Glowroot
Glowroot is a capable JVM-only APM but lacks multi-language support, RUM, synthetics, and native OpenTelemetry. CubeAPM offers a complete MELT + RUM stack with smart sampling, compatibility across environments, and compliance-friendly deployment, making it a scalable upgrade for teams outgrowing Glowroot’s limited scope.
.2. SigNoz

Known for
SigNoz is an open-source, OpenTelemetry-native observability platform that unifies metrics, logs, and traces into one interface. It’s a cost-effective alternative to SaaS APM tools, offering transparency, self-hosting, and full-stack coverage.
Key Features
- OpenTelemetry-Native – Seamless OTel integration for vendor-neutral instrumentation.
- Distributed Tracing – View end-to-end requests across microservices.
- Metrics Monitoring – Capture system and application metrics with alerting.
- Log Management – Integrated log storage and search.
- Self-Hosting – Run in your own cloud or on-prem for compliance control.
- Dashboards & Visualization – Customizable charts for all telemetry types.
Standout Features
- All-in-One Telemetry – Combines MELT in a single platform.
- Open Source Control – No vendor lock-in, full access to source code.
Pros
- Open-source and free to self-host
- Native OTel support
- Complete MELT coverage
- Flexible deployment
Cons
- Requires self-hosting for cost control
- Smaller ecosystem compared to major SaaS APMs
- No advanced AI-driven analytics
Best for
Engineering teams seeking an OTel-first, self-hosted APM with full MELT coverage and no vendor lock-in.
Pricing & Customer Reviews
Pricing:
- Free self-hosted version available
- Free tier + base fee of $49/month. Charges beyond the base fee are based on data ingested:
- Traces: $0.30/GB.
- Logs: $0.30/GB.
- Metrics: $0.10/million samples.
Customer Reviews:
- Customer Rating: 4.6/5(G2)
- Praised for transparency, OTel integration, and active development community.
SigNoz vs Glowroot
Glowroot is Java-only and lacks OTel integration, RUM, and logs. SigNoz provides multi-language support, native OTel, and integrated logs, making it better suited for polyglot, cloud-native environments.
3. Grafana
Known for
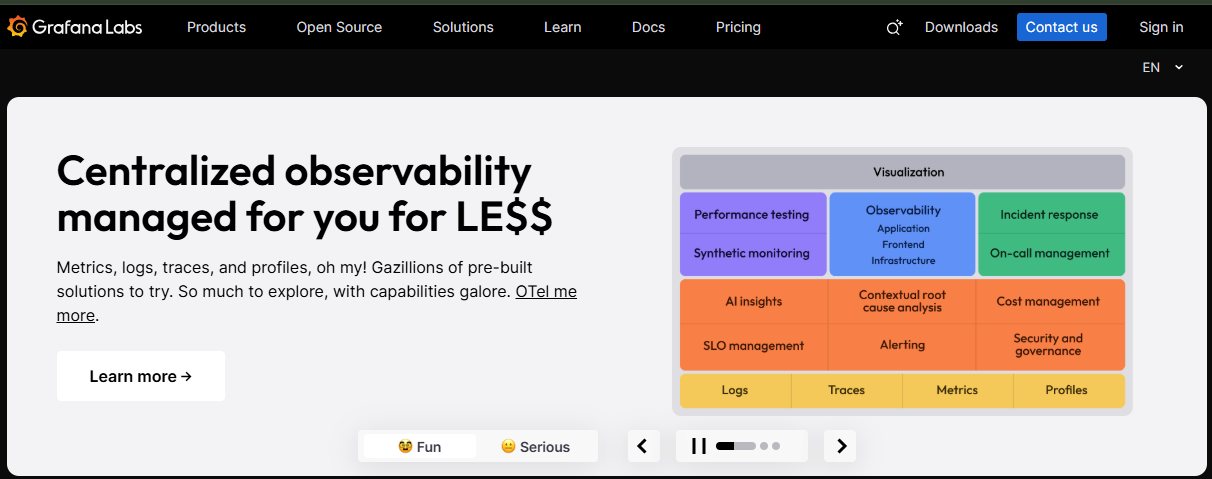
Grafana is an open-source visualization and analytics platform widely used for dashboards, metrics, and alerting. While not a complete APM by itself, it integrates with Prometheus, Loki, Tempo, and other telemetry sources for observability.
Key Features
- Custom Dashboards – Visualize metrics from multiple data sources.
- Alerting System – Trigger alerts from any connected data source.
- Integration Ecosystem – 100+ data source connectors.
- Templating & Variables – Dynamic dashboard rendering.
- Annotations – Add context to time-series data.
Standout Features
- Data Source Flexibility – Works with any MELT-compatible backend.
- Extensive Plugin Library – Community and enterprise plugins for visualization.
Pros
- Open-source and free
- Highly customizable
- Broad integration capabilities
Cons
- Not a full APM without paired tools
- No native RUM or tracing without Tempo/Jaeger integration
- Requires configuration effort
Best for
Teams wanting flexible, centralized dashboards that aggregate metrics, logs, and traces from different sources.
Pricing & Customer Reviews
Pricing:
- Free OSS version
- Free: All Grafana Cloud services, limited usage, 14 days retention
- Pro: $19 / month + usage, 8X5 email support 13 months retention for metrics; 30 days retention for logs
- Enterprise: $25,000 year , Premium support, Custom retention, Deployment flexibilit
Customer Reviews:
- Customer Rating: 4.5/5
- Praised for customization and visualization power, with some noting complexity for new users.
Grafana vs Glowroot
Glowroot offers JVM-level performance data out of the box. Grafana, while more versatile, requires backend systems like Prometheus or Loki to achieve similar APM coverage.
4. AppSignal
Known for
AppSignal is a SaaS APM focused on developers, offering application monitoring, error tracking, metrics, and alerting for multiple languages.
Key Features
- Multi-Language Support – Ruby, Elixir, JavaScript, Node.js, and more.
- Error Tracking – Centralized error reports with context.
- Performance Monitoring – Track response times, throughput, and slow transactions.
- Host Metrics – Basic infrastructure telemetry.
- Custom Dashboards – Visualize application and system metrics.
Standout Features
- Developer-Friendly UX – Clean interface and easy setup.
- Custom Metrics API – Track custom application metrics.
Pros
- Simple onboarding
- Multi-language coverage
- Integrated APM + error tracking
Cons
- Less extensive tracing compared to advanced tools
- Limited log management
- Pricing can rise with scale
Best for
Small to mid-sized dev teams seeking a straightforward APM with error tracking and multi-language support.
Pricing & Customer Reviews
Pricing:
- Free: Logging first 1GB/month
- APM $25 for 250K requests/month
- Enterprise SAML SSO ($ 599 per month)
- Long-term log storage ($ 99 per month)
- HIPAA Compliance ($ 99 per month)
Customer Reviews:
- Customer Rating: 4.6/5(G2)
- Praised for ease of use, but some note lack of enterprise-scale features.
AppSignal vs Glowroot
Glowroot is JVM-only with no multi-language capability, while AppSignal supports several languages and offers integrated error tracking, making it a better fit for diverse stacks.
5. New Relic
Known for
New Relic is a leading SaaS observability platform offering MELT coverage, AI-powered analytics, and multi-language APM.
Key Features
- Full-Stack Observability – Metrics, events, logs, traces in one UI.
- APM – Code-level insights across multiple languages.
- Browser Monitoring – RUM for frontend performance.
- Infrastructure Monitoring – Hosts, containers, and cloud resources.
- Synthetic Monitoring – Proactive uptime and performance checks.
Standout Features
- AI Insights – Anomaly detection and root cause analysis.
- Massive Integration Library – 500+ supported technologies.
Pros
- Complete observability suite
- Strong enterprise adoption
- Advanced analytics
Cons
- Pricing complexity
- Higher cost at scale
- Data residency limitations
Best for
Enterprises needing a mature, feature-rich observability platform with global support.
Pricing & Customer Reviews
Pricing:
- Free: 1000GB per month
- Ingestion based pricing of $0.35/GB + $400/user/month for full access
Customer Reviews:
- Customer Rating: 4.4/5(G2)
- Praised for breadth of features, with some noting unpredictable costs.
New Relic vs Glowroot
Glowroot is lightweight and free but narrow in scope. New Relic delivers enterprise-scale observability across diverse stacks, making it more suitable for complex, distributed environments.
6. Datadog
Known for
Datadog is a cloud-based observability platform covering infrastructure monitoring, APM, logs, RUM, and security monitoring.
Key Features
- Full-Stack Monitoring – Infrastructure, APM, logs, RUM, synthetics.
- APM – Distributed tracing and code profiling.
- Log Management – Centralized log storage and search.
- Synthetic Monitoring – HTTP and browser tests.
- Security Monitoring – Threat detection and compliance checks.
Standout Features
- Unified Platform – Single pane of glass for observability and security.
- Extensive Integration Library – 500+ integrations.
Pros
- Broad coverage across MELT and security
- Scalable cloud deployment
- Rich integration ecosystem
Cons
- High cost at scale
- Complex pricing model
- Retention-based upsells
Best for
Organizations seeking an all-in-one, SaaS-based observability tool with global reach.
Pricing & Customer Reviews
Pricing:
- Infrastructure: $15/host/month
- APM: $31/host/month
- Log ingestion priced per GB
Customer Reviews:
- Customer Rating: 4.4/5(G2)
- Praised for breadth of integrations, with concerns about pricing transparency.
Datadog vs Glowroot
Glowroot is free and JVM-specific, while Datadog offers a complete MELT stack across any environment but at a significantly higher cost.
7. Dynatrace
Known for
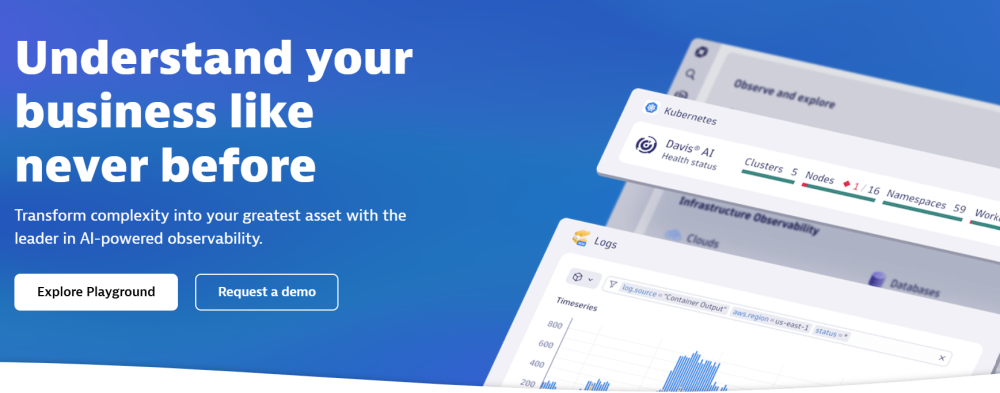
Dynatrace is an AI-powered observability platform delivering deep application insights, infrastructure monitoring, and business analytics.
Key Features
- APM – Code-level visibility across multiple languages.
- AI-Powered Insights – Davis AI for root cause analysis.
- Infrastructure Monitoring – Cloud, hosts, containers, and network.
- Digital Experience Monitoring – RUM and synthetics.
- Business Analytics – Track user journeys and KPIs.
Standout Features
- OneAgent – Single agent for full-stack data collection.
- Automatic Topology Mapping – Visual service dependency mapping.
Pros
- Comprehensive observability in one agent
- Advanced AI-driven analytics
- Strong enterprise features
Cons
- Premium pricing
- Complex setup for custom instrumentation
- Steeper learning curve
Best for
Large enterprises seeking AI-enhanced, all-in-one observability with strong automation features.
Pricing & Customer Reviews
Pricing:
- $0.08/hour per 8 GiB host (~$57.60/host/month)
Customer Reviews:
- Customer Rating: 4.5/5(G2)
- Praised for automation and depth, with some noting high costs.
Dynatrace vs Glowroot
Glowroot is simple and Java-specific, while Dynatrace delivers AI-powered observability for complex multi-cloud environments, making it more suited for enterprise-scale operations.
Conclusion
Glowroot remains a lightweight and capable option for Java-specific performance monitoring, offering quick setup, low overhead, and solid JVM-level insights. However, as modern applications increasingly span multiple languages, architectures, and telemetry needs, its limitations in areas like RUM, synthetics, infrastructure monitoring, log aggregation, and OpenTelemetry integration become apparent.
The alternatives explored—CubeAPM, SigNoz, Grafana, AppSignal, New Relic, Datadog, and Dynatrace—offer a range of capabilities to suit different teams, from open-source, self-hosted stacks to enterprise-grade, AI-powered observability suites. For teams seeking the most balanced upgrade from Glowroot, CubeAPM stands out with its full MELT + RUM coverage, smart sampling, multi-language support, cost efficiency, and compliance-friendly deployment, making it a scalable, future-ready choice.


