









Splunk has long been the default choice for log management and observability in large enterprises. But ClickStack, the open-source observability stack from ClickHouse, is now a credible alternative built for modern, high-cardinality OpenTelemetry workloads at petabyte scale.
This guide breaks down how ClickStack and Splunk compare across architecture, query language, pricing, performance, and use cases so you can decide which platform suits your team.
🔑 Key Takeaways
- ClickStack is built on ClickHouse, an open-source columnar database, with OpenTelemetry as the ingestion layer and HyperDX as the visualization UI.
- Splunk uses a proprietary index-based architecture and SPL query language, optimized for IT operations and SIEM security use cases.
- ClickStack delivers sub-second queries across trillions of rows with 10x to 30x compression; Splunk searches can degrade at scale without pre-aggregation.
- ClickStack pricing starts at ~$160/month managed or is free to self-host; Splunk can cost $200,000+ per year at 100 GB/day of ingest.
- ClickStack lacks native SIEM/security analytics; Splunk remains stronger for compliance and threat detection workflows.
- Both tools support OpenTelemetry, but ClickStack is OTel-native by design.
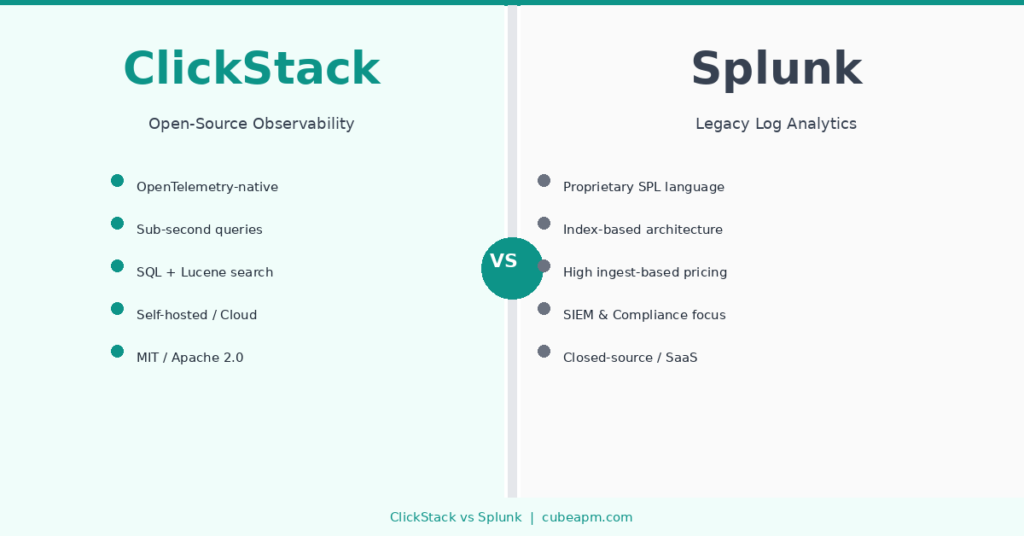
ClickStack vs Splunk at a Glance
What Is ClickStack?
ClickStack is an open-source observability platform launched in 2025 after ClickHouse acquired HyperDX. It combines three components: ClickHouse (the columnar storage and query engine), the HyperDX UI (logs, traces, dashboards, session replay), and the OpenTelemetry Collector (telemetry ingestion). All telemetry signals including logs, traces, metrics, and session replays are stored in a single ClickHouse instance.
ClickStack was purpose-built to solve the cost and fragmentation problems of legacy observability. Companies like Tesla, OpenAI, and Anthropic use ClickHouse-based observability at scale. Anthropic reported significant cost and performance savings after switching.
What Is Splunk?
Splunk is a long-established log analytics and security intelligence platform first released in 2004. It uses a forwarder-indexer-search head architecture and its own query language, SPL (Search Processing Language). Splunk is widely used for IT operations, SIEM, and compliance reporting across large enterprises.
In March 2024, Cisco completed its acquisition of Splunk for $28 billion. The platform now exists as Splunk Enterprise (on-premises) and Splunk Cloud. Splunk also offers a separate Splunk Observability Cloud product for APM and infrastructure monitoring.
ClickStack vs Splunk: Side-by-Side Comparison
| Category | ClickStack | Splunk |
| Architecture | Columnar (ClickHouse), decoupled storage & compute | Index-based forwarder-indexer-search head model |
| Query Language | SQL + Lucene-like syntax + natural language | Proprietary SPL (Search Processing Language) |
| Pricing Model | Resource-based; ~$160/mo managed; free self-hosted | Ingest, workload & host-based; $200K+/yr at 100 GB/day |
| OpenTelemetry | OTel-native by design (OTLP, logs, traces, metrics) | OTel supported but not natively optimized |
| Self-Hosted | Yes (MIT / Apache 2.0) | Limited; Splunk Enterprise on-prem |
| Session Replays | Yes, via HyperDX UI | No |
| SIEM / Security | No native security analytics or predefined SIEM rules | Yes, full SIEM with threat detection & compliance |
| Scalability | Petabyte-scale; horizontal + vertical; elastic Cloud | Scales but requires manual tuning and pre-aggregation |
| Compression | 10x to 30x for OTel data | Lower; index-based storage |
| Deployment | Docker, Kubernetes, Helm, ClickHouse Cloud | Splunk Cloud or Splunk Enterprise on-prem |
| License | MIT (HyperDX) + Apache 2.0 (ClickHouse, OTel collector) | Proprietary / closed-source |
Architecture
ClickStack Architecture
ClickStack uses ClickHouse, a columnar OLAP database, as its storage and query engine. Data is written once and queried across logs, traces, metrics, and session replays from a single table schema. The OpenTelemetry Collector handles ingestion via OTLP over gRPC (port 4317) or HTTP (port 4318). HyperDX provides the UI layer with Lucene and SQL query modes.
In ClickHouse Cloud, storage and compute are fully decoupled, allowing independent scaling of ingest and query workloads. On-premises deployments use Docker or Helm on Kubernetes. The ClickHouse engine applies delta encoding for timestamps and ZSTD compression for strings, achieving 10x to 30x compression on typical OTel data.
Splunk Architecture
Splunk uses a coupled forwarder-indexer-search head model. Forwarders collect data from endpoints and send it to indexers, which store compressed events in buckets. Search heads execute SPL queries against indexers. Indexing and search share the same compute, which can cause contention under heavy load.
Splunk added SmartStore to decouple storage from indexers using object storage, but compute remains static and performance still depends on I/O tuning and pre-aggregations (Data Model Acceleration, tstats) to stay performant at scale.
Query Language and Usability
ClickStack: SQL and Lucene
ClickStack supports two query modes in the HyperDX UI. The Lucene-like syntax lets users type a word like error and instantly filter logs without writing a full query. For deeper analysis, full SQL with hundreds of analytical functions is available. The two modes can be combined for exploratory to analytical workflows.
The HyperDX UI also correlates logs, traces, and session replays in a single view. A developer can go from a session replay of a user clicking checkout, to the failing API trace, to the database query that caused the timeout, without switching tools. (Splunk: SPL (Search Processing Language)
Splunk uses SPL, a powerful but proprietary query language with a pipeline-based syntax. SPL is expressive for log analytics and security use cases but requires dedicated learning. Teams moving to Splunk from SQL-based tools often face a steeper onboarding curve.
A Splunk co-founder of HyperDX noted in a Reddit thread: “PMs who struggled to build dashboards they wanted in Splunk were able to do so in HyperDX on their own.”
Pricing
ClickStack Pricing
ClickStack is free to self-host. The HyperDX UI is released under the MIT license. ClickHouse and the OpenTelemetry collector components are Apache 2.0. Teams running ClickStack on their own infrastructure pay only for compute and storage.
For managed deployments via ClickHouse Cloud, pricing starts at approximately $160 per month, with storage costing low cents per GB. Resource-based pricing means you pay for what you consume, not a fixed ingestion volume.
Splunk Pricing
Splunk uses a complex combination of ingest-based, workload-based, and host-based pricing depending on the product and edition. Splunk Enterprise requires per-GB ingest licensing and often additional infrastructure costs.
Performance
ClickStack delivers consistent sub-second query performance through ClickHouse’s vectorized, fully parallelized columnar execution engine. Queries scan only the columns needed, supported by built-in data skipping indexes and optional inverted indexes. Insert throughput reaches approximately 1 TB per core per day uncompressed.
Splunk’s event-based indexing model means ingest and search share the same compute resources. Large queries span multiple indexers with full bucket scans, resulting in multi-minute latencies at scale unless pre-aggregations are scheduled. ClickHouse’s JSON column type also delivers 10x faster searches and 100x less data scanned compared to string-based storage approaches.
OpenTelemetry Support
ClickStack is OpenTelemetry-native by design. The OTel Collector is pre-configured to export logs, traces, and metrics directly to ClickHouse via OTLP. SDKs are available for Python, Node.js, Java, Go, .NET, Ruby, PHP, Rust, and Elixir. ClickStack also supports scraping Prometheus /metrics endpoints via the prometheus receiver.
Splunk added OpenTelemetry support through the Splunk Distribution of OpenTelemetry Collector. However, all data still flows through Splunk’s indexing layer before it can be queried, which limits the flexibility and performance gains that OTel-native architectures offer.
When to Use ClickStack
- Your team is already using or migrating to OpenTelemetry
- You want to self-host your observability stack under an open-source license
- You need sub-second queries across high-cardinality logs and traces at petabyte scale
- You want session replay correlated with backend traces and logs in a single view
- Cost control is a priority and you want resource-based rather than ingest-based pricing
- You are already running ClickHouse and want to consolidate telemetry storage
When to Use Splunk
- Your organization requires a full SIEM platform with built-in threat detection and compliance rules
- You rely on SPL-based pipelines, dashboards, or existing Splunk apps and integrations
- Your use case is primarily IT operations or security analytics rather than application observability
- You need Splunk-specific ecosystem integrations with ITSM, SOAR, or UBA platforms
- Your organization is subject to compliance frameworks that require Splunk-certified data handling
ClickStack Limitations to Know
ClickStack does not include native security analytics, predefined SIEM rules, or threat detection. Teams using Splunk primarily as a SIEM should evaluate dedicated alternatives.
ClickStack’s PromQL compatibility is still maturing, making it less suitable for organizations deeply invested in Prometheus-based alerting. There is also no native profiling or flame graph support as of mid-2025. The number of out-of-the-box dashboards and connectors is smaller than legacy platforms.
📌 Looking for a Cost-Effective Observability Platform?
CubeAPM is a self-hosted, OpenTelemetry-native APM with flat-rate pricing at $0.15/GB. No per-host fees, no per-user charges, no hidden costs. Teams like Delhivery cut observability costs by 75% after switching.
Try CubeAPM alongside ClickStack and Splunk to find the right fit for your stack.
Conclusion
ClickStack and Splunk serve different primary needs. ClickStack is a modern, open-source observability platform optimized for OpenTelemetry workloads, offering unified logs, traces, metrics, and session replays with sub-second query performance and cost-effective self-hosted or managed deployments. Splunk is a mature enterprise platform with deep SIEM capabilities, extensive integrations, and a large ecosystem, but it carries higher costs and a steeper query language learning curve.
For teams prioritizing observability, cost efficiency, and OTel-native workflows, ClickStack is worth a serious look. For teams whose core use case is security monitoring, compliance, and IT operations at an enterprise scale, Splunk may still be the right fit.
⚠️ Disclaimer
This article is for informational purposes only. Pricing figures are based on publicly available sources as of mid-2025 and may change. Always verify current pricing directly with ClickHouse (clickhouse.com) and Splunk (splunk.com) before making purchasing decisions. Feature availability may vary by product edition and deployment model.
FAQs
1. Is ClickStack completely free to use?
Yes. ClickStack can be self-hosted at no cost. HyperDX is MIT-licensed and ClickHouse is Apache 2.0. For managed deployments, ClickHouse Cloud starts at approximately $160 per month with resource-based pricing.
2. Does ClickStack replace Splunk for SIEM use cases?
No. ClickStack is focused on application observability and does not include predefined security threat detection rules or native SIEM functionality. If your primary use case is security analytics, Splunk or a dedicated SIEM platform is more appropriate.
3. What query language does ClickStack use?
ClickStack supports both a Lucene-like syntax for quick log filtering and full SQL for analytical queries. The HyperDX UI includes natural language search as well. Splunk uses SPL, its proprietary Search Processing Language.
4. Can ClickStack handle petabyte-scale data?
Yes. ClickStack is built on ClickHouse, which is designed for petabyte-scale analytics. Tesla processes over one billion events per second using ClickHouse. ClickStack achieves 10x to 30x compression on OTel data and delivers sub-second query performance at scale.
5. How does ClickStack ingest data?
ClickStack uses the OpenTelemetry Collector for ingestion. Applications instrument with OTel SDKs (Python, Node.js, Java, Go, .NET, Ruby, PHP, Rust, Elixir) and send telemetry via OTLP over gRPC or HTTP. ClickStack can also scrape Prometheus /metrics endpoints directly.