In observability, “legacy” is a stage where platform assumptions no longer match how a system actually behaves. It is not a category of tools by itself.
Most APM platforms are built around stable infrastructure, predictable traffic patterns, and manageable telemetry volume. As systems evolve toward microservices and cloud-native architectures, those conditions change. Deployments become more frequent, environments more dynamic, and telemetry grows in both volume and complexity.
Over time, limitations that were once acceptable become operational risks. Cost control becomes harder. Incident investigations require more manual correlation. Teams may end up spending more time mitigating symptoms and less time understanding system behavior.
This article explains how and why teams outgrow legacy APM platforms, and how that transition typically unfolds as modern systems mature.
What Legacy APM Platforms Were Originally Built For
To understand why teams outgrow legacy APM platforms, it helps to step back and look at the world these tools were designed for. The original design assumptions made sense at the time. And worked well in many environments. Now, the problem is that software changed faster than that tool’s core model, not that they were poorly built.

Monolithic or Lightly Distributed Applications
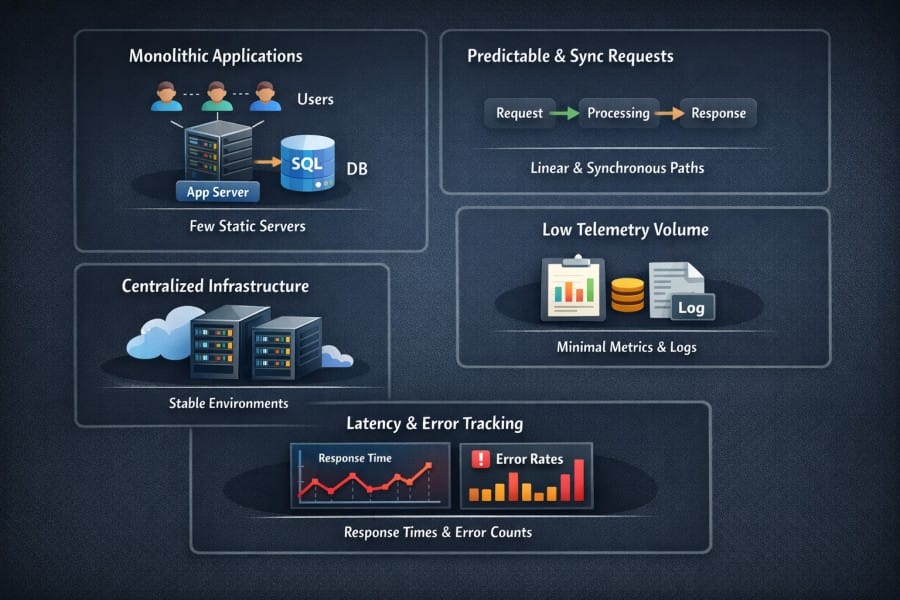
Most companies ran monolithic applications or, at most, lightly distributed systems. A single application handled most business logic. It ran on a small number of long-lived servers. Service boundaries were clear and rarely changed.
In a survey, 42 % of respondents accepted that they were still using monolithic architecture for their main applications.
In this setup, performance problems were usually local, such as:
- Low database queries
- Blocked threads
- Memory leaks inside a process
Legacy APM platforms helped here by tracking requests inside one application and assumed the majority of the work happened there. Instead of following a request across dozens of services, teams needed visibility into one runtime, call stack, and database connection pool.
Predictable Request Paths and Synchronous Flows
Back in the time,
- Request paths were predictable. A request came in, executed synchronously, and returned a response.
- There was little fan-out. No async chains spanning multiple systems. No background workers triggered by message queues.
Because of this, tracing was easier. Tools could assume a clean start and end for every request. Correlation was also easy. Most performance issues showed up directly in response time charts or error counts.
Legacy APM agents complemented this linear execution model. They worked best when application behavior followed a clean and repeatable path.
Centralized and Static Infrastructure
Before widespread cloud adoption, fewer enterprise workloads ran in public cloud environments.
- Infrastructure environments were stable
- Servers lived for months or years
- Scaling happened slowly and usually manually
- IP addresses stayed the same. Hostnames were rarely changed.
In this model, heavyweight agents made sense. They could be installed once and left running. Configuration drift was also minimal. Observability tooling assumed that infrastructure behaved like a fixed asset and not dynamic.
Small Telemetry Volumes with Manual Instrumentation
In the past, telemetry volumes were minimal.
- Smaller logs
- Limited dimensions in metrics
- Rare and expensive traces
Instrumentation was usually manual or semi-manual. Engineers could decide which transactions mattered and which metrics to collect. Therefore, data volumes were under control, and their storage was also affordable.
Because of smaller telemetry, platforms could store everything without aggressive sampling or cost controls. Most teams weren’t concerned about Cardinality and daily ingestion limits.
Latency and Error Rate Tracking
Previously,
- Operational goals used to be narrow and clear
- Teams mainly tracked request latency, throughput, and error rates.
- If response times stayed low and error rates stayed flat, the system was considered healthy.
Legacy APM dashboards focused on average response time, slow transactions, and exception counts. These signals were enough to keep monolithic systems running reliably.
This model worked as systems were simple and tightly coupled. The cracks only appeared when architectures became more distributed, and failures became harder to explain for teams.
The First Cracks: When Legacy APM Stops Scaling
Legacy APM platforms rarely fail overnight. They keep working even if the workload grows. At first, everything looked fine. Dashboards and alerts still work. The problems appear quietly as systems grow past the conditions these tools were actually designed for.
An increase in service, traffic, and deployment velocity starts breaking things. Although the APM platform collects data, it doesn’t tell the full story. Teams can’t see failures outright, so investigations take longer. Costs creep up, but confidence drops.
Microservices Break Core Assumptions
Microservices change how systems behave under load. Legacy APM tools were not built with this level of distribution in mind.
Trace Explosion
In a microservices architecture, a single request doesn’t always stay in one place. It fans out across APIs, databases, caches, and background workers. Each hop adds spans. Each retry multiplies them.
Similarly, trace volume grows faster than traffic. A small increase in requests can produce a large increase in spans. Legacy APM platforms, which were designed for shallow call stacks, fail here as they can’t provide deep service graphs. Ultimately, teams have to sample aggressively and without clear control over what’s safe to drop.
Partial Visibility
Many legacy APM tools consider the request as the primary unit of observation. That works when most work happens in-line and synchronously.
In microservices, important work often happens outside the original request. Background jobs, event handlers, and downstream services do critical processing. If the platform’s instrumentation models are rigid, the platform may not capture these paths or capture them without context.
In either case, teams get partial visibility. They see fragments of behavior but struggle to understand how those fragments connect.
Asynchronous Boundaries Break Transaction Flow
Asynchronous messaging is now common. Queues, streams, and task schedulers handle large parts of system behavior. Legacy APM platforms often lose correlation at these boundaries.
- Trace context does not propagate cleanly.
- Transactions appear to end prematurely.
- Engineers must reconstruct flows manually using logs and timestamps.
This gap becomes a serious liability during an incident. The tool helps you track the slow part of the system, but it can’t reliably show how the system reached that state.
Cloud-Native Environments Change the Ground Rules
Cloud-native infrastructure introduces a different kind of stress. The environment can become dynamic, even when service logic is simple.
Fast, Constantly Changing Workloads
The 2024 CNCF survey reveals that over 79% of Kubernetes workloads run on autoscaling infrastructure.
Legacy APM platforms assume that hosts are long-lived, but the reality is different. When workloads disappear, historical continuity breaks. Metrics reset, and traces lose host context. Troubleshooting spans across infrastructure that no longer exists.
Visibility Gaps
During incidents and peak loads, autoscaling changes system behavior. New instances occur at exactly the time teams need the clearest visibility.
Static instrumentation and fixed sampling rules may not work here. Data volume also spikes at the wrong time. Platforms either drop data or overwhelm themselves. The most valuable moments for diagnosis produce the least reliable insight.
Static Agent Models Cannot Keep Up
Legacy agents expect slow change. But cloud-native systems are deployed continuously.
The DORA 2024 report shows that elite teams deploy code multiple times per day, with infrastructure changing just as frequently.
Keeping agents correctly configured across fast-moving environments becomes operational work. Coverage gaps appear quietly. Teams discover them only when investigations fail.
At this stage, teams usually sense the mismatch. The platform still runs, but it no longer scales with the system. That tension sets up the deeper challenges around cost, ownership, and control that follow.
Why Legacy APM Struggles in Modern Distributed Systems
Once systems become distributed, the limitations of legacy APM become part of daily operations. The tool collects data, but can’t clearly show how systems behave in production. This mismatch shows up in two places: the data model and the collection architecture.

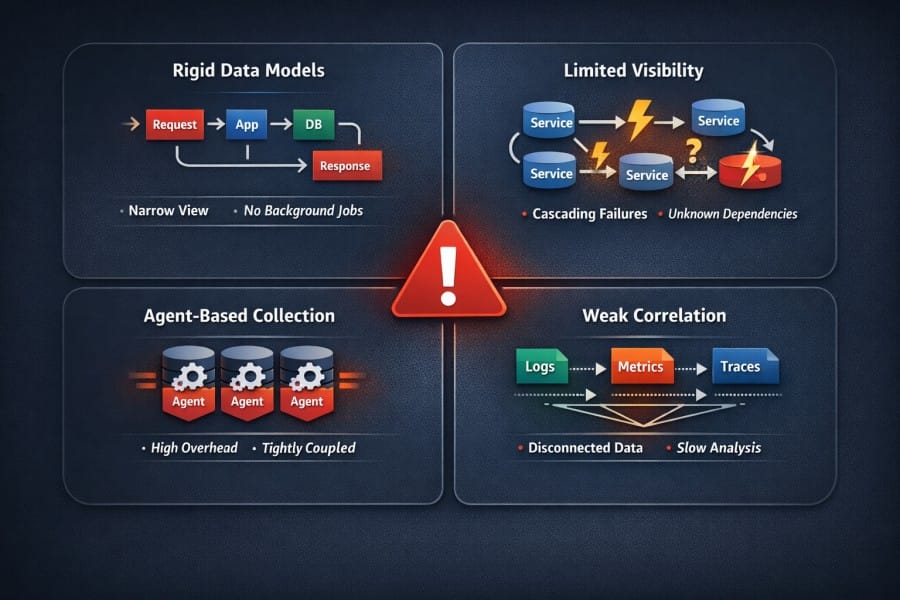
Rigid Data Models
Legacy APM platforms rely on data models built around a narrow view of how applications work. That view does not hold up well once systems spread across many services and execution paths.
Assumptions Centered on Requests, Not Systems
Many legacy APM tools are request-centred. They assume meaningful work begins and ends with a user request. Modern systems violate this assumption constantly. Background processes, scheduled jobs, retries, and event-driven workflows affect system health.
Due to rigid data models that fail to clearly represent these workflows, teams can’t visualise how the system behaves under load.
Limited Visibility into Behavior
Individual components are not sufficient to explain or predict the behavior of distributed systems. Issues, such as retries, cascading timeouts, and partial outages, may occur.
A 2023 Google SRE analysis showed that over 60% of major production incidents involved cascading failures across multiple services, and not a single faulty component.
Legacy APMs assume systems have known hierarchies and stable paths. Emergent behavior does not fit cleanly into its predefined transaction models. This slows down root cause analysis.
Weak Correlation Across Logs, Metrics, and Traces
Many legacy APMs consider metrics, events, logs, and traces (MELT) as separate products. They correlate MELT but late, often in the UI.
The 2024 Grafana Labs Observability Survey says that only 39% of teams report consistent correlation across all three signals during incidents.
When correlation breaks, engineers spend time assembling timelines instead of understanding failures. Because of this, system complexity increases.
Tooling Designed Around Agents, Not Signals
The second major constraint lies in how legacy APM platforms collect data. The architecture centers on agents rather than on telemetry signals.
High Operational Overhead to Maintain Coverage
Agents require installation, configuration, upgrades, and ongoing care. This is manageable in static environments.
But keeping agents correctly installed and configured across dynamic systems becomes difficult and requires ongoing operational work.
Tight Coupling
Legacy APM platforms tightly couple data collection, storage, and analysis. This design limits flexibility.
Adjusting sampling, routing data, or experimenting with new analysis approaches without touching production instrumentation is difficult.
Limited Control Over Telemetry
Modern systems generate an overwhelming amount of telemetry. But teams need to filter, sample, and route data based on context. Without control, teams may drop important observability data due to increasing cost or platform limits. However, that data could aid investigations.
With legacy APM tools, decisions happen late in the pipeline. At this stage, the cost has already increased. Engineers can’t control telemetry where it’s generated to make important decisions and keep costs in check.
Cost Becomes a Structural Problem (And Not a Pricing Issue)
When observability costs become unmanageable, teams start blaming pricing plans or contracts. But the issue started much earlier. Now, the pricing no longer reflects how the system behaves. At that point, no amount of negotiation or tuning fully fixes the issue.
Telemetry Growth
In modern systems, even a small change in architecture or traffic can create large jumps in data volume.
Logs, Metrics, and Traces Scale at Different Rates
Each signal grows for different reasons.
- Logs grow with verbosity, error paths, and debug output
- Metrics grow with cardinality and new dimensions
- Traces grow with service fan-out, retries, and async workflows
For example, a 10% increase in traffic does not produce 10% more telemetry. It often produces far more. Teams that budget based on traffic alone underestimate how quickly observability data expands.
High Cardinality
High cardinality metrics and wide service graphs multiply data quickly. Adding a single label or endpoint can change ingestion patterns overnight.
Organizations running more than 100 microservices see metric cardinality increase as a top cost driver, not raw request volume.
Fan-out makes this worse. One request touches many services and generates traces that grow in depth and width. This causes storage or cost limits to exceed far beyond the limit.
Incident-Driven Spikes Break Predictability
Incidents generate more telemetry by design.
- Error logs increase
- Retries multiply spans
- Engineers widen time ranges and refresh queries aggressively
Reports say that observability data volume can spike by 2x-5x during major incidents, even when traffic remains constant. These spikes happen at the worst possible time and raise costs.
Pricing Models Penalize Normal System Growth
Legacy APM pricing assumes stable growth and predictable usage. Modern systems rarely behave that way.
Per-Host and Per-Agent Pricing Introduce Friction
Pricing tied to hosts or agents made sense when servers were long-lived. In autoscaling environments, this model creates constant accounting work. Short-lived workloads still count. Scale-out events increase cost immediately, often before business value becomes clear.
For many organizations, cost visibility and control are the top cloud challenges, with monitoring and observability among the fastest-growing spend categories.
Costs Spike During Incidents and Scale Events
Legacy pricing models charge more when systems are under stress. More data means higher bills, even though that data is essential for diagnosis. This creates a perverse incentive. Teams feel pressure to reduce visibility precisely when visibility matters most.
Optimization Yields Diminishing Returns
Once pricing diverges from system behavior, optimization stops helping. Teams respond by:
- Sampling More Aggressively
- Dropping Data Earlier
- Reducing Retention
Each step lowers cost but also reduces insight. Eventually, the platform becomes cheaper but explains less. At that point, the issue is no longer pricing but a mismatch between the cost model and the system itself. This is where many teams realize they are paying for an observability platform that is no longer relevant for their modern infrastructure.
The Shift from APM to Observability
Teams moved from legacy APMs because they stopped explaining reality. Request monitoring remained useful, but it no longer answered the questions teams faced during complex production incidents.

From Request Monitoring to System Understanding
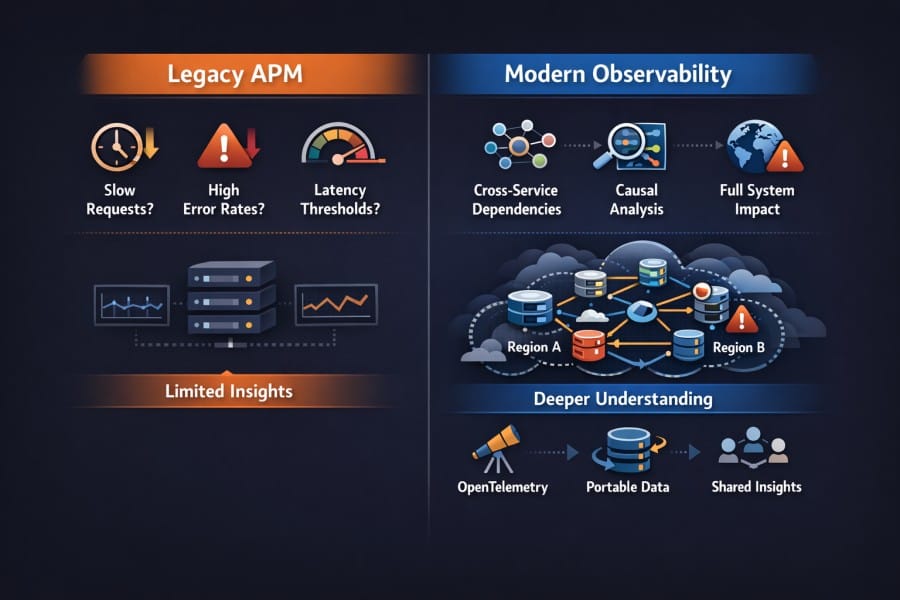
Traditional APM answers known questions.
- Is the request slow?
- Is the error rate increasing?
- Did latency cross a threshold?
These questions reflect localized and repeatable problems. But modern systems behave differently. Failures often emerge from interactions between services. A retry policy in one service combines with a timeout in another. Load shifts across regions. Autoscaling changes the system shape mid-incident.
Understanding these failures requires more than request timing. Teams need to explain causality, dependency behavior, and impact on the system.
Failures Are Emergent and Cross-System
In distributed systems, a partial outage in one dependency can degrade multiple user-facing workflows. Latency in one region can trigger retries and overload another.
The same deployment behaves differently under different load conditions. These failures cannot be understood by looking at a single trace or metric in isolation. They require correlation across signals and services.
Open Standards and Decoupled Telemetry
As teams encountered these limits, expectations around instrumentation changed.
Teams want instrumentation that survives tool changes. They want to instrument once and retain the freedom to change platforms easily. Open standards make this possible by separating how telemetry is generated from how it is stored and analyzed.
According to the CNCF, over 80% of organizations now use or plan to use OpenTelemetry as their primary instrumentation standard.
Vendor-neutral telemetry reduces risks in the long term. It allows teams to scale their observability stack without lock-ins. This is also important for improving operations and compliance. Different teams can share signals and ownership:
- APM teams provide telemetry
- Application teams retain context and control
- Investigation teams use it to fix issues
Operational Ownership Becomes Non-Negotiable
As systems scale, teams want a deeper understanding of how data is collected, stored, and governed. Ownership becomes a requirement due to factors such as risk, scale, and accountability.
Control Over Data Residency and Retention
Smaller teams (not from highly regulated industries) may accept default data locations and retention periods. But this is not ideal for larger organizations or those handling sensitive customer data.
Observability data falls under the same regulatory expectations as application data. Logs and traces have request payloads, headers, internal identifiers, and system topology. So, teams must know where this data lives, how long it is retained, and who can access it.
When observability platforms do not offer clear control over residency and retention, organizations inherit compliance and legal risk they cannot easily mitigate.
Sampling and Ingestion Decisions Move Closer to the System
Telemetry volume grows faster than traffic or revenue. The growth curve is not linear. At this scale, default sampling strategies fail. Blind sampling drops the critical context. Also, filtering data at later stages reduces visibility.
Teams must control the pipeline early and close to where telemetry is generated to:
- Preserve important context during incidents
- Adjust sampling behavior under load
- Focus on errors and high-value transactions
Auditability, Compliance, and Governance Pressure
About 40% of respondents in financial services and insurance indicated an increased focus on security, governance, risk, and compliance as a driver for observability initiatives. Security teams now expect observability platforms to support:
- Clear access controls
- Query audit logs
- Defined retention policies
- Evidence for compliance reviews
Legacy APM platforms often treat these concerns as secondary features. At scale, they become first-order requirements.
Observability Becomes Critical Infrastructure
Apart from debugging slow requests, observability is important for site reliability, incident response, capacity planning, and executive reporting.
Teams with mature observability practices are 3x more likely to meet their SLOs consistently.
When observability fails, teams lose their ability to reason about system behavior. That risk forces a shift in mindset. Here, control outweighs ease of setup. Teams must design, operate, and govern Observability with the same care as production systems.
Common Signs a Team Has Outgrown Legacy APM
Teams rarely wake up one day and decide to replace their APM platform. The signal comes earlier, through friction that shows up during day-to-day operations. These signs tend to appear gradually, then compound as systems and teams grow.
Visibility Gaps During Real Incidents
In distributed systems, incidents rarely follow clean paths. Engineers widen time ranges, jump across services, and correlate multiple signals. This is where gaps appear.
The 2024 Grafana Labs Observability Survey says that over 60% of engineers report missing or incomplete telemetry during high-severity incidents, even though monitoring appeared healthy beforehand.
When teams cannot answer basic questions during an outage, confidence in the platform erodes quickly.
Disproportional Cost
Many teams see that they are ingesting more data, and the cost is rising beyond their understanding. However, the quality of insight has not improved at the same rate, and investigations still need guesswork. This is largely due to poor cost-to-value alignment.
This is one of the clearest signs that they have outgrown the legacy APM.
Ad-Hoc Debugging
When observability tools don’t provide reliable insights, engineers have to adapt. They tail logs directly and run ad-hoc queries in databases. They may add temporary debug logging and redeploy.
A 2024 Stack Overflow Developer Survey states that 50% of developers rely on manual debugging during production incidents, although an observability platform is available.
Maintenance Overhead
If there’s high operational overhead just to keep an APM platform usable, it’s not a good sign.
Engineers have to spend significant time tuning sampling rules and managing agents. They also have to suppress noisy alerts and clean up dashboards. Each change fixes one issue while introducing another.
When tooling cannot adapt automatically, operational overhead increases sharply in high-change environments, as per reports.
Mismatching Engineering Needs and Platform Limitations
As systems mature, engineering needs evolve. Teams want deeper context, longer retention for critical data, and more control over telemetry.
Legacy APM platforms often push back through hard limits. Retention caps. Inflexible pricing. Fixed data models. There’s a clear mismatch between what teams need and what the platform allows. At this point, the conversation shifts from how to tune the tool to whether it still fits the system.
What Modern Engineering Teams Expect Instead
When teams outgrow a legacy APM, they look for platforms that can remain stable under change, stress, and growth.

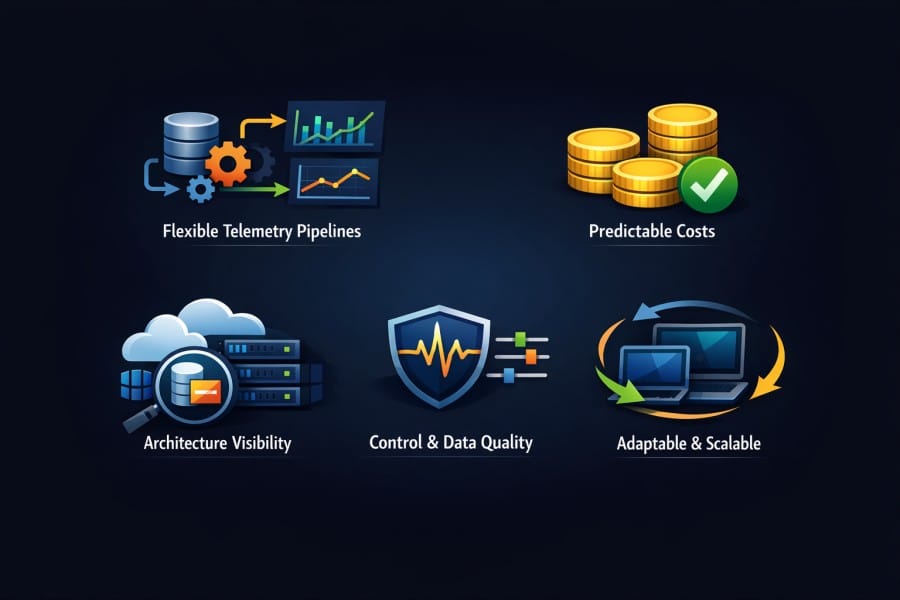
Flexible Telemetry Pipelines
Telemetry must smoothly flow through pipelines that teams can control. They can easily search, filter, sample, and route data based on context.
This matters because no single signal has equal value at all times. Errors and critical paths matter more than background noise.
Instead of relying on filtering at the last stage, over 72% of teams want the ability to control telemetry at ingestion time. This flexibility allows teams to adapt observability to real production behavior.
Predictable Costs
Teams can accept rising costs if it makes sense, but not unpredictability. Observability Cost should scale with system behavior in understandable ways. It should not surprise them at the end of a month.
Architecture-Dependent Visibility
Teams run microservices, legacy services, managed cloud offerings, and third-party dependencies side by side. Choose an observability platform that works across architectures.
Teams expect visibility that spans runtimes, protocols, and deployment models without losing context.
Control Over Data and Signal Quality
Dashboards are outputs. Teams care more about inputs. Modern engineering teams want control over what data is collected, how it is sampled, and how it is enriched. They want to preserve high-quality signals and drop noise early.
During incident response, over 65% of teams prioritize signal quality over raw data volume. This helps you diagnose issues faster and reduce operational overhead.
Platforms That Adapt to Change
Deployments happen daily. Infrastructure scales automatically. Traffic patterns shift without warning.
Platforms must adapt to this reality rather than resist it. Static assumptions about hosts, services, or workloads create friction over time.
High-performing teams are more likely to use observability platforms that support rapid change without manual reconfiguration.
Conclusion
Legacy APM platforms tend to work well early in a system’s life. As systems grow, their behavior changes. Architectures fan out, deployments accelerate, and telemetry volume increases in ways that are hard to predict.
At that point, the limits of earlier observability approaches become visible. Costs are harder to control. Investigations take longer. Engineers spend more time working around the tool than learning from it.
This is a normal stage of software maturity. As systems evolve, observability practices must evolve with them. Teams that recognize this shift early reduce long-term cost, operational risk, and friction during real incidents.
Disclaimer: The information in this article reflects the latest details available at the time of publication and may change as technologies and products evolve.
FAQs
1. What is considered a legacy APM platform today?
Legacy APM platforms are tools designed around monolithic or early distributed architectures, with rigid data models, tightly coupled agents, and pricing assumptions that struggle to adapt to modern cloud-native systems.
2. At what stage do teams usually outgrow legacy APM tools?
Teams typically outgrow legacy APM during cloud migration, microservices adoption, or when telemetry volume and operational complexity exceed early assumptions.
3. Why do legacy APM costs increase so quickly at scale?
It’s because pricing is often tied to hosts, agents, or bundled limits, while telemetry volume and system complexity grow non-linearly.
4. Is observability the same as APM?
No. APM focuses on monitoring known request paths, while observability helps teams understand overall system behavior, including unknown or emergent failures.
5. Can legacy APM tools work in Kubernetes and cloud-native environments?
They can be adapted, but often with significant operational overhead and reduced visibility due to assumptions around static infrastructure.


