Snowflake powers modern analytics at scale, with the cloud data warehouse market projected to grow to $155B by 2034. Misconfigured warehouses or runaway queries can quickly inflate bills. Since Snowflake sits at the core of microservice pipelines, even small errors ripple downstream, yet native tools lack real-time anomaly detection and cross-service correlation.
CubeAPM fills this gap with Snowflake-specific observability—offering query-level performance tracing, credit usage attribution by warehouse or role, and real-time alerts on anomalies or cost spikes.
In this guide, we’ll break down what Snowflake monitoring really means, why organizations turn to specialized tools, and evaluate the top Snowflake monitoring platforms.
Top 9 Snowflake Monitoring Tools
- CubeAPM
- Monte Carlo Data
- SELECT.dev
- Datadog
- Observe
- eG Enterprises
- New Relic
- Chaos Genius
- Dynatrace
What Is Snowflake Monitoring?
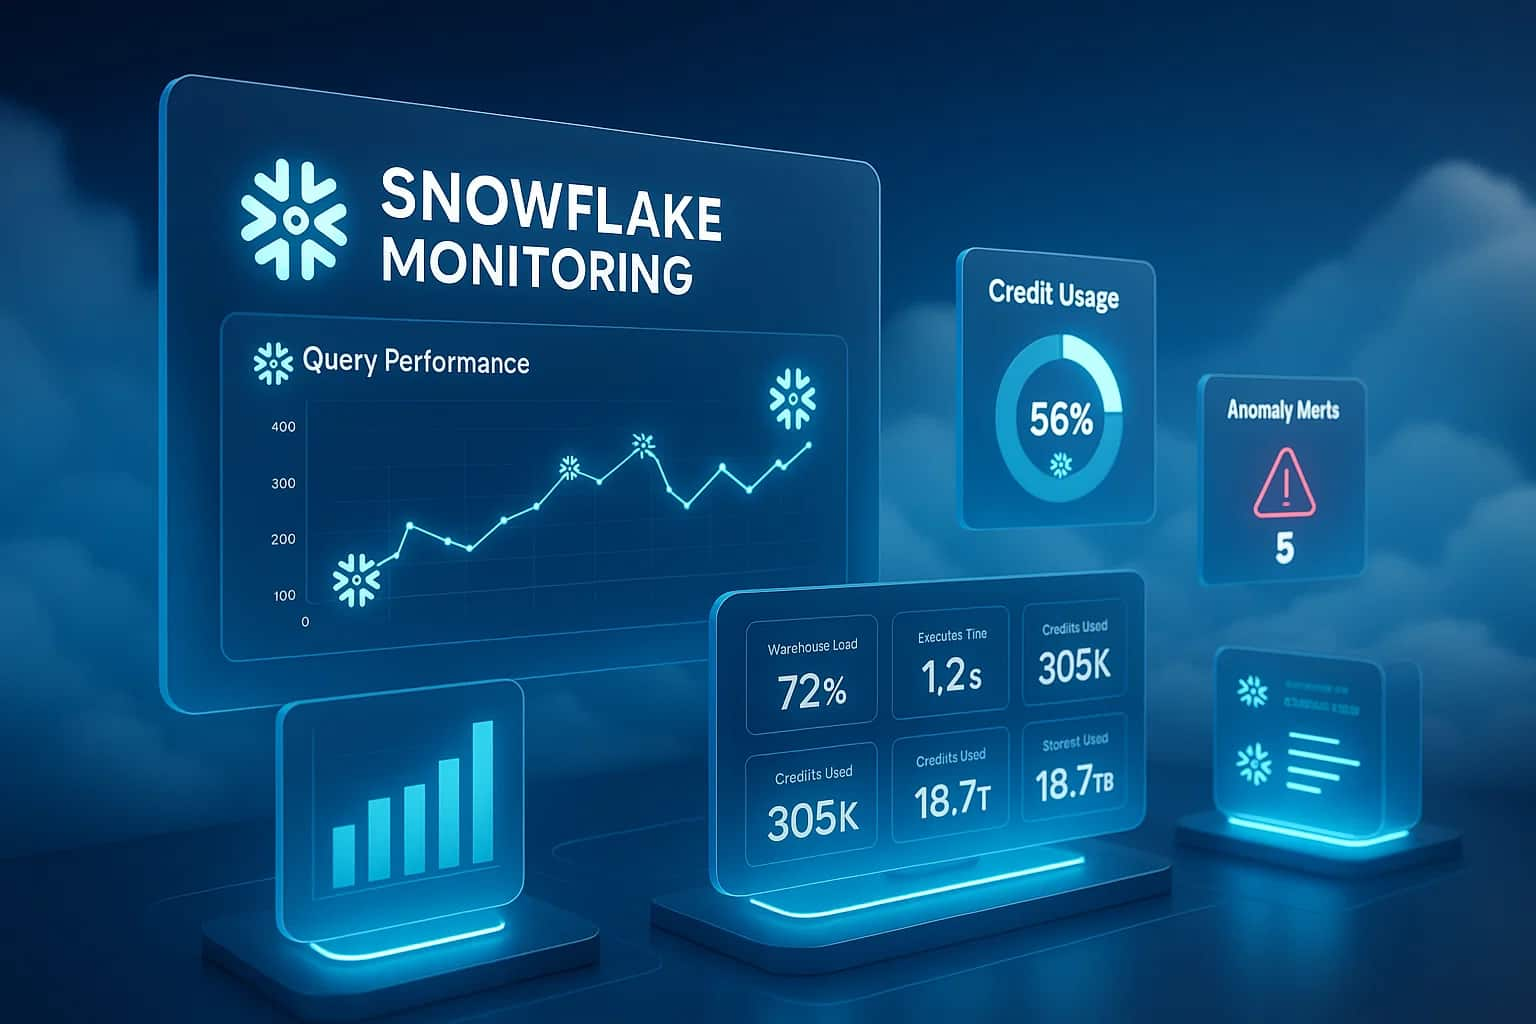
Snowflake monitoring is the practice of tracking and analyzing the performance, cost, and health of workloads running inside Snowflake. Since Snowflake uses a consumption-based pricing model, every query, warehouse, and pipeline action directly impacts costs. Monitoring ensures teams can optimize performance while keeping credit usage under control.
At its core, Snowflake monitoring covers:
- Query performance: Tracking execution times, failed queries, and regressions.
- Warehouse efficiency: Monitoring sizing, auto-suspend/resume, and concurrency handling.
- Credit and cost usage: Attributing spend by warehouse, user, or role to prevent overruns.
- System events and logs: Leveraging ACCOUNT_USAGE views, event tables, and query history for troubleshooting.
- End-to-end observability: Correlating Snowflake data with pipelines, BI dashboards, and downstream applications.
While Snowflake provides built-in tools like Snowsight dashboards, Resource Monitors, and usage views, these are limited to historical reporting. True monitoring goes further—real-time alerts, anomaly detection, and long-term trend analysis—so teams can act before performance or cost issues affect the business.
Example: How CubeAPM Handles Snowflake Monitoring
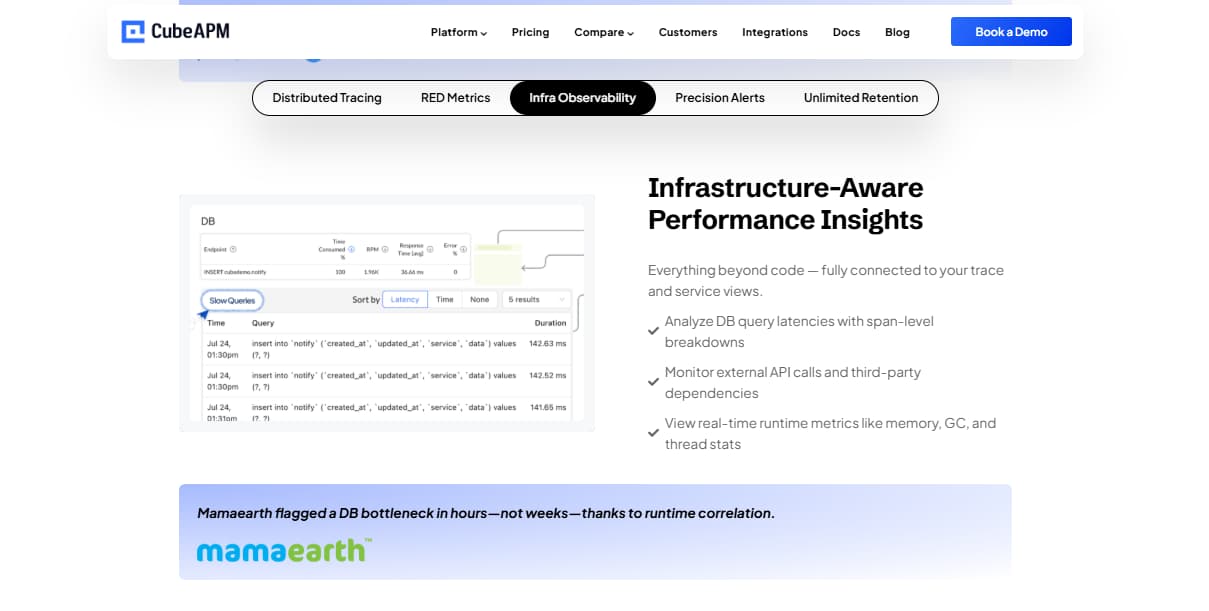
CubeAPM is designed to capture the nuances of Snowflake workloads. Snowflake monitoring isn’t just about checking whether queries run—it’s about understanding which warehouses drive credit burn, how queries regress over time, and how data delays ripple into downstream dashboards and pipelines.
With CubeAPM, teams can move beyond static ACCOUNT_USAGE views or Snowsight dashboards. Instead, they gain real-time insight into performance and cost, proactive alerts when usage deviates from baselines, and long-term trend analysis to support governance and budgeting.
CubeAPM achieves this in multiple ways, including:
- Instrumentation & Telemetry Ingestion: CubeAPM supports OpenTelemetry-based instrumentation, so services and connectors interacting with Snowflake can emit spans, metrics, and traces with minimal setup. By tagging operations with metadata such as warehouse, role, or query hash, CubeAPM builds full context around performance and cost.
- Query-Level Tracing & Attribution: Each query is traced for execution time, queuing, and data scan bottlenecks. CubeAPM attributes these queries to specific warehouses, roles, or pipelines, allowing precise visibility into which workloads are driving cost or performance issues.
- Distributed tracing to connect Snowflake queries with upstream pipelines and downstream BI dashboards
- Credit & Cost Monitoring: CubeAPM continuously tracks credit consumption at the warehouse, role, or user level. Spikes in usage trigger alerts, so teams can immediately spot runaway jobs or inefficient queries before costs spiral out of control.
- Anomaly Detection & Alerts: Historical performance and cost trends let CubeAPM detect anomalies—such as latency increases, higher credit burn, or unusual warehouse activity—and automatically alert the right team.
- Correlation Across Systems: Because CubeAPM ingests telemetry from pipelines, applications, and infrastructure, it connects Snowflake issues to their broader business impact. A slow dashboard, for example, can be traced back to a specific query or warehouse bottleneck in Snowflake.
- Long-Term Trend Analysis: With retained metrics and traces, CubeAPM surfaces cost and performance trends over time, helping teams right-size warehouses, forecast budget needs, and enforce data platform governance.
Why Teams Choose Different Snowflake Monitoring Tools
Not every Snowflake deployment looks the same. Some teams run small, predictable nightly jobs, while others manage thousands of concurrent dashboards and streaming pipelines. Because of this variation, organizations adopt different monitoring tools depending on their priorities. Some of the reasons include:
1. Concurrency & Queuing Under Load
When warehouses hit concurrency limits, queries begin to queue and SLAs slip. Teams need visibility into queue times versus execution times and alerts when bursts exceed baselines, so they can right-size or autoscale warehouses effectively.
2. Warehouse Right-Sizing & Auto-Suspend/Resume Tuning
Over-provisioning wastes credits, while aggressive suspend/resume settings can disrupt workloads. Monitoring tools surface utilization, idle time, and suspend behavior trends, helping teams tune warehouse policies with confidence.
3. Query-Level Regression Detection
As data grows or clustering drifts, the same SQL may run slower and consume more resources. Advanced monitoring highlights stage-level timings, bytes scanned, and spill events, while also alerting on regressions against historical baselines.
4. Credit Attribution Across Services
Snowflake credits aren’t only tied to warehouse compute—cloud services like compilation and metadata operations also consume credits. Effective monitoring breaks down these categories and alerts on unusual patterns before they trigger unexpected costs.
5. Query Acceleration Service (QAS) Impact
QAS can improve performance for large scans but changes cost dynamics. Teams need visibility into when QAS improves efficiency, where it adds overhead, and how it influences spill rates and overall credit burn.
6. Pipeline & Task Reliability
Delays often stem from Snowpipe, Tasks, or Dynamic Tables rather than queries. Monitoring tools track these schedules, dependencies, and lag times to quickly identify broken pipelines or backfills.
7. Real-Time Alerts vs. Historical Reports
Native Snowflake views are mostly historical. Third-party tools transform telemetry into proactive alerts—catching spikes in failure rates, latency jumps, or warehouse churn as they happen.
8. Cross-System Correlation
Data teams want to tie Snowflake health to upstream ETL jobs and downstream BI dashboards. Unified observability connects query latency or credit spikes to the actual business impact, reducing finger-pointing between teams.
Top 9 Snowflake Monitoring Tools
1. CubeAPM

Known for
CubeAPM is an OpenTelemetry-native observability platform built with data-first workloads in mind. While many monitoring vendors treat databases as an add-on, CubeAPM makes Snowflake a first-class citizen by combining query tracing, cost attribution, and anomaly detection with logs, metrics, and traces. It’s especially recognized for simplifying credit monitoring while correlating Snowflake queries with microservices, pipelines, and Kubernetes infrastructure for full-stack visibility.
Snowflake Monitoring Features
- Query-level performance tracing with execution time, stages, and queuing insights
- Credit usage attribution by warehouse, user, or role
- Alerts for query regressions and cost anomalies
- Baseline comparison to detect performance drift as datasets grow
- Correlation of Snowflake query delays with pipeline jobs and downstream BI dashboards
Key Features
- Unified monitoring for logs, metrics, traces, and Snowflake queries
- Smart sampling to cut telemetry costs without losing critical signals
- SLO tracking and multi-window alerting for data workloads
- Long-term retention for cost and performance trend analysis
Pros
- Snowflake-aware features like credit attribution and query tracing
- OpenTelemetry-native setup with flexible deployment options
- Cost-efficient ingestion with flat pricing
- Correlation between Snowflake workloads and surrounding systems
Cons
- Not suited for teams looking for off-prem solutions
- Strictly an observability platform and does not support cloud security management
Pricing
Flat pricing of $0.15/GB for logs, traces, and metrics.
CubeAPM Snowflake Monitoring Pricing at Scale
*All pricing comparisons are calculated using standardized Small/Medium/Large team profiles defined in our internal benchmarking sheet, based on fixed log, metrics, trace, and retention assumptions. Actual pricing may vary by usage, region, and plan structure. Please confirm current pricing with each vendor.
For a mid-sized SaaS company ingesting 45TB(~45,000) total monthly data ingestion and 45,000TB of observability data outcharged by the cloud provider, the total cost will be about ~$7200/month.
Tech Fit
CubeAPM is ideal for teams where Snowflake drives core analytics and business reporting. It’s a strong fit for organizations that want predictable costs, fine-grained visibility, and long-term trends without paying for bloated enterprise bundles. For companies scaling Snowflake workloads quickly, CubeAPM ensures both engineers and business stakeholders stay on top of performance and credit usage.
2. Monte Carlo Data

Known for
Monte Carlo Data is widely recognized as a data observability platform that focuses on data reliability, lineage, and trust rather than traditional infrastructure monitoring. In the Snowflake context, it helps teams detect data quality issues, schema changes, and pipeline failures that impact dashboards and analytics workloads. While it’s not a full observability platform like Datadog or CubeAPM, it plays a critical role in ensuring data inside Snowflake is accurate and reliable.
Snowflake Monitoring Features
- Continuous monitoring of data freshness, volume, and schema changes in Snowflake tables
- Alerts on anomalies in row counts, null values, or unexpected spikes in data
- Integration with Snowflake metadata to trace lineage and detect downstream impact
- Automated incident detection when pipelines fail or data drifts
- Dashboards to track reliability metrics for key Snowflake datasets
Key Features
- End-to-end data lineage mapping
- Machine learning–based anomaly detection for data quality
- Incident management workflows with Slack, Jira, and PagerDuty integration
- APIs for custom monitoring and governance automation
Pros
- Purpose-built for data quality and trust in Snowflake
- Strong lineage and impact analysis capabilities
- Reduces downtime from bad data in dashboards and reports
- Widely used in modern data engineering teams
Cons
- Pricing can be expensive for large-scale deployments
- Overwhelming UI for new users
Pricing
Quote-based: Monte Carlo does not publish public pricing.
Monte Carlo Data Snowflake Monitoring Pricing at Scale
For a mid-sized company ingesting 10 TB of Snowflake data per month, pricing depends heavily on enterprise negotiation. While exact costs aren’t public, contracts can get expensive especially when scaling, which is more expensive than most enterprise observability suites.
Tech Fit
Monte Carlo is best for organizations where Snowflake data quality and trust are as important as performance and cost. It fits data engineering and analytics teams who need to ensure dashboards, and models.
3. SELECT.dev
Known for
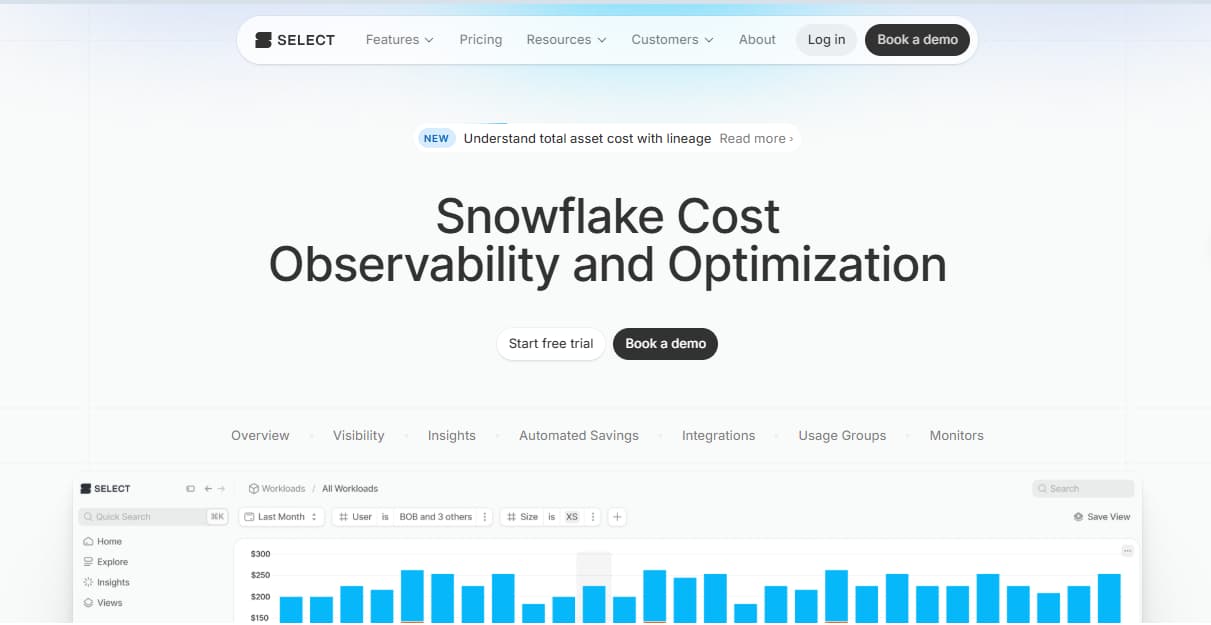
SELECT.dev is a monitoring and optimization platform built specifically for Snowflake. Unlike general-purpose observability tools, SELECT is designed to track query performance, credit usage, and warehouse efficiency inside Snowflake itself. It’s positioned as a lightweight alternative for teams that want deep cost and performance visibility without deploying a full observability stack.
Snowflake Monitoring Features
- Detailed credit consumption tracking across warehouses, roles, and queries
- Query performance dashboards with latency and concurrency insights
- Alerts on inefficient queries, runaway workloads, or unusual credit burn
- Recommendations for warehouse right-sizing and cost optimization
- Historical trend analysis for long-term Snowflake usage patterns
Key Features
- Purpose-built for Snowflake monitoring and cost management
- Lightweight setup with minimal configuration
- Real-time dashboards and alerts
- Focused on warehouse optimization and spend reduction
Pros
- Highly specialized for Snowflake workloads
- Clear visibility into query-level performance and cost attribution
- Easy to adopt compared to heavy enterprise observability tools
- Helps reduce spend through actionable warehouse recommendations
Cons
- Steep learning curve for new users
- Overwhelming UI that can hinder usability
Pricing
SELECT.dev does not publish detailed pricing publicly.
SELECT.dev Snowflake Monitoring Pricing at Scale
For a company ingesting 10 TB of Snowflake telemetry per month, SELECT.dev’s pricing will vary depending on negotiated tiers. While not fully transparent, reports suggest it is generally cheaper than large enterprise observability vendors.
Tech Fit
SELECT.dev is best for teams focused almost exclusively on Snowflake optimization. It fits companies where Snowflake is the core data warehouse and cost control is the top priority.
4. Datadog
Known for
Datadog is one of the most established observability platforms, widely adopted for its breadth across infrastructure, applications, logs, and security. It’s known for strong dashboards, anomaly detection, and integrations with virtually every technology stack. In the Snowflake context, Datadog extends its database monitoring capabilities to track query performance and costs, but its modular pricing model often makes it expensive at scale.
Snowflake Monitoring Features
- Query performance insights, including execution time and slow queries
- Integration with Snowflake ACCOUNT_USAGE to track warehouse consumption
- Alerts on query latency, failures, or unusual patterns
- Dashboards to correlate Snowflake workloads with applications and pipelines
- Cost monitoring through warehouse-level metrics
Key Features
- Full-stack observability: logs, metrics, traces, and infrastructure monitoring
- 900+ prebuilt integrations
- Advanced anomaly detection and forecasting
- Centralized dashboards with flexible visualization
- Security and compliance monitoring options
Pros
- Extremely mature platform with global adoption
- Rich ecosystem of integrations
- Powerful alerting and anomaly detection
- Strong visualization and reporting capabilities
Cons
- Pricing complexity across modules (logs, infra, APM, etc.)
- Costs grow rapidly with large telemetry volumes
- Steeper learning curve for configuring advanced monitoring
Pricing
- APM (Pro Plan): $35/host/month
- Infra (Pro Plan): $15/host/month
- Ingested Logs: $0.10 per ingested or scanned GB per month
Datadog Snowflake Monitoring Pricing at Scale
For a mid-sized SaaS company operating 125 APM hosts, 40 profiled hosts, 100 profiled container hosts, 500,000,000 indexed spans, 200 infra hosts, 1,500,000 container hours, 300,000 custom metrics, and ingesting around 10TB(~10,000 GB) of logs per month with 3500 indexed logs, the monthly cost would be around ~$27,475/month.
Tech Fit
Datadog is best suited for large enterprises already using it for infrastructure and application observability, who want to fold Snowflake into their existing dashboards. It’s a good fit for organizations that value ecosystem depth and advanced anomaly detection.
5. Observe
Known for
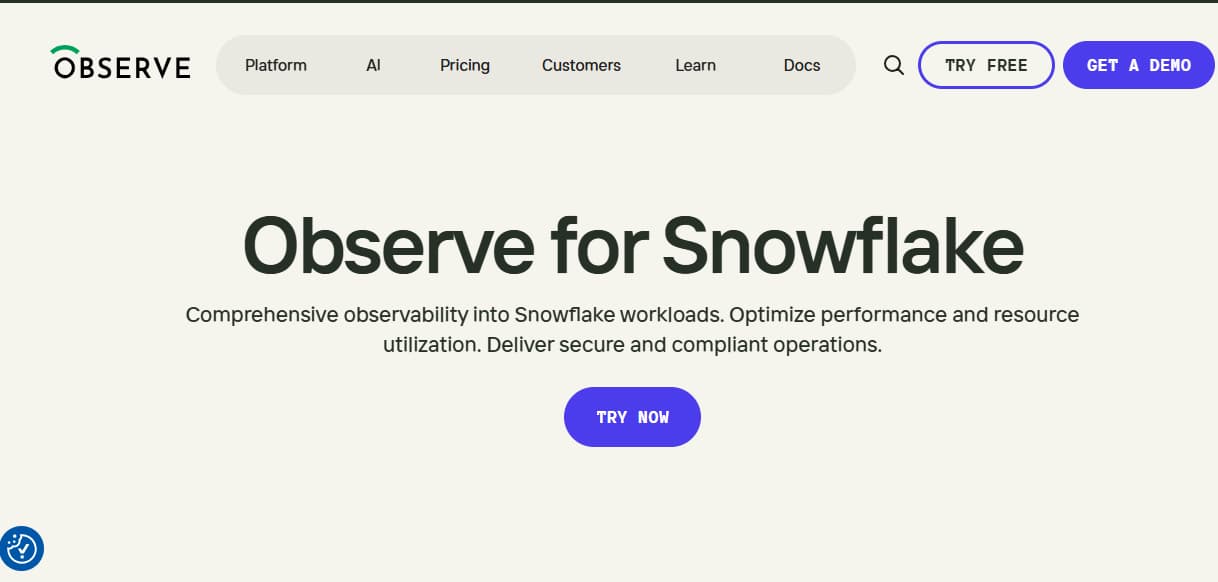
Observe is built on Snowflake, offering a native observability experience. It natively integrates with Snowflake event tables and management views, allowing teams to monitor query execution, warehouse usage, and pipeline behavior from within a unified view. It’s especially known for blending observability signals (logs, metrics, spans) with Snowflake’s own telemetry in one architecture.
Snowflake Monitoring Features
- Native integration with Snowflake event tables and management views
- Unified visibility across multiple Snowflake accounts
- Monitoring of query executions, Snowpark UDFs, container services, and pipelines
- Correlation of telemetry signals (logs, metrics, spans) with Snowflake usage
- Warehouse consumption and usage benchmarking to surface inefficiencies
Key Features
- Fully native architecture (observability solution built for Snowflake)
- Scalable ingestion of petabyte-scale observability data
- Multi-account aggregation and unified observability
- Support for OpenTelemetry standards for logs, metrics, and spans
Pros
- Deep integration with Snowflake internals and metadata
- Unified observability without needing a separate data pipeline
- Strong scalability for large Snowflake footprints
- Good for teams running many Snowflake accounts or regions
Cons
- Cost scale quickly as usage grows
- Complex initial setup
Pricing
- Logs: $0.49 per GiB (30-day retention)
- Traces: $0.59 per GiB (30-day retention)
- Metrics: $0.008 per DPM (13-month retention)
Observe Snowflake Monitoring Pricing at Scale
For a company ingesting 10 TB of Snowflake telemetry per month, splitting evenly between logs and traces, costs add up quickly. Logs at 5 TB would cost about $2,450/month (5,000 × $0.49), while traces at 5 TB would be around $2,950/month (5,000 × $0.59). Together, that’s roughly $5,400/month, not including metrics. This makes Observe significantly more expensive than flat-rate models at higher data volumes.
Tech Fit
Observe is ideal for organizations with heavy Snowflake usage across accounts and regions, where keeping everything inside the Snowflake ecosystem simplifies operations. It’s great for teams that want observability without managing a separate logging or telemetry infrastructure.
6. eG Enterprise
Known for
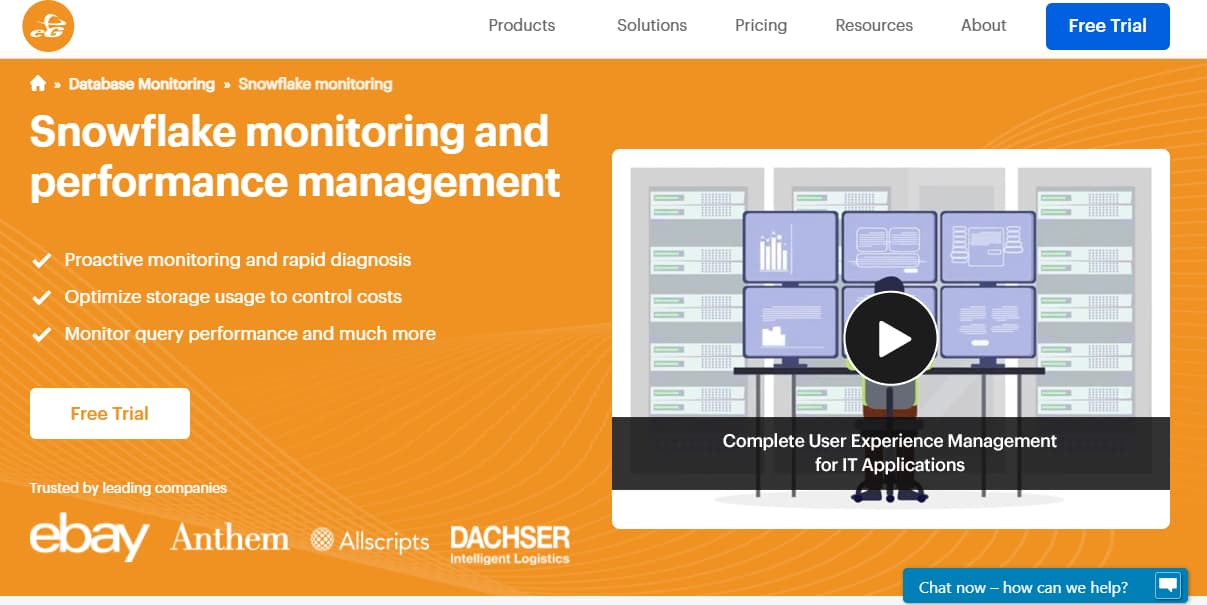
eG Enterprise is a mature observability and performance monitoring platform that has extended support to include Snowflake. It’s known for applying AIOps, topology maps, and correlation across infrastructure and applications. Its Snowflake module provides visibility into query performance, credit usage, and availability in the context of broader system dependencies.
Snowflake Monitoring Features
- Pinpoint slow or expensive queries and drill into execution details
- Credit usage monitoring across warehouses, cloud services, and sessions
- Anomaly detection on storage spikes, query latency, and usage deviations
- Predictive warehouse sizing and utilization analysis
- Monitoring replication lag, storage usage trends, and configuration drift
Key Features
- Full-stack observability across databases, infrastructure, cloud, and applications
- AIOps-powered anomaly detection and root-cause analysis
- Dashboards, topology maps, and rich visual reports
- Ability to monitor cloud platform costs alongside Snowflake usage
Pros
- Strong infrastructure and app monitoring combined with Snowflake support
- Cross-layer correlation for complex environments
- Predictive analytics for warehouse and workload optimization
- Prebuilt dashboards and out-of-box alerts
Cons
- Pricing can be expensive for small teams
- Overwhelming UI for new users
Pricing
- SaaS/Cloud: starts at $125/month
- Subscription: starts at $100/month
- Perpetual License: minimum configuration starts at $10,000
eG Enterprise Snowflake Monitoring Pricing at Scale
For a mid-sized company ingesting 10 TB of Snowflake telemetry per month, eG Enterprise would not charge per GB but instead require a perpetual license starting at $10,000 for the minimum configuration. This upfront investment covers Snowflake monitoring along with broader infrastructure and application modules. While it avoids usage-based surprises, the high entry point makes it more suitable for enterprises monitoring large, multi-system environments rather than teams focused purely on Snowflake workloads.
Tech Fit
eG Enterprise fits organizations with complex hybrid stacks where Snowflake is one of many critical systems. It’s best for enterprises that already rely on eG for infrastructure and app monitoring and want to extend the same visibility into Snowflake.
7. New Relic
Known for
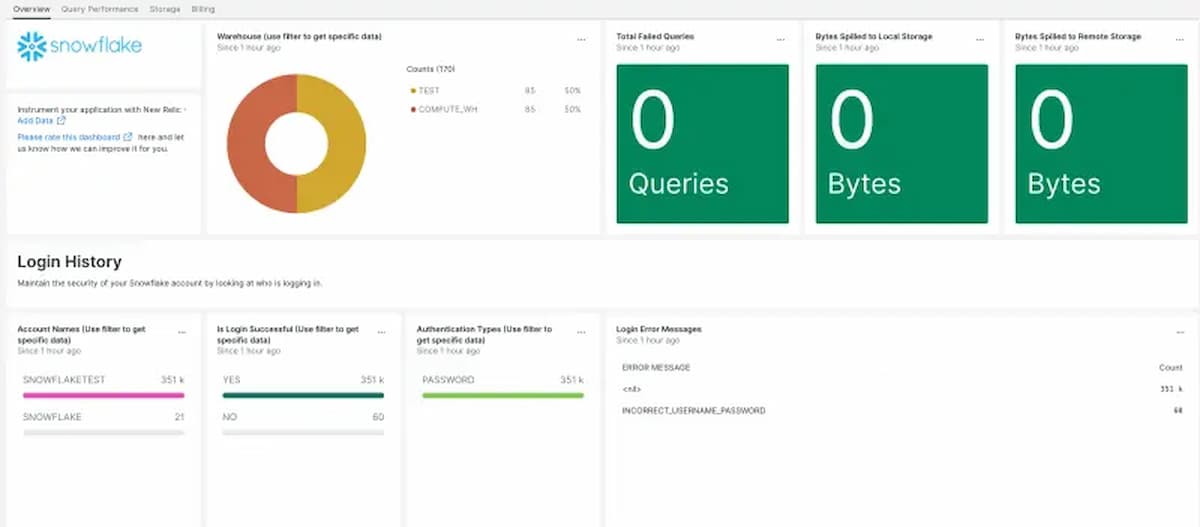
New Relic is a consumption-based observability platform that emphasizes simplicity in billing and a unified approach to monitoring. Instead of modular licenses, it charges based on the volume of telemetry ingested and the number of users. This makes it attractive for teams who want predictable tracking across applications, infrastructure, and databases like Snowflake without managing dozens of SKUs.
Snowflake Monitoring Features
- Database monitoring integration to surface query performance and error rates
- Cost visibility via warehouse credit usage tracking
- Custom dashboards to trend query latency and pipeline delays
- Alerts for failed queries, regressions, or excessive credit burn
- Unified telemetry model to correlate Snowflake events with apps, services, and infra
Key Features
- Unified pricing and telemetry ingestion across logs, traces, and metrics
- Dashboards, alerts, anomaly detection, and SLO tracking
- Strong developer tooling and API access
- Long-term retention in higher plans
Pros
- Transparent pricing model compared to modular vendors
- Easy to extend across multiple teams and workloads
- Good at correlating database metrics with app performance
- Mature dashboards and visualization
Cons
- Telemetry-heavy use cases can still become expensive at scale
- Overwhelming UI for new users
Pricing
- Free tier: 100GB/month of data ingested
- Data Ingest: $0.40 per GB ingested beyond free 100GB
- Full Platform Users: $418.80 per user/month
New Relic Snowflake Monitoring Pricing at Scale
A mid-sized SaaS company ingesting 45TB (~45,000 GB) of telemetry data per month and with 10 full users, the cost would come around ~$25,990/month.
Tech Fit
New Relic is a good fit for mid-sized teams that value pricing transparency and unified observability. It’s particularly well-suited to organizations already ingesting diverse telemetry types (logs, metrics, traces) and wanting them under a single billing model. .
8. Chaos Genius
Known for
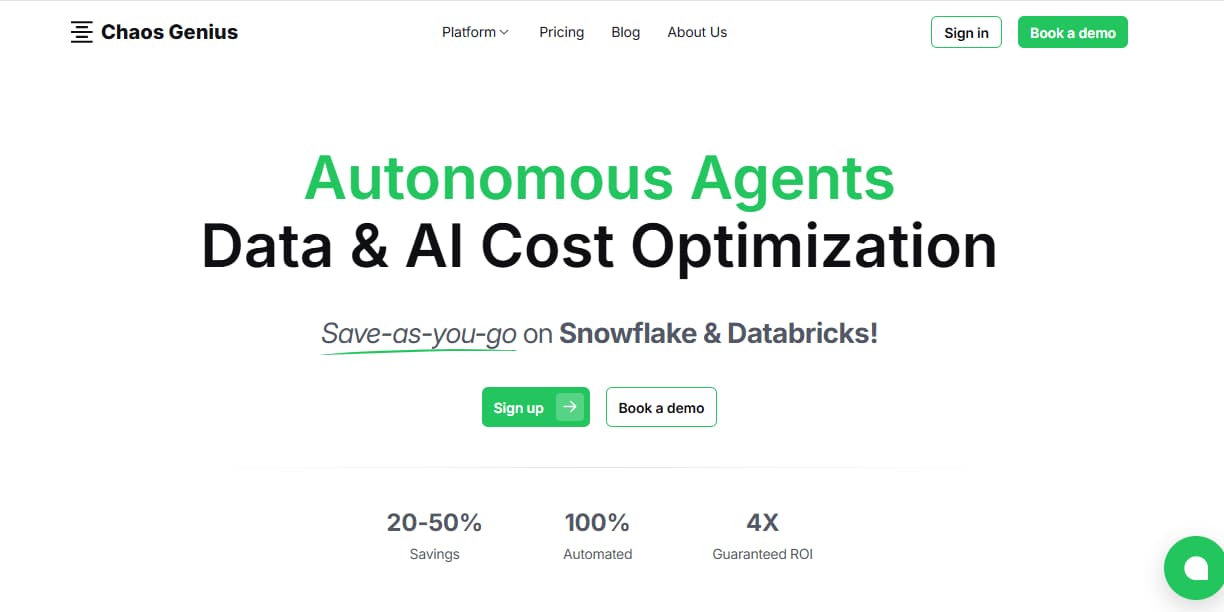
Chaos Genius is an open-source data observability platform built specifically for analytics workloads like Snowflake. Rather than trying to cover every application and host metric, it zeroes in on query costs, anomalies, and data performance. Its niche focus makes it a good option for teams who want visibility into Snowflake credit usage without investing in a full enterprise observability suite.
Snowflake Monitoring Features
- Query cost breakdown by warehouse, role, and user
- Anomaly detection on credit consumption and query performance
- Prebuilt dashboards for Snowflake workload optimization
- Alerts when workloads deviate from historical patterns
- Lightweight deployment for quick monitoring setup
Key Features
- Open-source core, free to adopt and customize
- Machine learning–driven anomaly detection
- Dashboards for data warehouse and BI performance
- API integrations for alert routing (Slack, email, etc.)
Pros
- Purpose-built for Snowflake and analytics workloads
- Cost-effective thanks to open-source availability
- Strong anomaly detection for credit spikes and query slowdowns
- Easy to set up for focused monitoring needs
Cons
- Cost can scale quickly as usage grows
- Overwhelming UI for new users
Pricing
Quote-based pricing.
Chaos Genius Snowflake Monitoring Pricing at Scale
For a team ingesting 10 TB of Snowflake query telemetry per month, with enterprise support, costs would depend on negotiated contracts. Even with hosting overhead, Chaos Genius is usually cheaper than commercial observability platforms at similar scale.
Tech Fit
Chaos Genius is best for teams that care primarily about Snowflake cost control and performance optimization without the need for full-stack monitoring. It fits well in data engineering teams or startups that want anomaly detection and spend attribution but can manage infra themselves or are comfortable with open-source tooling.
9. Dynatrace
Known for
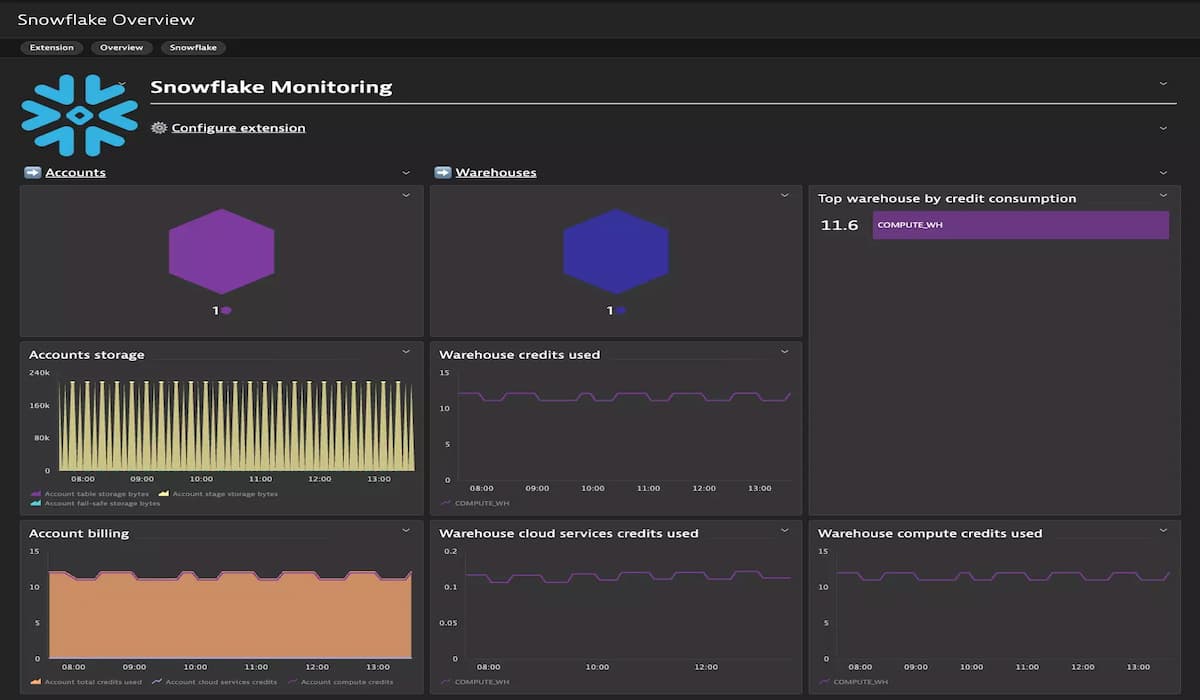
Dynatrace is best known for its AI-powered monitoring and automated instrumentation. It automatically discovers services, databases, and dependencies across complex environments, making it a strong choice for enterprises with large, distributed architectures. In the Snowflake context, Dynatrace extends its database monitoring to include query metrics, performance bottlenecks, and anomalies, but its enterprise-focused licensing often makes it one of the more expensive options.
Snowflake Monitoring Features
- Database monitoring integration that surfaces query latency, failures, and slowdowns
- Credit and warehouse consumption tracking with anomaly alerts
- AI-driven root cause analysis to identify bottlenecks across pipelines and services
- Automatic detection of unusual query or workload patterns
- Unified dashboards to connect Snowflake metrics with upstream and downstream systems
Key Features
- OneAgent auto-instrumentation across infra, apps, and databases
- Davis AI engine for anomaly detection and causation
- Unified logs, metrics, traces, and real-user monitoring
- Strong support for hybrid and multi-cloud deployments
Pros
- Highly automated setup with minimal manual configuration
- Strong AI capabilities for finding root causes
- Scales well in very large, complex environments
- Rich feature set beyond monitoring (security, business analytics)
Cons
- Licensing is complex and heavily enterprise-oriented
- Pricing grows quickly as more features and telemetry are added
Pricing
- Full-Stack Monitoring: $0.08 per hour for an 8 GiB host
- Log Ingest & Processing: $0.20 per GB
- Log Retention/Query: $0.02 per GiB-day (for 10 to 35 days retention)
Dynatrace Snowflake Monitoring Pricing at Scale
A midsized SaaS company operating 125 APM hosts, 200 infra hosts, 10TB(~10,000 GB) of ingested logs, 300,000 custom metrics, 1,500,000 container hours, and 45,000GB of observability data out(charged by cloud provider), the cost would come around ~$21,850/month.
Tech Fit
Dynatrace is best suited for large enterprises with complex hybrid or multi-cloud ecosystems, where Snowflake is one of many critical services. Its automation and AI-driven root cause analysis are valuable in high-scale environments where manual tuning isn’t feasible. For smaller teams focused mainly on Snowflake performance and cost, Dynatrace may feel overly complex and costly.
Conclusion
Snowflake’s flexibility and scale make it the backbone of modern analytics, but its consumption-based model also makes it easy for costs to spiral and performance bottlenecks to go unnoticed. Native features like Resource Monitors provide a starting point, but they lack real-time alerts, long-term trend visibility, and deep correlation with upstream pipelines or downstream dashboards.
For teams that want predictable costs, query-level insights, and full-stack observability, CubeAPM stands out as the most balanced choice. It delivers Snowflake-specific monitoring with transparent flat-rate pricing, making it easier to keep credit usage in check while ensuring dashboards, pipelines, and queries perform at their best.
Disclaimer: The information in this article reflects the latest details available at the time of publication and may change as technologies and products evolve.
FAQs
1. What is Snowflake monitoring?
Snowflake monitoring is the process of tracking query performance, warehouse efficiency, and credit consumption. It helps teams optimize workloads, detect anomalies, and control costs by analyzing usage trends and system telemetry. Platforms like CubeAPM make this easier by adding query-level visibility and automated alerts.
2. Why isn’t the native Snowflake monitoring enough?
Snowflake’s built-in tools are useful for setting credit limits and viewing usage history, but they don’t offer real-time anomaly detection or correlation with pipelines and dashboards. Many teams adopt third-party solutions such as CubeAPM to get proactive alerts and long-term insights.
3. How do monitoring tools help with cost control?
They break down credit usage by warehouse, user, or role and highlight inefficiencies. CubeAPM, for example, provides anomaly detection and baselines that notify teams immediately when spend drifts away from expectations, helping avoid surprise bills.
4. Can Snowflake monitoring integrate with existing systems?
Yes. Most modern tools support open standards like OpenTelemetry, making it easy to integrate Snowflake metrics with dashboards and alerting systems. CubeAPM natively supports this, so Snowflake performance data flows seamlessly into the rest of your observability stack.
5. How much does it cost to monitor Snowflake?
Costs depend on the size of your workloads and the pricing model of the tool. Some vendors use complex modular billing, while CubeAPM keeps it simple with flat $0.15/GB pricing. That makes budgeting predictable, even at scale.


