Session replay monitoring lets teams go beyond crash reports and logs by reconstructing a user’s journey — clicks, scrolls, network calls, UI changes — to uncover why something broke or a user dropped off. It’s increasingly essential: approximately 72% of enterprises are now using session replay tools to enhance digital experience and user behavior insights.
CubeAPM delivers session replay as part of its all-in-one observability platform, combining high-fidelity replays with backend traces, logs, and metrics in a single timeline. Teams can watch every click, scroll, or rage-click alongside network waterfalls and console errors, then pivot directly into the correlated trace or log.
In this guide, we’ll break down the top session replay monitoring tools, compare their features, highlight pros and cons, and show how pricing scales at real-world volumes.
Top 8 Session Replay Monitoring Tools
- CubeAPM
- Datadog
- PostHog
- LogRocket
- New Relic
- Dynatrace
- Sentry
- Microsoft Clarity
What is Session Replay Monitoring?
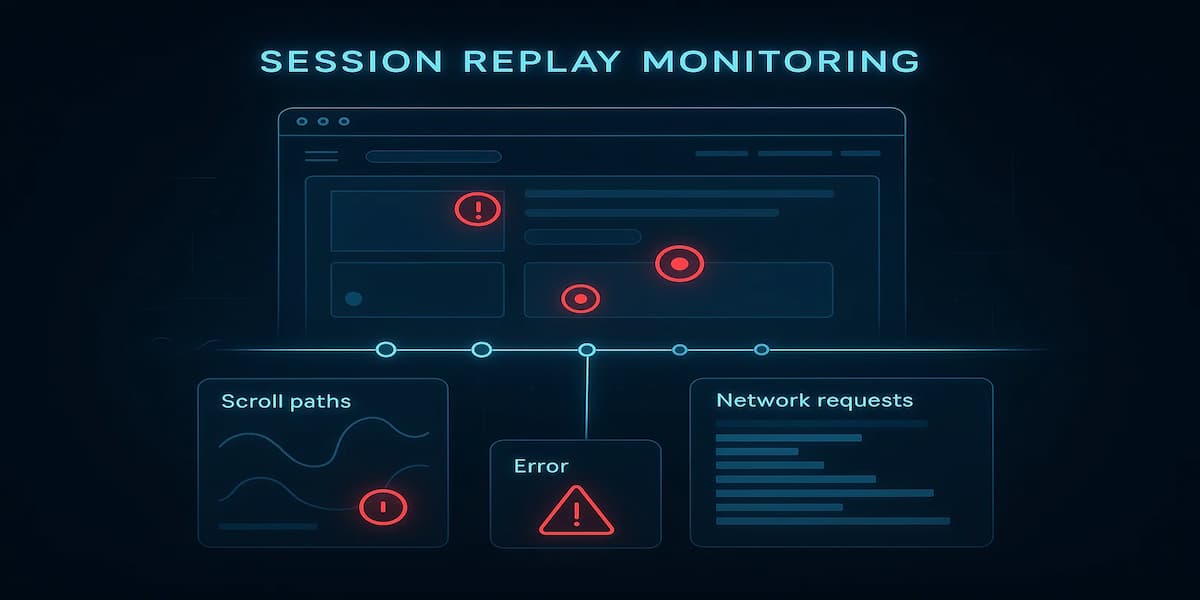
Session Replay Monitoring is a technique that captures user interactions inside an application and rebuilds them for later playback. Unlike raw logs or error reports, it shows exactly what the user saw and did—from mouse movements and clicks to form inputs, navigation steps, and even how elements rendered on the page.
Instead of recording a video, session replay tools serialize DOM snapshots, event streams, and network requests, which are then stitched together to recreate the user experience. This approach keeps data lightweight, makes playback interactive, and supports advanced features like masking sensitive fields or linking actions directly to backend traces.
This allows engineering, product, and support teams to:
- Reproduce hard-to-catch bugs without asking users for screenshots
- Investigate conversion funnel drop-offs and UX friction points
- Correlate frontend actions with backend traces, logs, and metrics
- Improve customer support by sharing replays tied to error reports
Modern session replay platforms also provide privacy and compliance features such as field masking, consent banners, and regional data storage to meet GDPR, HIPAA, and DPDP requirements.
Example: How CubeAPM Handles Session Replay Monitoring
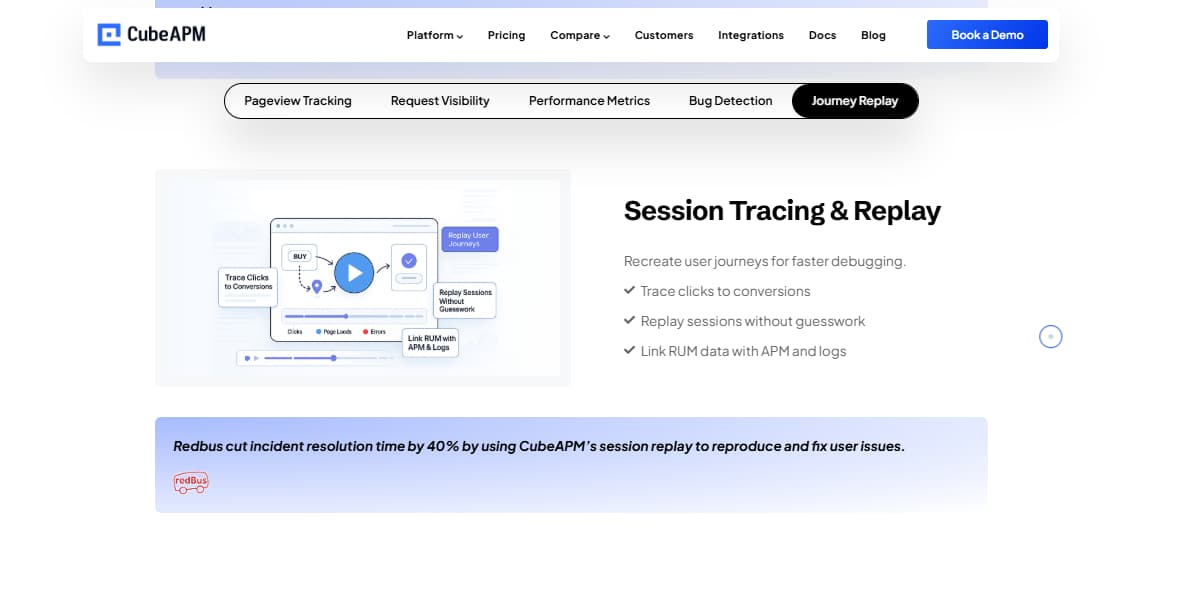
CubeAPM embeds session replay into its observability platform, connecting frontend replays with backend traces, logs, and metrics. This means when a user hits an error, engineers can not only watch the replay but also see the correlated stack traces, network requests, and system-level metrics in the same timeline.
Privacy and compliance are core: CubeAPM supports form-field masking, selector-based redaction, and consent controls, with data residency options for GDPR, HIPAA, and DPDP. Lightweight SDKs ensure minimal client-side impact, and smart sampling keeps costs predictable even at high volumes.
Here’s how CubeAPM makes session replay effective:
- DOM & Event Capture: High-fidelity snapshots plus mutation streams for accurate playback.
- Error Correlation: Session replays linked directly to console errors, spans, and logs.
- Network Waterfall: Requests, responses, and latency visualized alongside the replay.
- User Behavior Signals: Rage-clicks, dead-clicks, and drop-off markers highlighted.
- Privacy Controls: Input masking, regional storage, and configurable retention.
Why Teams Choose Different Session Replay Monitoring Tools
1. Depth of Insights: Product Analytics vs Observability
Some teams need funnel analysis, heatmaps, and UX insights (e.g., product-led tools), while engineering orgs prefer replay tightly correlated with traces, logs, and errors (observability suites). The primary goal—conversion optimization vs faster root-cause—drives the stack choice.
2. Replay Fidelity & Accuracy (SPAs, VDOM, iFrames)
Accuracy hinges on how a tool captures DOM snapshots + mutation streams and handles SPA router changes, virtual-DOM frameworks (React/Vue), shadow DOM, iFrames, and web components. Buyers compare layout stability, CSS capture, and whether replays stay pixel-true on dynamic pages.
3. Pricing Model & Scale Behavior
Vendors bill per session, per replay, or per-GB ingestion (sometimes bundled with APM/logs). Costs diverge fast at scale—especially with high-traffic SPAs or long sessions. Teams also weigh retention tiers, sampling controls, and base platform fees to avoid runaway bills at 10TB+ monthly telemetry.
4. Implementation Overhead & Client Performance
Rollout speed and page impact matter: snippet/SDK size, async loading, CPU usage during capture, and memory footprint under stress (rapid DOM mutations, large tables, media-heavy pages). Mature SDKs expose route hooks, error hooks, and API toggles for conditional capture.
5. Correlation & Data Model (Dev/Triage Workflow)
High-leverage stacks let you jump from a replay to the exact error group, network request, or backend span, preserving trace IDs and showing a network waterfall next to the replay. Source-map support, release markers, and issue-tracker links (Jira, GitHub) cut triage time.
6. Retention, Export & Downstream Use
Organizations differ on how long they need replays. Tools vary on retention windows, export options (to object storage/warehouse), and whether you can enrich replays with user/device metadata for cohort analysis or RCA postmortems.
7. Mobile & Cross-Platform Coverage
If you ship React Native, Flutter, or hybrid apps, you’ll want first-class mobile SDKs with stable playback and crash/error correlation. On web, teams validate support for SSR/CSR apps, edge-rendered frameworks, and legacy browsers used by their customers.
Top 8 Session Replay Monitoring Tools
1. CubeAPM
Known for
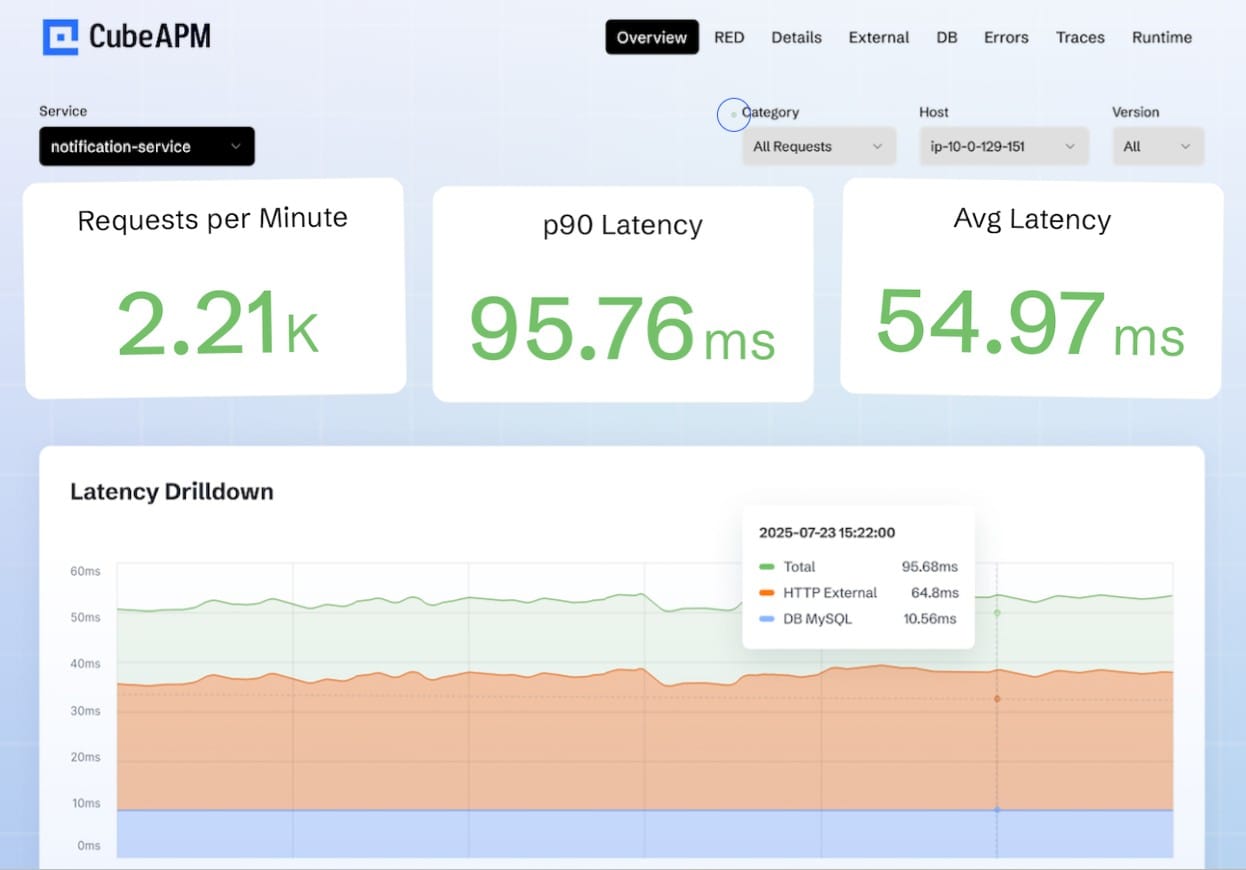
CubeAPM is recognized as a modern OpenTelemetry-native observability platform that unifies logs, metrics, traces, and session replay in a single workflow. It’s especially valued for its transparent flat-rate pricing and ability to correlate frontend behavior with backend performance, helping teams quickly trace user actions all the way to system-level impact.
Session Replay Monitoring Features
- High-fidelity DOM & event capture with pixel-accurate playback for SPAs and modern frameworks
- Rage-clicks, dead-clicks, and drop-off markers highlighted directly in the replay
- Network waterfall & console logs aligned with user actions
- Privacy-first controls including CSS selector masking, input redaction, and consent modes
Key Features
- Unified telemetry (logs, metrics, traces, replays) on one platform
- 800+ integrations across cloud, infra, and application ecosystems
- Smart Sampling to control ingestion costs at scale
- Bring-your-own-cloud (BYOC) or self-hosting for regulated teams
Pros
- Transparent flat pricing ($0.15/GB) for logs, traces, and replays
- Built for scale—predictable even at 10TB+ monthly ingestion
- Lightweight SDK with minimal performance overhead
- Data residency and compliance baked in
Cons
- Not suited for teams looking for off-prem solutions
- Strictly an observability platform and does not support cloud security management
Pricing
- Flat $0.15/GB for ingestion across logs, traces, and replays
CubeAPM Session Replay Monitoring Pricing at Scale
*All pricing comparisons are calculated using standardized Small/Medium/Large team profiles defined in our internal benchmarking sheet, based on fixed log, metrics, trace, and retention assumptions. Actual pricing may vary by usage, region, and plan structure. Please confirm current pricing with each vendor.
For a mid-sized SaaS company ingesting 45TB(~45,000) total monthly data ingestion and 45,000TB of observability data outcharged by the cloud provider, the total cost will be about ~$7200/month.
Tech Fit
CubeAPM is best suited for fast-growing SaaS, e-commerce, and enterprise teams that want unified monitoring without surprise bills. It’s also a strong choice for regulated industries that require regional storage, BYOC/self-hosting, and built-in compliance. For teams running at scale or expanding globally, CubeAPM ensures visibility remains consistent and cost-predictable.
2. Datadog
Known for
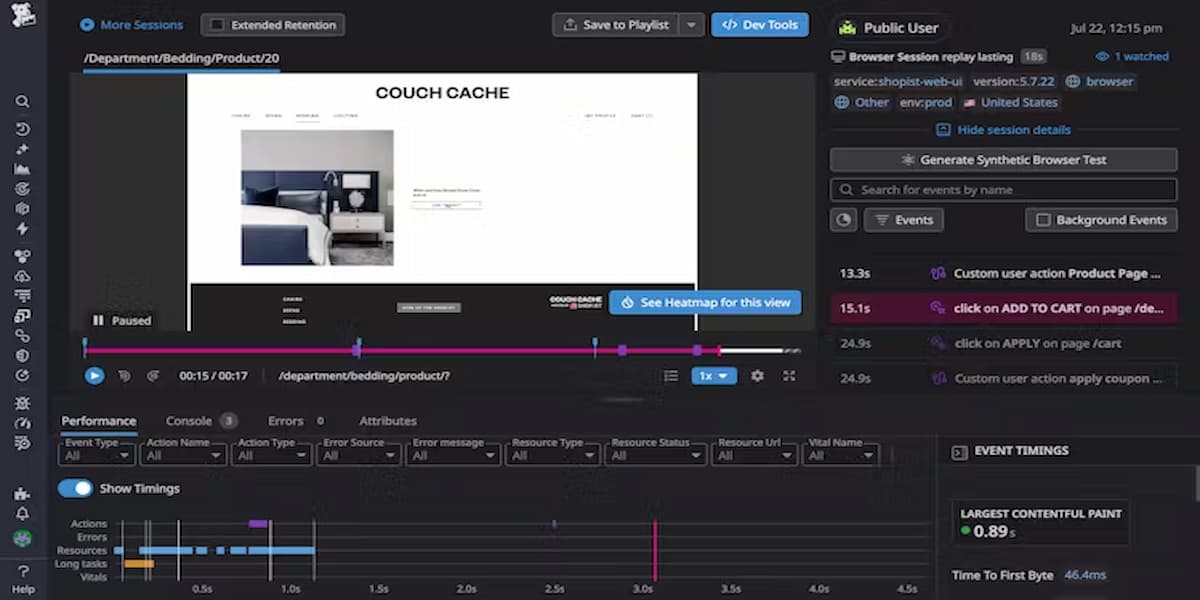
Datadog is a leading cloud monitoring and observability platform known for its wide coverage across infrastructure, logs, APM, and security monitoring. Over the years, it has added session replay to its RUM offering, giving teams the ability to visualize frontend user sessions alongside performance metrics and backend traces. It’s widely adopted by enterprises that value breadth of features and integrations, though its complexity and pricing are common pain points.
Session Replay Monitoring Features
- Integrated into Datadog Real User Monitoring (RUM) with replays tied to performance metrics
- DOM change and event capture with playback fidelity for modern frameworks
- Session timelines enriched with console logs, errors, and network calls
- Privacy and compliance settings with input masking and regional hosting options
Key Features
- 900+ integrations across cloud, infra, and developer ecosystems
- Full-stack observability: infrastructure, APM, logs, RUM, synthetics, security
- Advanced dashboards and analytics for multi-service architectures
- Marketplace of extensions for alerting, monitoring, and reporting
Pros
- All-in-one platform with strong ecosystem integrations
- Session replays integrated with traces and logs for cross-stack analysis
- Mature dashboards and analytics with customizable views
- Strong adoption across large enterprises
Cons
- Pricing is complex and adds up quickly with scale (multiple modules billed separately)
- Steep learning curve for smaller teams
- Advanced features often locked behind higher-tier plans
- Query and retention costs can surprise at scale
Pricing
- APM (Pro Plan): $35/host/month
- Infra (Pro Plan): $15/host/month
- Ingested Logs: $0.10 per ingested or scanned GB per month
Datadog Session Replay Monitoring Pricing at Scale
For a mid-sized SaaS company operating 125 APM hosts, 40 profiled hosts, 100 profiled container hosts, 500,000,000 indexed spans, 200 infra hosts, 1,500,000 container hours, 300,000 custom metrics, and ingesting around 10TB(~10,000 GB) of logs per month with 3500 indexed logs, the monthly cost would be around ~$27,475/month.
Tech Fit
Datadog is a strong fit for large enterprises and global teams that need broad coverage across infra, APM, and security in a single tool. It’s ideal for companies with complex, multi-cloud environments and deep DevOps teams that can handle its complexity.
3. PostHog

Known for
PostHog is an open-source product analytics and session replay platform designed for teams that want full control over their data. It’s known for combining self-hosted analytics, feature flags, A/B testing, and replays in one stack, making it a favorite among privacy-conscious organizations and engineering-driven startups. Unlike closed platforms, PostHog gives teams the option to deploy on their own infrastructure or use its managed cloud service.
Session Replay Monitoring Features
- Session recording with DOM events, clicks, and user flows across web apps
- Recordings tied to funnels, retention, and event-based analytics
- Supports filtering by user traits, cohorts, and error events
- Masking controls to protect sensitive fields and maintain compliance
- Works seamlessly with self-hosted deployments for privacy-first setups
Key Features
- Product analytics: funnels, retention, cohorts, and trends
- Built-in feature flags and A/B testing for experimentation
- Heatmaps and event visualization for UX analysis
- Open-source flexibility with plugin and API ecosystem
- Option to run self-hosted or use PostHog Cloud
Pros
- Open-source and self-hostable for maximum data control
- Combines analytics, replays, and feature flags in one tool
- Strong developer community with continuous contributions
- Cost-effective for small teams when self-hosted
Cons
- Requires engineering effort to self-host and maintain
- Scaling costs in the managed cloud can increase with heavy usage
Pricing
- Free self-hosted version with all core features
- Product Analytics: From $0.00005/event
- Session Replay: Multiple resources (usage-based, billed separately)
- Error Tracking: From $0.00037/exception
PostHog Session Replay Monitoring Pricing at Scale
For a SaaS company ingesting around 90 million product events per month, PostHog’s pricing at $0.00005/event comes to about $4,500, while tracking 25,000 exceptions adds another $9 at $0.00037/exception. Factoring in session replay storage and retention, costs rise by roughly $5500/month, bringing the total to around ~$8,000/month. This covers large-scale product analytics, error tracking, and replay usage, though final costs vary depending on replay retention policies.
Tech Fit
PostHog is ideal for startups, engineering-driven teams, and privacy-conscious organizations that want open-source flexibility and control. It’s particularly strong for companies experimenting with feature flags and A/B testing alongside analytics and replays.
4. LogRocket
Known for
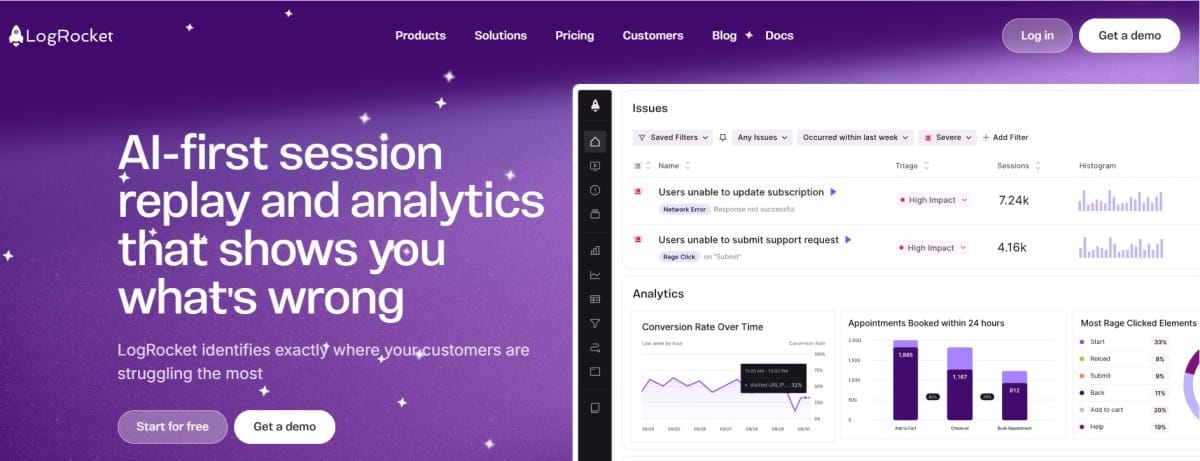
LogRocket is widely recognized as a product analytics and session replay platform that focuses on improving user experience through detailed replays, funnels, and conversion analysis. Unlike traditional observability vendors, it emphasizes UX insights and product optimization, helping product managers and developers see exactly how users interact with their applications.
Session Replay Monitoring Features
- Pixel-perfect replays with DOM, click, scroll, and keystroke tracking
- Integrated console logs, network requests, and JavaScript errors visible during playback
- Funnels and retention analysis to spot where users drop off
- Rage-click and frustration signal detection
- Filtering and search to quickly find sessions by user ID, error, or event
Key Features
- Product analytics (funnels, retention, conversion tracking)
- Session replay tightly coupled with frontend performance metrics
- Issue tracking integrations with Jira, GitHub, and Slack
- Tools for product managers to analyze behavior alongside engineering
Pros
- Strong product analytics capabilities on top of session replay
- Intuitive UI for product and design teams
- Detailed debugging context for developers
- Solid integrations with collaboration tools
Cons
- Pricing grows quickly with traffic and retention requirements
- Overwhelming UI for new users
Pricing
- Free Plan: $0/month, Includes 1,000 sessions/month, 1-month data retention
- Team Plan: Starting at $69/month, 10,000 sessions/month
- Professional Plan: Starting at $295/month, adds AI-powered struggle detection, detailed product analytics
LogRocket Session Replay Monitoring Pricing at Scale
For a company recording 1 million sessions per month, LogRocket’s costs increase steeply. On the Team plan, pricing is $69 for 10,000 sessions. Scaling that up, 1M sessions would be about 100 × $69 = $6,900/month. Larger volumes are handled under the Enterprise plan, which offers conditional recording and negotiated rates, but even with volume discounts, monthly spend can be around ~$5,000–$8,000 range.
Tech Fit
LogRocket is a strong fit for product-led SaaS companies, e-commerce platforms, and UX-driven teams that prioritize conversion optimization and user journey analysis.
5. New Relic

Known for
New Relic is a long-standing observability and APM platform that has expanded into full-stack monitoring with APM, infrastructure, logs, and session replay. It’s recognized for its unified per-GB pricing model and strong developer-friendly tooling, making it appealing to engineering teams that want flexibility and transparent ingestion costs. Its session replay is offered as part of the browser monitoring suite, integrated with error tracking and frontend performance metrics.
Session Replay Monitoring Features
- Replay sessions captured via the New Relic Browser agent with DOM events and interactions
- Replays tied to JavaScript errors, performance timings, and network requests
- Ability to filter and search replays by user attributes or error type
- Privacy tools, including PII masking and user consent configuration
Key Features
- All-in-one observability with APM, logs, metrics, synthetics, and replays
- Per-GB pricing across telemetry, simplifying cost forecasting
- AI-driven anomaly detection and alerts (New Relic AI)
- Dashboards and integrations with popular cloud services
Pros
- Simple per-GB pricing across telemetry types
- Session replay tightly integrated with frontend error monitoring
- Strong developer workflows with CLI, SDKs, and APIs
- Broad adoption in engineering-first teams
Cons
- Pricing can still scale steeply at high ingestion volumes
- The interface can feel overwhelming for new users
Pricing
- Free Tier: 100GB/month ingested
- Pro plan: $0.40/GB ingested beyond the free 100GB limit
- Pro Plan: $349/user for full platform user
New Relic Session Replay Monitoring Pricing at Scale
A mid-sized SaaS company ingesting 45TB (~45,000 GB) of telemetry data per month and with 10 full users, the cost would come around ~$25,990/month.
Tech Fit
New Relic works best for developer-driven teams, startups, and mid-sized companies that value simplicity and transparent pricing. It’s also a strong option for organizations that want to consolidate APM, logs, and frontend replays under one vendor. However, at enterprise scale, the per-GB model may require careful sampling strategies to avoid runaway costs.
6. Dynatrace
Known for
Dynatrace is known as an AI-driven observability and application monitoring platform that emphasizes automation, deep dependency mapping, and intelligent root-cause detection. Its approach goes beyond simple data collection, using the proprietary Davis AI engine to automatically surface anomalies and suggest fixes. Session replay is included as part of its Digital Experience Monitoring (DEM) suite, providing full visibility into user interactions alongside backend service health.
Session Replay Monitoring Features
- High-fidelity session replays integrated with Real User Monitoring (RUM)
- DOM event and interaction capture with smooth playback across modern web apps
- Replay linked to errors, performance timings, and backend traces
- Automatic detection of UX anomalies such as rage clicks or failed transactions
- Privacy controls for PII masking and regulatory compliance
Key Features
- AI-powered Davis engine for anomaly detection and RCA
- Automatic dependency discovery and service topology mapping
- Unified APM, infra, logs, replays, and security in one platform
- Cloud-native monitoring with strong Kubernetes and microservices support
Pros
- Strong AI-driven insights reduce manual triage
- Session replay tied into a wider DEM and APM ecosystem
- Excellent scalability for global enterprise environments
- Auto-discovery of services reduces manual instrumentation work
Cons
- High enterprise licensing costs, with less transparency than per-GB vendors
- Complexity requires skilled teams for full adoption
Pricing
- Infrastructure Monitoring: $29/mo/host
- Full-Stack Monitoring: $58/mo/8 GiB host
Dynatrace Session Replay Monitoring Pricing at Scale
A midsized SaaS company operating 125 APM hosts, 200 infra hosts, 10TB(~10,000 GB) of ingested logs, 300,000 custom metrics, 1,500,000 container hours, and 45,000GB of observability data out(charged by cloud provider), the cost would come around ~$21,850/month.
Tech Fit
Dynatrace is best suited for large enterprises with complex, distributed environments where AI-driven RCA and automatic service discovery deliver the most value. It’s a strong fit for global banks, telcos, and regulated industries with massive infrastructure footprints. For smaller or cost-conscious teams, however, its pricing and complexity may be overkill.
7. Sentry
Known for
Sentry is best known as a developer-first error and performance monitoring platform, widely adopted in open-source and commercial ecosystems. Initially focused on error tracking, it has expanded into application performance monitoring and session replay, making it easier for developers to reproduce bugs and understand the user journey leading up to an issue. Its strength lies in combining error context with lightweight replays directly inside developer workflows.
Session Replay Monitoring Features
- Session replay tied to error events so developers can watch what the user did before a crash
- Captures DOM changes, user interactions, console logs, and network requests
- Ability to highlight user frustration indicators like rage clicks
- Lightweight SDKs designed for quick setup in JavaScript, React, and modern frameworks
- Privacy-first design with input masking and consent controls
Key Features
- Error and exception tracking across multiple languages and frameworks
- Performance monitoring with distributed tracing support
- Integrations with GitHub, Jira, Slack, and other developer tools
- Strong open-source community and transparent roadmap
Pros
- Developer-friendly setup and open-source roots
- Session replay closely linked with error context
- Transparent pricing for smaller teams
- Strong ecosystem of integrations
Cons
- No native support for infrastructure metrics, logs
- Complex configuration setup
- Expensive at scale
Pricing
- Base Plan: $26/month, covers standard access
- Business: 80/month, covers 1 replay, 1 uptime monitor, nd 1 cron monitor
- Enterprise: Custom Pricing
Sentry Session Replay Monitoring Pricing at Scale
For a mid-sized SaaS company ingesting 10TB (~10,000GB) of logs, 500,000,000 indexed spans, and 45,000GB of observability data (charged by the cloud provider), the cost would come around $12,100/month.
Tech Fit
Sentry is a great fit for engineering teams and startups that want to directly connect session replay with error tracking and performance monitoring. It’s ideal for developer-centric organizations that prioritize debugging efficiency over advanced analytics. For enterprises needing broad observability and predictable pricing at scale, Sentry may need to be paired with other tools.
8. Microsoft Clarity
Known for
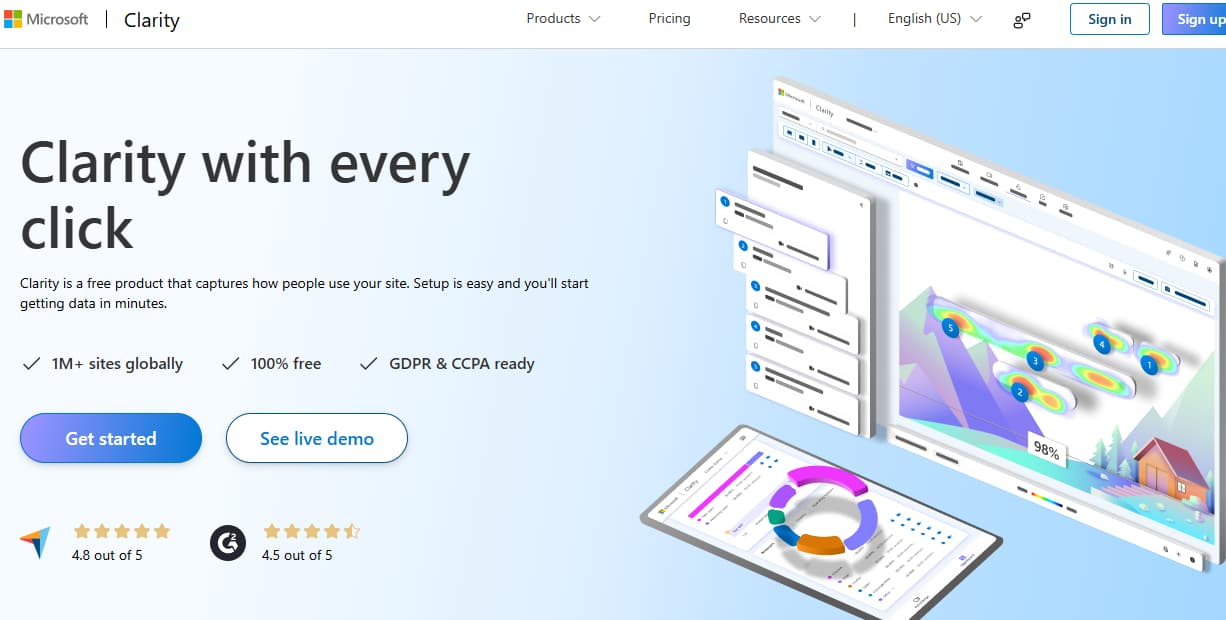
Microsoft Clarity is a free analytics and session replay tool designed to help teams quickly understand user behavior without incurring additional monitoring costs. It’s best known for its lightweight setup, heatmaps, and unlimited session recordings, making it a popular choice for small to mid-sized businesses and websites that need basic insights without enterprise-level budgets.
Session Replay Monitoring Features
- Unlimited session recordings with click, scroll, and navigation tracking
- Heatmaps to visualize user engagement across pages
- Filters to search sessions by device type, country, or user actions
- Automatic detection of frustration signals like rage clicks and dead clicks
- Integrates natively with Google Analytics and other analytics platforms
Key Features
- Free forever with no session caps
- Intuitive dashboards for non-technical users
- Works well for UX and marketing teams looking at behavioral data
- Lightweight JavaScript snippet with quick setup
Pros
- Completely free with unlimited sessions and heatmaps
- Simple, fast setup for web apps and websites
- Great for high-traffic sites that need replay at scale without costs
- Provides actionable UX insights out of the box
Cons
- Shorter retention and fewer privacy/compliance controls than enterprise tools
- Expensive at scale
- Overwhelming UI for new users
Pricing
- Free with unlimited sessions and heatmaps
Microsoft Clarity Session Replay Monitoring Pricing at Scale
Even at tens of millions of sessions per month, Microsoft Clarity remains completely free, making it unique among replay vendors. However, the trade-off is limited depth, fewer enterprise features, and a focus on basic UX analytics rather than full observability.
Tech Fit
Microsoft Clarity is a great fit for small businesses, content-heavy sites, marketing teams, and budget-conscious startups that need simple replay and heatmaps. It’s not designed for deep observability or enterprise compliance, but works well as a no-cost supplement alongside tools like CubeAPM or New Relic.
Conclusion
Choosing the right session replay monitoring tool depends on your team’s priorities—whether it’s deep product analytics with vendors like FullStory or LogRocket, or full-stack observability with platforms like Datadog, New Relic, and Dynatrace. Free options like Microsoft Clarity provide a low-barrier entry, while PostHog offers open-source flexibility for privacy-conscious teams.
But at scale, most organizations face two recurring challenges: cost unpredictability. That’s where CubeAPM stands out. With flat $0.15/GB pricing, native OpenTelemetry support, and a unified timeline that stitches together replays, logs, metrics, and traces, CubeAPM delivers both clarity and cost control.
If your team is looking for a scalable, compliance-ready, and developer-friendly session replay solution, CubeAPM is built for you. Start today and see how CubeAPM makes every user journey visible, actionable, and affordable.
Disclaimer: The information in this article reflects the latest details available at the time of publication and may change as technologies and products evolve.
FAQs
1. What is session replay monitoring used for?
Session replay monitoring is used to recreate a user’s journey on a website or app, showing clicks, scrolls, form inputs, and network requests. This helps teams reproduce bugs, analyze drop-offs in conversion funnels, and improve overall user experience.
2. Does session replay capture sensitive data?
No, most session replay tools provide privacy controls like input masking and field redaction to ensure sensitive data (e.g., passwords, credit card numbers) isn’t recorded. Platforms like CubeAPM allow teams to configure masking rules and enforce regional data residency to remain compliant with GDPR, HIPAA, and other data regulations.
3. How much does session replay monitoring cost?
Pricing varies widely by vendor. Tools like Microsoft Clarity are free, while enterprise platforms like FullStory and Datadog can cost $15,000–$40,000/month at high volumes. CubeAPM, by contrast, offers a flat $0.15/GB pricing model, making costs more predictable at scale.
4. Does session replay slow down my website or app?
Modern replay SDKs are designed to be lightweight and asynchronous, so they don’t block rendering or slow page loads. CubeAPM and other leading tools optimize payloads and stream only relevant DOM changes, keeping performance impact minimal.
5. Which is the best session replay monitoring tool?
The best tool depends on your needs. If you want product analytics (funnels, heatmaps, cohorts), FullStory or LogRocket are strong choices. For error monitoring, Sentry integrates replay directly with crashes. For end-to-end observability at scale with predictable pricing, CubeAPM is one of the best options.


