User experience is a key driver of digital success, where even small delays or poor Core Web Vitals scores affect conversions and search rankings. Real User Monitoring tools (RUM) have become essential, giving teams visibility into real sessions, Core Web Vitals, frontend errors, and backend calls.
CubeAPM delivers this with an OTEL-native Real User Monitoring platform that tracks Core Web Vitals (LCP, FID, CLS, INP), captures JavaScript errors with full stack traces, and ties them to session replays for instant debugging. With frontend–backend trace correlation, CubeAPM helps organizations scale RUM without runaway costs.
In this article, we’ll compare the top 8 RUM tools, explore their features, pricing, pros and cons, and highlight the best fit by use case.
Top 8 RUM Tools
- CubeAPM
- Datadog RUM
- New Relic Browser
- Dynatrace RUM
- Sentry
- SigNoz
- Raygun
- Elastic RUM
What is Real User Monitoring?

A Real User Monitoring (RUM) tool tracks the performance of applications as experienced by real users in real time. Unlike synthetic monitoring, which simulates visits with pre-defined tests, RUM collects data directly from browsers and devices during live sessions. This provides accurate insight into how users experience page load times, responsiveness, and errors across different conditions.
Modern RUM platforms go beyond simple speed metrics. They measure Core Web Vitals:
- Largest Contentful Paint (LCP)
- First Input Delay (FID)
- Cumulative Layout Shift (CLS)
- Additional metrics such as Time to First Byte (TTFB), API latency, network errors, and JavaScript crashes.
How CubeAPM Powers Real User Monitoring at Scale
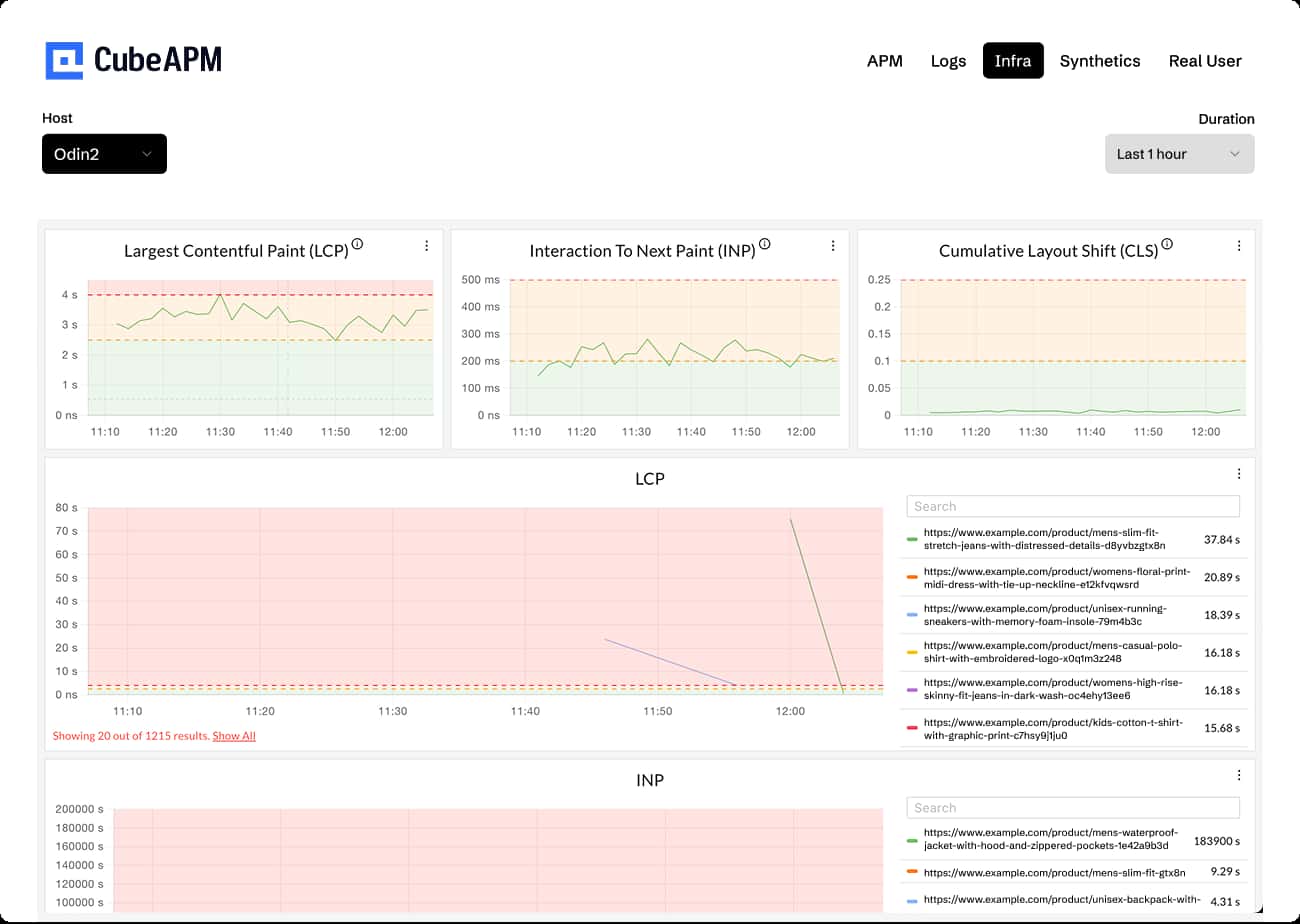
CubeAPM Real User Monitoring dashboard showing Core Web Vitals (LCP, INP, CLS) with per-page load insights to spot slow product URLs.
CubeAPM elevates Real User Monitoring by combining OTEL-native browser instrumentation, session replay, distributed tracing, and infrastructure monitoring into a single platform built for enterprise scale. Here’s how it addresses the unique challenges of frontend performance in modern digital experiences:
- Core Web Vitals First-Class Support: CubeAPM continuously tracks Google’s Core Web Vitals (LCP, FID, CLS, INP) for every session. These metrics directly impact SEO rankings and conversions, helping product teams fix regressions before they harm revenue or search visibility.
- Session Replay with Error Context: Instead of guessing what went wrong, CubeAPM links JavaScript errors to full session replays. Engineers can see exactly what the user saw — clicks, scrolls, crashes — and replay the journey frame by frame. This drastically reduces debugging time and improves user satisfaction.
- Geo, Device, and Network Insights: User experience varies across regions, ISPs, devices, and browsers. CubeAPM provides breakdowns by geography, OS, and device type, allowing teams to detect if performance issues are isolated (e.g., Safari users in APAC) or global.
- Frontend–Backend Trace Correlation: A unique strength of CubeAPM is how RUM ties frontend issues directly to backend traces and API calls through distributed tracing. Teams can instantly see if a slow LCP is caused by a delayed React render, a third-party script, or a backend API bottleneck — bringing frontend monitoring into the same workflow as enterprise and infrastructure monitoring.
- SPA and Mobile App Coverage: Modern apps don’t reload pages — they rely on single-page frameworks (React, Angular, Vue) and mobile clients. CubeAPM’s RUM captures route changes, long tasks, and API timings for SPAs and mobile apps, giving end-to-end visibility into dynamic user journeys.
Why Teams Choose Different RUM Tools
1. Cost concerns & pricing models
RUM is valuable, but costs often climb faster than expected. Many vendors charge per session, per event, or per GB ingested, which makes bills unpredictable when traffic spikes or seasonal demand hits. For a fast-growing SaaS or eCommerce platform, what starts as a few hundred dollars can quickly escalate into thousands, forcing teams to rethink their vendor choice.
2. Need for lightweight tools
Not every team needs an enterprise observability suite with dozens of features they won’t use. Startups and smaller engineering teams often prefer lean, developer-friendly RUM solutions that focus on the essentials — Core Web Vitals, error tracking, and a few key dashboards — without the complexity or overhead of enterprise platforms.
3. Avoiding vendor lock-in
Vendor-specific SDKs, pricing, and dashboards make switching painful. Many teams now prefer OpenTelemetry-first or self-hosted tools that let them own their data pipelines and dashboards. This flexibility ensures they aren’t trapped in costly vendor ecosystems and can integrate RUM data into their broader observability workflows.
4. Aggregation & alerting gaps
Simple alerts like “LCP > 2.5s” are helpful, but insufficient for serious operations. Teams expect percentile-based and trend-based alerts, a feature usually seen in advanced observability tools. When a RUM product can’t deliver this, teams are pushed back toward broader enterprise monitoring platforms — even if that means higher costs.
5. Frontend – Backend Correlation
The biggest value of advanced RUM is when it integrates with distributed tracing. By linking frontend slowdowns directly to backend calls or database queries, engineers get end-to-end visibility across the stack. This is especially valuable for SaaS and eCommerce platforms where a single bottleneck can make or break conversions.
6. User Experience Insights vs. Pure Metrics
Different stakeholders want different insights from RUM. Marketing and product teams value session replays, click maps, and funnel analysis, while engineering teams focus on Core Web Vitals, error tracking, and API latency. Tool choice often depends on which department drives the budget..
7. Ecosystem & Integrations
Large enterprises already invested in platforms like Datadog or New Relic often default to those ecosystems for RUM because of bundled pricing and integrations. In contrast, lean startups prefer independent solutions such as CubeAPM or Sentry that integrate flexibly into workflows with Slack, Jira, or GitHub.
Top 8 Real User Monitoring Tools in 2025
1. CubeAPM

Overview
CubeAPM is a full-stack observability platform purpose-built around OpenTelemetry-native ingestion. Its RUM capabilities capture Core Web Vitals, frontend errors, and session replay while tying them directly to backend traces and logs. With flat, predictable pricing and support for both cloud and self-hosted deployments, CubeAPM appeals to organizations that want cost control and compliance flexibility.
RUM-Specific Features
- Core Web Vitals dashboards (LCP, FID, CLS)
- Real session replay tied to errors
- Frontend error capture with trace correlation
- Geo- and device-level performance breakdowns
- SPA (React, Angular, Vue) monitoring and route-change tracking
Key Features
- Tracks LCP, FID, and CLS for UX and SEO.
- Detects and correlates JS errors with backend traces.
- Reconstructs full user journeys with error context.
- Native OpenTelemetry integration for browsers and SPAs.
- Meets compliance needs (HIPAA/GDPR).
Pros
- Cost-effective with transparent pricing.
- Full MELT (metrics, events, logs, traces) support.
- Flexible deployment: cloud or self-hosted.
Cons
- Not suited for teams looking for off-prem solutions
- Strictly an observability platform and does not support cloud security management
Pricing
Pricing: Flat pricing of 0.15/GB
CubeAPM Real User Monitoring(RUM) Pricing At Scale
*All pricing comparisons are calculated using standardized Small/Medium/Large team profiles defined in our internal benchmarking sheet, based on fixed log, metrics, trace, and retention assumptions. Actual pricing may vary by usage, region, and plan structure. Please confirm current pricing with each vendor.
For a mid-sized SaaS company ingesting 45TB(~45,000) total monthly data ingestion and 45,000TB of observability data outcharged by the cloud provider, the total cost will be about ~$7200/month.
Tech Fit
CubeAPM fits well for teams building cloud-native applications, SPAs, and mobile apps that need precise tracking of Core Web Vitals and real-time error correlation. Its OTEL-native design means it works seamlessly across languages and frameworks, while predictable pricing makes it accessible for both startups and large enterprises.
2. Datadog
Overview
Datadog RUM is part of Datadog’s extensive observability suite, designed for large enterprises and cloud-native teams. It provides deep frontend monitoring with session replay, error grouping, and Core Web Vitals dashboards. Its strength lies in tight integration with Datadog’s ecosystem, though this also means pricing can scale unpredictably as features are layered on.
RUM-Specific Features
- Session Replay with Full Context
- Core Web Vitals Visualization & Drill-Down
- Optimization Workflow for INP, LCP, CLS
- Error & Issue Aggregation
- Rich Custom Context & Telemetry Enrichment
- RUM + Synthetic Monitoring Correlation
Key Features
- Measures LCP, FID, CLS.
- Visualizes user interactions.
- Connects frontend sessions with backend spans.
- Identifies anomalies automatically.
- Captures performance of external scripts.
Pros
- Wide integration ecosystem.
- Mature dashboards and visualization.
- Strong enterprise adoption and support.
Cons
- Expensive at scale.
- Steeper learning curve for small teams.
Pricing
- APM (Pro Plan): $35/host/month
- Infra (Pro Plan): $15/host/month
- Ingested Logs: $0.10 per ingested or scanned GB per month
Datadog Real User Monitoring(RUM) Pricing At Scale
For a mid-sized SaaS company operating 125 APM hosts, 40 profiled hosts, 100 profiled container hosts, 500,000,000 indexed spans, 200 infra hosts, 1,500,000 container hours, 300,000 custom metrics, and ingesting around 10TB(~10,000 GB) of logs per month with 3500 indexed logs, the monthly cost would be around ~$27,475/month.
Tech Fit
Datadog RUM is well-suited for large-scale enterprises running multi-cloud or Kubernetes-heavy stacks. Its strength lies in correlating frontend metrics with the broader Datadog ecosystem, making it ideal for organizations already invested in Datadog for APM, logs, and infra monitoring.
3. New Relic Browser
Overview
New Relic Browser delivers end-to-end visibility of frontend performance, tying real user data directly to backend APM traces. It offers waterfall charts, error analytics, and Core Web Vitals tracking, making it popular with engineering teams in enterprise environments. Its advantage is full-stack context, though costs and user-based pricing can become a challenge at scale.
RUM-Specific Features
- Session Replay
- Browser & Mobile RUM Integration
- Mobile User Journeys with Breadcrumbs & Events
- Full-Stack Context in RUM
Key Features
- Breaks down resources by timing.
- Monitors LCP, FID, CLS.
- Captures and trends browser errors.
- Connects frontend actions with backend spans.
- Tracks end-to-end navigation paths.
Pros
- Excellent frontend visualization.
- Enterprise-grade stability and support.
- Strong ecosystem for legacy Java/enterprise stacks.
Cons
- Expensive as usage grows.
- Steep learning curve for new users.
- Requires deep expertise to execute advanced queries.
Pricing
- Free Tier: 100GB/month ingested
- Pro plan: $0.40/GB ingested beyond the free 100GB limit
- Pro Plan: $349/user for full platform user
New Relic Real User Monitoring(RUM) Pricing At Scale
A mid-sized SaaS company ingesting 45TB (~45,000 GB) of telemetry data per month and with 10 full users, the cost would come around ~$25,990/month.
Tech Fit
New Relic’s RUM tool integrates best with enterprise Java, .NET, and browser-heavy applications, where teams need full-stack visibility tied to backend traces. It’s also a strong fit for companies that rely on detailed waterfall views and want unified monitoring across mobile, frontend, and server-side.
4. Dynatrace

Overview
Dynatrace RUM provides AI-assisted digital experience monitoring that captures every user journey across web and mobile apps. It integrates session replay, anomaly detection via Davis AI, and detailed performance breakdowns. Known for its enterprise focus, Dynatrace is powerful but often seen as complex and over-engineered for smaller teams.
RUM-Specific Features
- Full visibility across user journeys
- Visually Complete & Waterfall Performance Metrics
- Session Replay
- AI-Powered Anomaly Detection (Davis AI)
- Real-Time Issue Detection & Session Correlation
- RUM Browser Extension for 3rd-Party Apps
- Event-Based Data Enrichment & Long-Term Querying
Key Features
- Records user behavior and frontend issues.
- Identifies regressions proactively.
- Full compliance with SEO-critical metrics.
- Correlates frontend with microservices.
- Works across multi-cloud deployments.
Pros
- AI-driven root cause analysis.
- Scales globally across enterprises.
- Strong support for hybrid and legacy stacks.
Cons
- Complex to set up and manage.
- Premium-level pricing.
Pricing
- Infrastructure Monitoring: $29/mo/host
- Full-Stack Monitoring: $58/mo/8 GiB host
Dynatrace Real User Monitoring(RUM) Pricing At Scale
A midsized SaaS company operating 125 APM hosts, 200 infra hosts, 10TB(~10,000 GB) of ingested logs, 300,000 custom metrics, 1,500,000 container hours, and 45,000GB of observability data out(charged by cloud provider), the cost would come around ~$21,850/month.
Tech Fit
Dynatrace RUM works best in complex enterprise environments, especially those with large-scale Java, .NET, and microservices applications. Davis AI suits organizations that want automated anomaly detection and replay at scale, though it may feel over-engineered for smaller teams.
5. Sentry
Overview
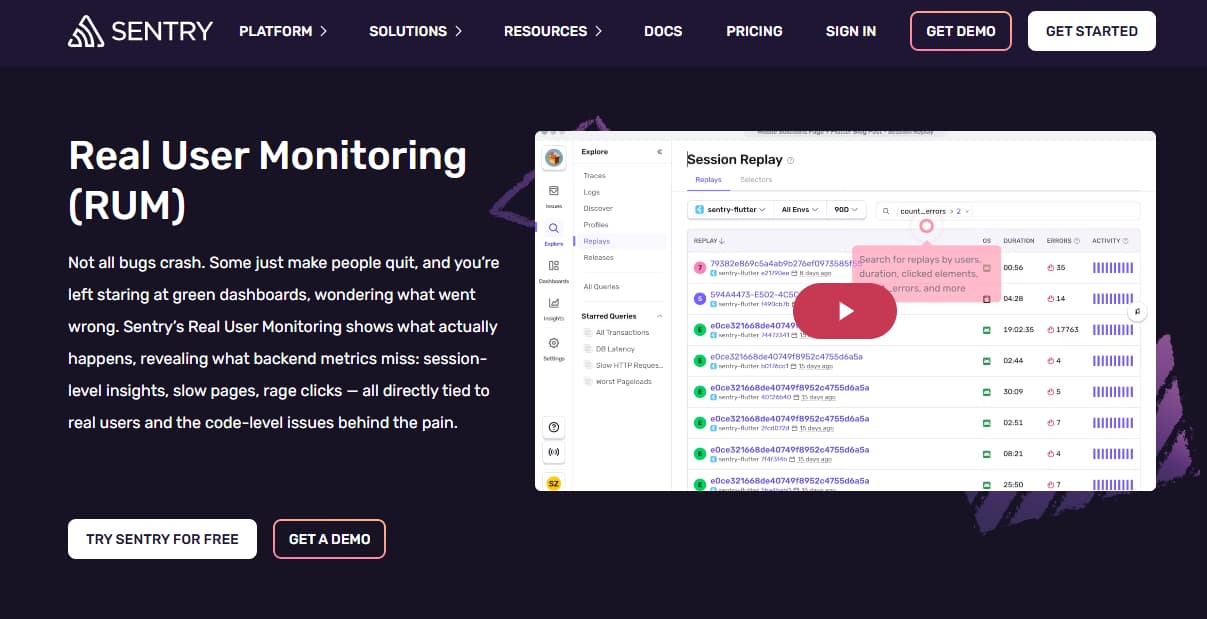
Sentry started as a developer-first error tracking tool and has grown into a platform that includes RUM and performance monitoring. Its RUM solution captures frontend metrics, errors, and slow transactions with direct links to stack traces. This makes it particularly attractive for teams that want lightweight, developer-centric monitoring without adopting a full enterprise platform.
RUM-Specific Features
- Session Replay
- Trace-linked frontend metrics and slowdowns
- Web Vitals monitoring (LCP, CLS, FCP, TTFB, INP)
- Performance issues grouped by user impact
- Session-to-trace correlation for deep debugging
- Automatic SPA route and long-task capture
Key Features
- Detects and triages JS errors.
- Measures slow transactions and frontend bottlenecks.
- Tracks issues tied to specific app versions.
- Links frontend errors to backend traces.
- Debugs minified code in production.
Pros
- Affordable entry pricing.
- Strong open-source community.
- Easy to set up and integrate.
Cons
- No native support for infrastructure metrics, logs
- Complex configuration setup
- Expensive at scale
- Delays in error reporting, alerts, and display
Pricing
- Base Plan: $26/month, Covers standard access
- Business: 80/month, covers 1 replay, 1 uptime monitor, nd 1 cron monitor
- Enterprise: Custom Pricing
Sentry Real User Monitoring(RUM) Pricing At Scale
For a mid-sized SaaS company ingesting 10TB (~10,000GB) of logs, 500,000,000 indexed spans, and 45,000GB of observability data (charged by the cloud provider), the cost would come around $12,100/month.
Tech Fit
Sentry RUM is designed for developer-first teams building SPAs, Node.js backends, or mobile apps. It’s particularly strong where fast debugging of JavaScript errors and trace-linked session replay are priorities, making it popular among product and engineering teams who want rapid, code-level insights.
6. SigNoz
Overview
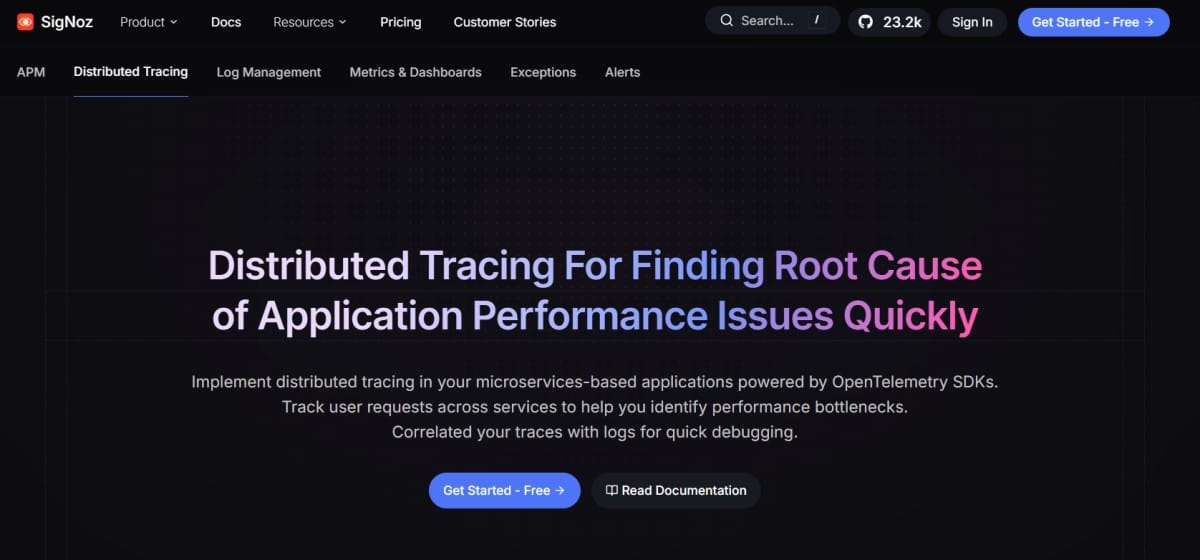
SigNoz is an open-source, self-hosted observability platform that provides RUM as part of its OTEL-native monitoring stack. It enables teams to track Core Web Vitals, frontend errors, and session performance while retaining full control over their telemetry data. Its community-driven model and flexibility make it a favorite for compliance-heavy industries and cost-sensitive teams.
RUM-Specific Features
- Native OpenTelemetry support for frontend instrumentation
- Unified dashboards combining logs, metrics, and traces for end-to-end RUM insights
- Distributed tracing with flamegraphs and Gantt chart visualization
- Flexible dashboards and custom queries (PromQL-like or DIY) for RUM analysis
Key Features
- Works seamlessly with OpenTelemetry browser SDKs.
- Captures page load and navigation timings.
- Dashboards for LCP, FID, CLS.
- JS error capture with context.
- Build tailored frontend reports.
Pros
- Open-source and free to self-host.
- Full OTEL support.
- Good for compliance-heavy teams.
Cons
- Managing ClickHouse memory usage is time-consuming
- Operational complexity, especially for managing the stacks
- The UI, while functional, might feel cluttered
Pricing
- Free tier + base fee of $49/month. Charges beyond the base fee are based on data ingested:
- Traces: $0.30/GB.
- Logs: $0.30/GB.
- Metrics: $0.10/million samples.
SigNoz Real User Monitoring(RUM) Pricing At Scale
For a mid-sized SaaS company that ingests 25,000GB of data by APM hosts, 10,000GB of data by infrastructure hosts, 10,000GB of data by log hosts, and 45,000GB of observability data (charged by the cloud provider), the cost would be approximately $16,000.
Tech Fit
SigNoz is a strong choice for teams that need self-hosted or compliance-driven deployments while still monitoring frontend performance. It fits well for companies with engineering teams who prefer open-source, OTEL-native solutions, and want to avoid vendor lock-in while retaining control of their telemetry data.
7. Raygun
Overview
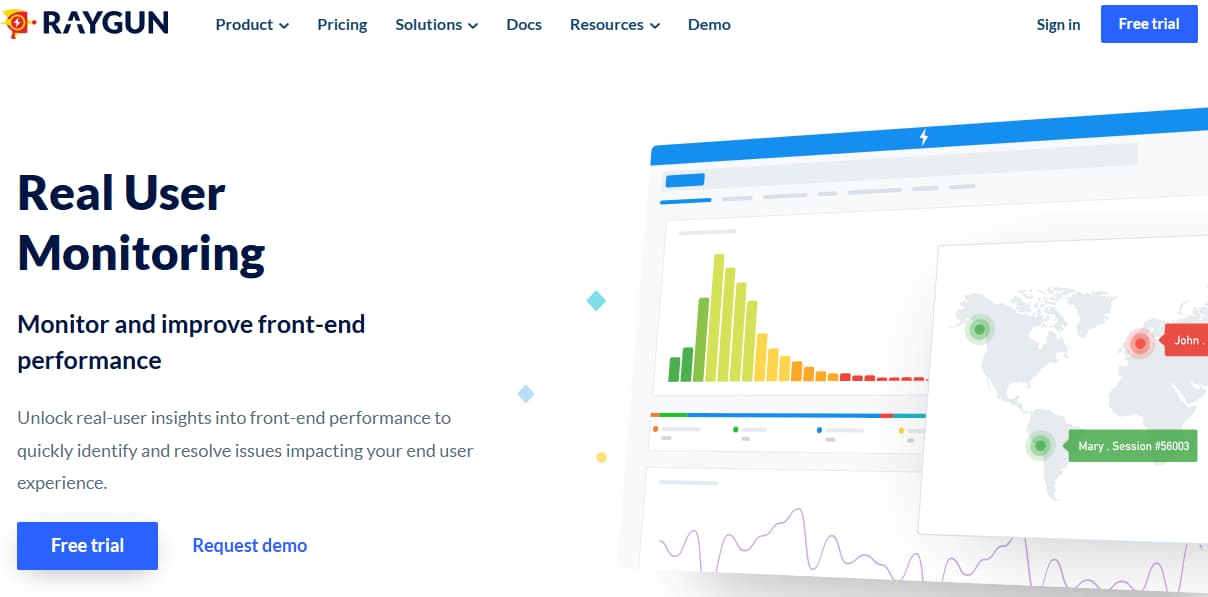
Raygun specializes in real user monitoring and crash reporting, built with developers in mind. It provides detailed session-level insights, Core Web Vitals tracking, and crash diagnostics across browsers and devices. With an emphasis on fast debugging and performance optimization, Raygun fits well for SaaS products and customer-facing applications.
RUM-Specific Features
- Session replay inside Crash Reporting
- Core Web Vitals support (including INP)
- Performance breakdowns by browser, version, geolocation, URL, device, and tags
- Detailed waterfall views and histograms with session-level timings
Key Features
- Records every page view and action.
- Error monitoring for JS, mobile, and backend.
- Built-in UX metrics.
- Regional latency and availability maps.
- Flexible visualization options.
Pros
- Strong focus on frontend and UX.
- Easy to deploy with SDKs.
- Affordable for SMBs.
Cons
- Pricing grows with traffic.
- Steep learning curve for new users
Pricing
- APM: starts $80/100k/month
- RUM: starts $80/100k/month
- Crash Reporting: starts $40/100k/month
- SAML SSO (add-on): $50/month
- Usage capping (add-on): $40/month
Raygun Real User Monitoring(RUM) Pricing At Scale
For a midsized company processing 2M APM events, 2M RUM events, and 1M crash reports monthly, Raygun costs scale more moderately: APM at $80 × 20 = $1,600, RUM at $1,600, and crash reporting at $40 × 10 = $400. With SAML SSO ($50) and usage capping ($40), the total monthly bill comes to around ~$3,690.
Tech Fit
Raygun’s RUM fits best for frontend-heavy SaaS and mobile apps where developers need granular crash reporting tied to real user sessions. It’s favored by engineering teams that want fast feedback on JavaScript errors, Core Web Vitals, and performance bottlenecks without adopting a full observability suite.
8. Elastic Observability RUM
Overview
Elastic RUM is part of the Elastic Observability suite and ties directly into the Elastic Stack (Elasticsearch, Kibana, Logstash). It captures browser metrics, Core Web Vitals, and performance timings, while allowing users to query and visualize data through Kibana dashboards. Its open-source foundation makes it highly flexible, though setup can be complex for teams not already using Elastic.
RUM-Specific Features
- Real-time tracking of Core Web Vitals (LCP, INP, CLS), TTFB, DOM Interactive, and DOM Complete
- Filtering and analysis by URL, OS, browser, and geographic location
- Integration with Elastic APM to correlate RUM data with backend traces, logs, and metrics
- Out-of-the-box dashboards and visualizations in Kibana for performance insights
- Open-source flexibility with Elastic’s search-driven analytics.
Key Features
- Captures CWV and timing metrics.
- Connects frontend sessions to backend services.
- Logs JS and API errors.
- Latency breakdowns by region.
- Customizable via Kibana.
Pros
- Free and open-source.
- Flexible for custom dashboards.
- Strong ecosystem with Elastic Stack.
Cons
- Expensive as usage grows
- Overwhelming UI for new users
- Complex initial setup
Pricing
- Standard: $99/month
- Gold: $114/month
- Platinum: $131/month
- Enterprise: $184/month
Elastic Observability Real User Monitoring(RUM) Pricing At Scale
For a mid-sized SaaS company with 125 APM hosts, 20TB of event ingestion per month, and 45,000GB of observability data (charged by the cloud provider), the cost would be around $17,435.
Tech Fit
Elastic RUM works well for teams already using the Elastic Stack for logging and search. It’s especially suitable for organizations that want open-source flexibility, customizable dashboards in Kibana, and correlation of RUM data with logs and metrics in a single ecosystem.
Conclusion
Our review of the top RUM tools shows there is no one-size-fits-all solution. CubeAPM stands out with its OTEL-native browser instrumentation, Core Web Vitals dashboards, error-to-trace correlation, session replay, and geo/device-level performance insights — all delivered with predictable pricing. This makes it a strong fit for teams seeking scalable RUM without runaway costs.
The right RUM tool ultimately depends on scale, use case, and budget — but the goal is universal: turning real user data into faster, smoother digital experiences.
Disclaimer: The information in this article reflects the latest details available at the time of publication and may change as technologies and products evolve.
FAQs
1. What is the best RUM tool?
CubeAPM is considered one of the best Real User Monitoring (RUM) platforms because it is OpenTelemetry-native, offers Core Web Vitals dashboards, JavaScript error tracking, session replay, and geo/device-level insights — all with predictable pricing that scales easily for startups and enterprises alike.
2. What features does CubeAPM’s RUM provide?
CubeAPM’s RUM captures real user sessions, measuring page load times, LCP, FID, CLS, INP, API latency, and JavaScript errors. It also includes session replay tied to errors, frontend-to-backend trace correlation, and detailed performance breakdowns by device, browser, and location — making it a complete RUM solution.
3. Does CubeAPM support OpenTelemetry for RUM?
Yes. CubeAPM is built OTEL-first, which means teams can instrument browsers, SPAs, and mobile apps without vendor lock-in. All RUM data flows into the same observability pipeline as logs, traces, and metrics, giving engineering teams a unified view of the user experience.
4. How much does CubeAPM cost for RUM at scale?
CubeAPM keeps pricing simple and predictable. Instead of billing per session, CubeAPM charges a flat $0.15/GB ingested. For example, a midsized company ingesting 10TB/month would pay about $1,500/month, which is highly cost-efficient compared to session-based models that can balloon as traffic grows.
5. How is RUM different from synthetic monitoring in CubeAPM?
With CubeAPM, RUM captures actual user interactions — page loads, clicks, API calls, and errors — while synthetic monitoring runs scripted checks to validate availability and SLAs. Used together, CubeAPM helps teams combine real-world user journeys with proactive testing, ensuring complete coverage of performance and reliability.


