RabbitMQ is a leading open-source message broker with 35,000+ GitHub stars, used from startups to Fortune 500s. In production, teams must go beyond the basic Management UI to track queue depth, consumer lag, and cluster health. With data volumes growing and SaaS costs rising, efficient, correlated monitoring across metrics, traces, and logs has become essential.
CubeAPM positions itself as a modern monitoring tool for RabbitMQ. CubeAPM simplifies RabbitMQ monitoring by directly ingesting metrics from the Management API, mapping them to traces and logs, and providing ready-made dashboards and alerts to detect backlogs or consumer drops before they escalate.
In this guide, we’ll break down the top RabbitMQ monitoring tools available today. We’ll compare their RabbitMQ-specific features, pricing, and trade-offs so you can choose the right fit for your workloads.
Best RabbitMQ Monitoring Tools
- CubeAPM
- Grafana Cloud
- Datadog
- Elastic Observability
- SigNoz
- New Relic
- Better Stack
- Dynatrace
What is RabbitMQ Monitoring
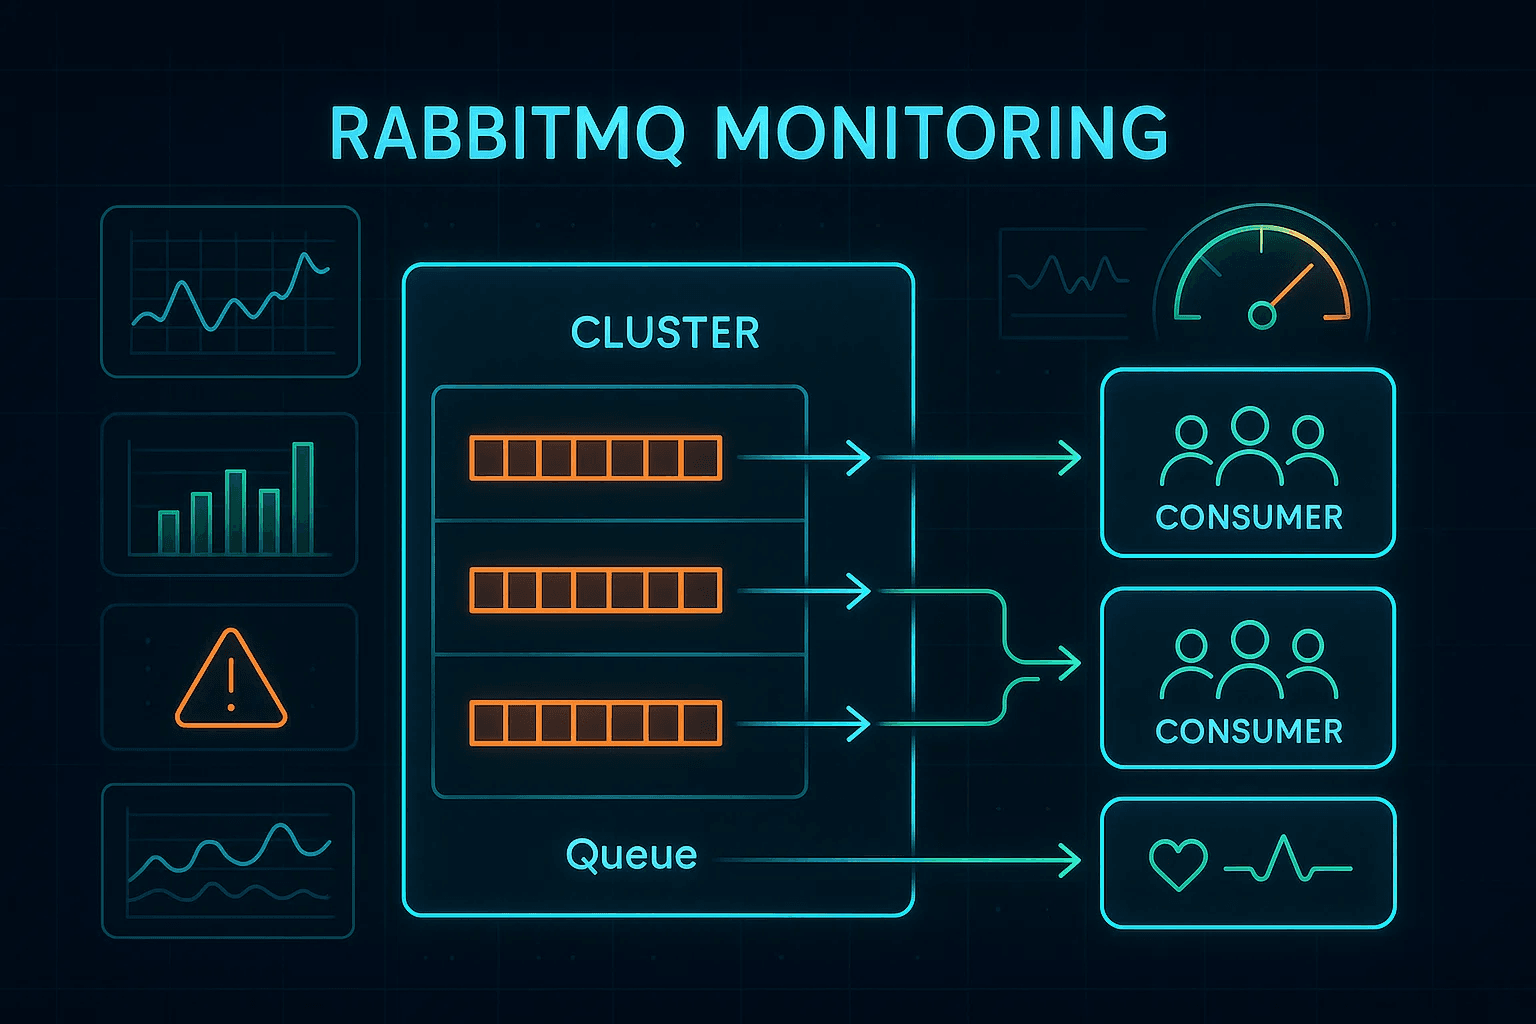
RabbitMQ monitoring is the process of tracking the health and performance of a RabbitMQ cluster. It focuses on metrics such as queue depth, message publish and delivery rates, consumer activity, connection churn, and node resource usage. These indicators indicate whether messages are flowing smoothly or if bottlenecks—such as backlogged queues or stalled consumers—are forming.
At its core, RabbitMQ monitoring goes beyond checking node uptime: it ensures reliable message delivery, prevents cascading delays in distributed systems, and provides the visibility needed to keep applications responsive.
Common Failure Scenarios RabbitMQ Monitoring Helps Detect
- Queue Backlogs: When publishers outpace consumers, queues fill up, increasing latency and risking dropped or expired messages.
- Consumer Crashes or Stalls: A consumer process going offline or hanging can cause message delivery delays, even if the broker itself is healthy.
- Connection and Channel Leaks: Excessive open connections or channels can exhaust broker resources, leading to rejected clients and unstable clusters.
Example: How CubeAPM Handles RabbitMQ Monitoring
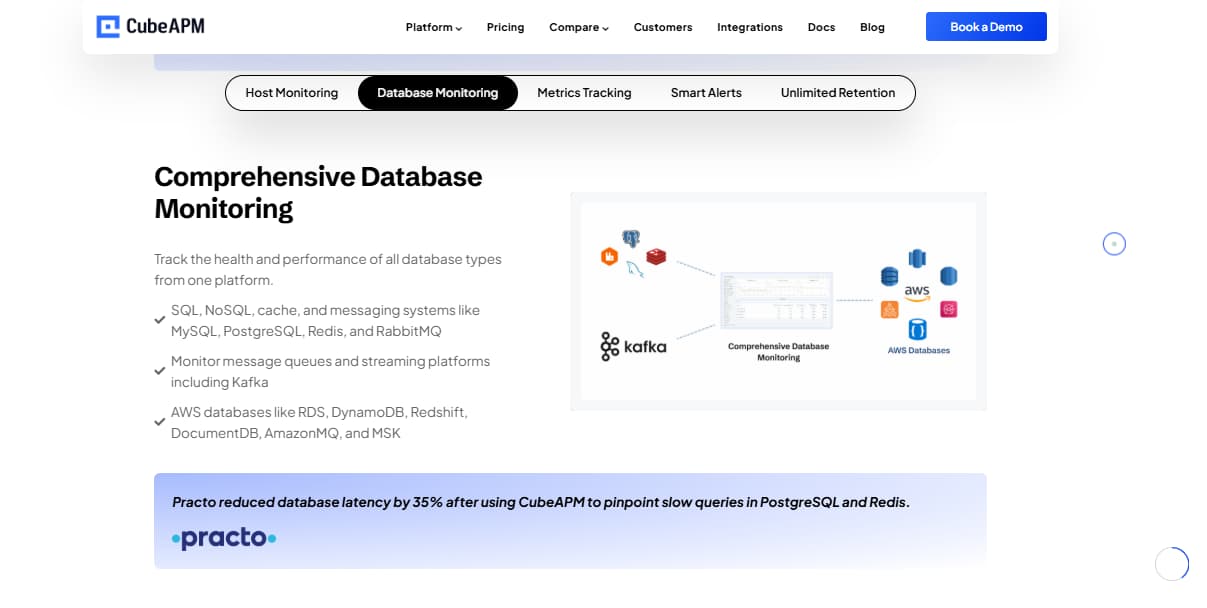
CubeAPM integrates directly with the RabbitMQ Management API and Prometheus plugin through the OpenTelemetry Collector. This setup provides continuous metrics such as queue depth, ack rates, consumer counts, and node health.
Unlike the default RabbitMQ UI, CubeAPM correlates these broker metrics with traces and logs from producer and consumer applications. This makes it clear whether slow consumers, overloaded queues, or faulty publishers are driving delays.
Teams can also use prebuilt dashboards and alerting rules, for example:
- Triggering alerts if consumers drop to zero
- Detecting sustained queue backlogs
- Flagging when message rates exceed delivery capacity
This end-to-end visibility helps prevent cascading failures and keeps RabbitMQ clusters stable in production.
Why Teams Choose Different RabbitMQ Monitoring Tools
1. Depth of RabbitMQ Surface Coverage
Tools differ in how fully they capture data from RabbitMQ’s Management API and Prometheus plugin. The strongest solutions expose per-queue, per-vhost, and per-consumer metrics, along with details like unroutable messages, expired messages, and node health.
2. Export Path & Metric Fidelity
Some platforms scrape the rabbitmq_prometheus endpoint on each node and then build cluster-wide views, while others poll the HTTP API directly. The method impacts how granular the data is and whether you get per-node versus aggregated insights.
3. Quorum-Queue & Topology Awareness
Modern RabbitMQ deployments increasingly use quorum queues with Raft-based replication. Monitoring that understands leader/follower roles, replica counts, and failover behavior helps explain backlogs during elections or node failures.
4. Failure-Mode Diagnostics
Strong tools make it easy to detect queue backlogs, consumer stalls, or connection/channel exhaustion, then trace their impact on dependent services. Native RabbitMQ surfaces expose these signals, but not all monitoring platforms highlight them clearly.
5. Trace/Log Correlation for Root Cause
Correlating RabbitMQ metrics with application traces and logs shortens resolution times. This makes it easier to identify if a queue backlog is caused by slow consumers, publisher spikes, or downstream bottlenecks.
6. Managed RabbitMQ Nuances
For managed offerings like Amazon MQ for RabbitMQ, monitoring tools must adapt to provider-specific limits, exposed metrics, and feature sets—such as partial Management API support or version differences around quorum queues.
7. Alert Philosophy & SLOs
Teams take different approaches to RabbitMQ alerting—some prefer rate-based alerts (publish much higher than deliver), others focus on thresholds (queue depth or consumer counts), and some emphasize resource usage (file descriptors or channels). Tools that provide built-in RabbitMQ alert templates reduce guesswork and improve reliability.
Top 10 RabbitMQ Monitoring Tools
1. CubeAPM
Known for
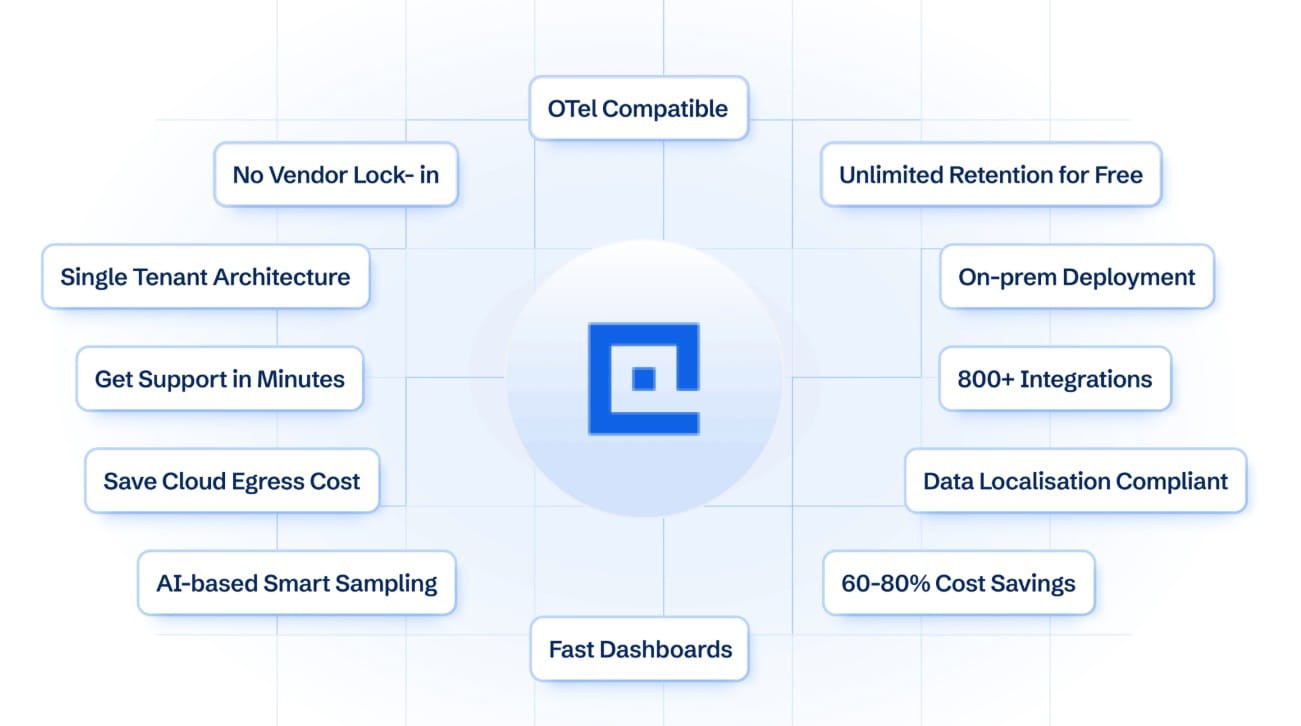
CubeAPM is known for its deep OpenTelemetry-native integrations and purpose-built support for messaging systems like RabbitMQ. It goes beyond generic observability by offering direct ingestion of RabbitMQ metrics, correlation with application traces, and ready-to-use dashboards that help teams catch queue backlogs or consumer issues before they impact critical workloads.
RabbitMQ Monitoring Features
- Direct integration with the RabbitMQ Management API and Prometheus plugin
- Prebuilt dashboards for queue depth, publish/deliver/ack rates, consumer counts, and connection health
- Correlation of RabbitMQ metrics with application traces and logs to pinpoint root causes
- Support for Amazon MQ for RabbitMQ without relying on costly CloudWatch metrics
- Alert templates for backlogs, consumer crashes, and connection/channel exhaustion
Key Features
- Unified metrics, logs, and traces in one backend
- OpenTelemetry Collector support with 800+ integrations
- Compliance-ready for enterprise standards (GDPR, HIPAA, DPDP)
Pros
- RabbitMQ-specific dashboards and alerts
- Transparent pricing per GB ingested
- Works equally well with self-managed RabbitMQ or Amazon MQ
Cons
- Not suited for teams looking for off-prem solutions
- Strictly an observability platform and does not support cloud security management
Pricing
CubeAPM charges a flat $0.15/GB for all telemetry ingestion (metrics, logs, traces combined).
CubeAPM RabbitMQ Monitoring Pricing at Scale
*All pricing comparisons are calculated using standardized Small/Medium/Large team profiles defined in our internal benchmarking sheet, based on fixed log, metrics, trace, and retention assumptions. Actual pricing may vary by usage, region, and plan structure. Please confirm current pricing with each vendor.
For a mid-sized SaaS company ingesting 45TB(~45,000) total monthly data ingestion and 45,000TB of observability data outcharged by the cloud provider, the total cost will be about ~$7200/month.
Tech Fit
CubeAPM is ideal for organizations that run high-volume RabbitMQ clusters and want monitoring that is both RabbitMQ-aware and application-aware. It is particularly well-suited for teams that need real-time visibility into queue behavior, fast root-cause analysis across services, and predictable costs at scale without worrying about hidden fees or complex billing models.
2. Grafana Cloud
Known for
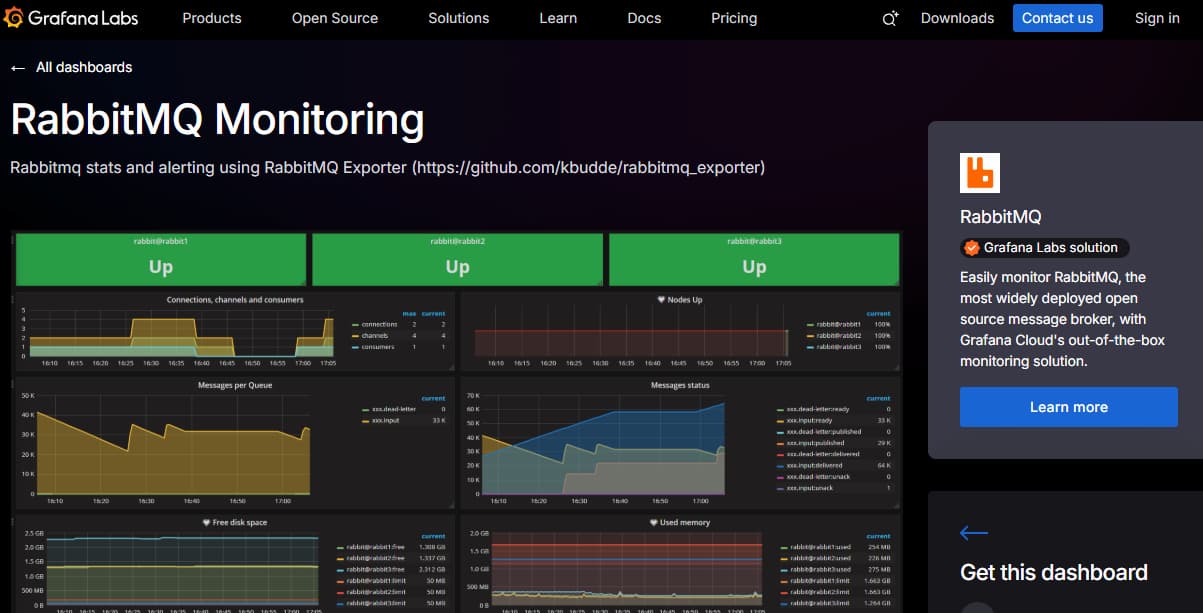
Grafana Cloud is known for its LGTM stack (Loki for logs, Grafana for visualization, Tempo for traces, Mimir for metrics) and strong alignment with the open-source monitoring ecosystem. It provides flexible dashboards and alerting with deep Prometheus and OpenTelemetry support, making it popular with teams that already rely on open-source observability.
RabbitMQ Monitoring Features
- Prometheus scraping via the RabbitMQ Prometheus plugin (rabbitmq_prometheus)
- Prebuilt Grafana dashboards for queue depth, publish/deliver rates, consumer counts, and node health
- Ability to combine RabbitMQ metrics with other signals (logs, traces, infra metrics) in one unified view
- Alerting through Grafana Alertmanager with support for RabbitMQ backlog and consumer drop thresholds
Key Features
- Native support for logs (Loki), traces (Tempo), and metrics (Mimir)
- Rich dashboarding and visualization capabilities
- Cloud-managed Prometheus with long-term storage
- Strong OpenTelemetry support for unified observability pipelines
Pros
- Strong open-source ecosystem alignment
- Flexible, customizable dashboards
- Good fit for teams already using Prometheus exporters
Cons
- Steeper learning curve for teams unfamiliar with Prometheus/Grafana stack
- Requires configuration work to set up alerts and dashboards optimally
Pricing
- Logs ingested: $0.50/GB
- Traces ingested: $0.50/GB
- Application observability (APM): $0.04/host-hour (Pro tier)
- Kubernetes monitoring: $0.015/host-hour + $0.001/container-hour
Grafana Cloud RabbitMQ Monitoring Pricing at Scale
For a mid-sized company operating 125 APM hosts, 200 infra hosts, 10TB(~10,000 GB) of ingested logs, and 45,000GB of observability data out(charged by cloud provider), the cost would come around ~$11,875/month.
Tech Fit
Grafana Cloud is best for engineering teams already invested in Prometheus and Grafana who want to offload infrastructure management while keeping the flexibility of open-source tools. It’s especially suited to organizations that need powerful visualization and alerting for RabbitMQ metrics in combination with logs and traces.
3. Datadog
Known for
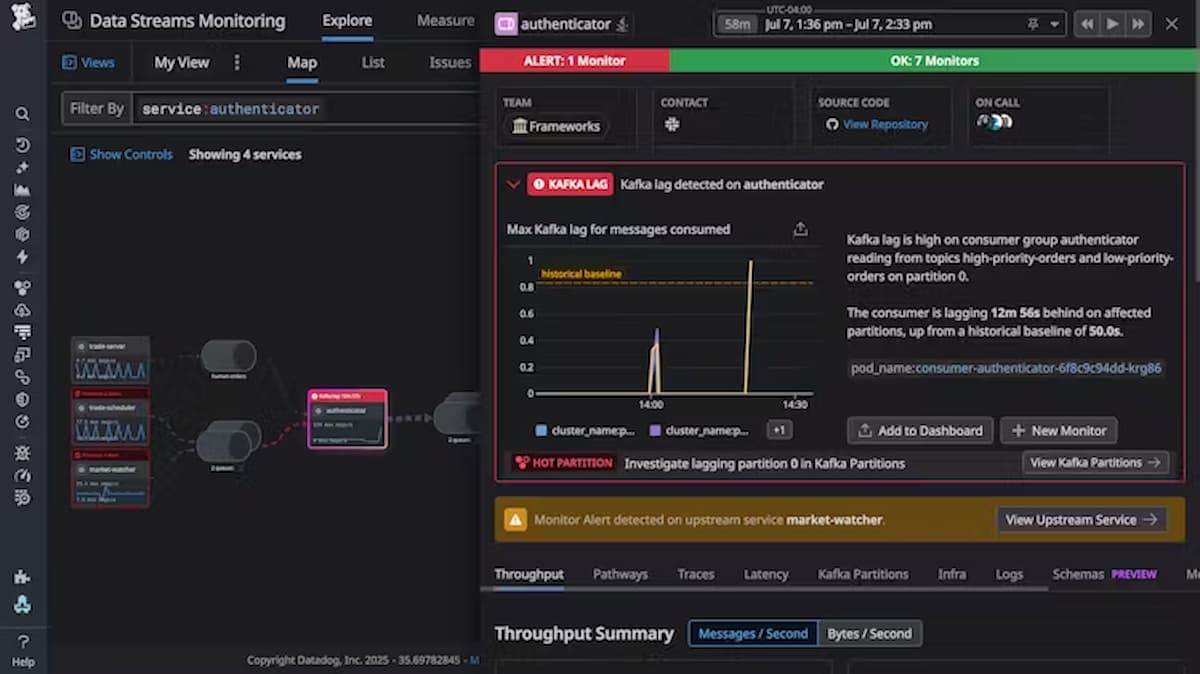
Datadog is a full-stack observability platform widely adopted for its broad integration ecosystem (900+ services), polished dashboards, and ability to unify infrastructure, APM, logs, and security monitoring in one SaaS product. It’s often chosen by teams looking for fast onboarding and deep coverage across multiple technologies.
RabbitMQ Monitoring Features
- Native RabbitMQ integration that collects metrics from the Management API and Prometheus plugin
- Prebuilt dashboards showing queue depth, publish/deliver rates, consumers, and node health
- Alerting rules for queue backlogs, consumer drops, and unroutable messages
- Correlation with APM traces and logs to connect broker performance with application slowdowns
Key Features
- Infrastructure monitoring, APM, logs, RUM, synthetics, and security monitoring
- 900+ one-click integrations with cloud services and databases
- Advanced anomaly detection and forecasting for message rate patterns
Pros
- Very mature integration ecosystem
- Polished dashboards and alerting content
- Strong support for hybrid and cloud-native environments
Cons
- Pricing grows steeply with an increase in data volume
- Overwhelming UI for new users
Pricing
- APM Enterprise: $40 per host/month
- Log Management (Ingest): $0.10 per GB/month
- Error Tracking: $25 per 50,000 errors/month
- Infrastructure Monitoring: $23 per host/month
Datadog RabbitMQ Monitoring Pricing at Scale
For a mid-sized SaaS company operating 125 APM hosts, 40 profiled hosts, 100 profiled container hosts, 200 infrastructure hosts, 1.5 million container hours, 300,000 custom metrics, 500 million indexed spans, and 3,500 indexed logs, while ingesting approximately 10 TB (≈10,000 GB) of logs per month, the estimated monthly cost would be around $27,475.
Tech Fit
Datadog fits best for teams that want a SaaS-first platform with instant RabbitMQ visibility, extensive integrations, and strong dashboards out-of-the-box. It’s a solid choice for companies with diverse stacks, but less ideal for organizations with strict cost or data control requirements.
4. Elastic Observability

Known for
Elastic Observability is part of the Elastic Stack (Elasticsearch, Logstash, Kibana), long recognized for its powerful search, scalable dashboards, and flexible retention options. Many organizations adopt it because they already use Elastic for log analytics, and want to extend the same platform into infrastructure, APM, and RabbitMQ monitoring. With its new serverless offering, Elastic positions itself as a cost-optimized observability solution that scales to terabytes of data while providing customizable monitoring for message brokers.
RabbitMQ Monitoring Features
- Native RabbitMQ integration with metrics collected from the Management API and logs via Filebeat/Metricbeat
- Prebuilt Kibana dashboards for queue depth, publish/deliver/ack rates, consumer counts, and node performance
- Alerting templates to detect backlogs, unroutable messages, and consumer crashes
- Ability to combine RabbitMQ data with infrastructure and application telemetry for unified analysis
Key Features
- Unified monitoring of logs, metrics, and traces in one Elastic Cloud or self-managed deployment
- Flexible storage tiers for short-term vs. long-term retention
- Rich Kibana visualizations and ad-hoc search for messaging telemetry
- OpenTelemetry ingestion support
Pros
- Low serverless ingest pricing compared to many SaaS competitors
- Mature dashboards and visualization capabilities
- Broad adoption and strong ecosystem support
Cons
- Expensive as usage grows
- Overwhelming UI for new users
- Complex initial setup
Pricing
- Logs ingest: $0.105/GB
- Traces/APM ingest: $0.150/GB
- Retention: $0.018–$0.020/GB-month
- Egress: 50GB free, then $0.05/GB
Elastic RabbitMQ Monitoring Pricing at Scale
For a mid-sized SaaS company with 125 APM hosts, 20TB of event ingestion per month, and 45,000GB of observability data (charged by the cloud provider), the cost would be around $17,435.
Tech Fit
Elastic Observability is best for teams already invested in the Elastic Stack who want to extend their existing workflows into RabbitMQ monitoring. It’s also a strong fit for organizations that need deep search, customizable dashboards, and granular control over ingest and retention, making it ideal for large-scale RabbitMQ clusters with diverse telemetry needs.
5. SigNoz
Known for
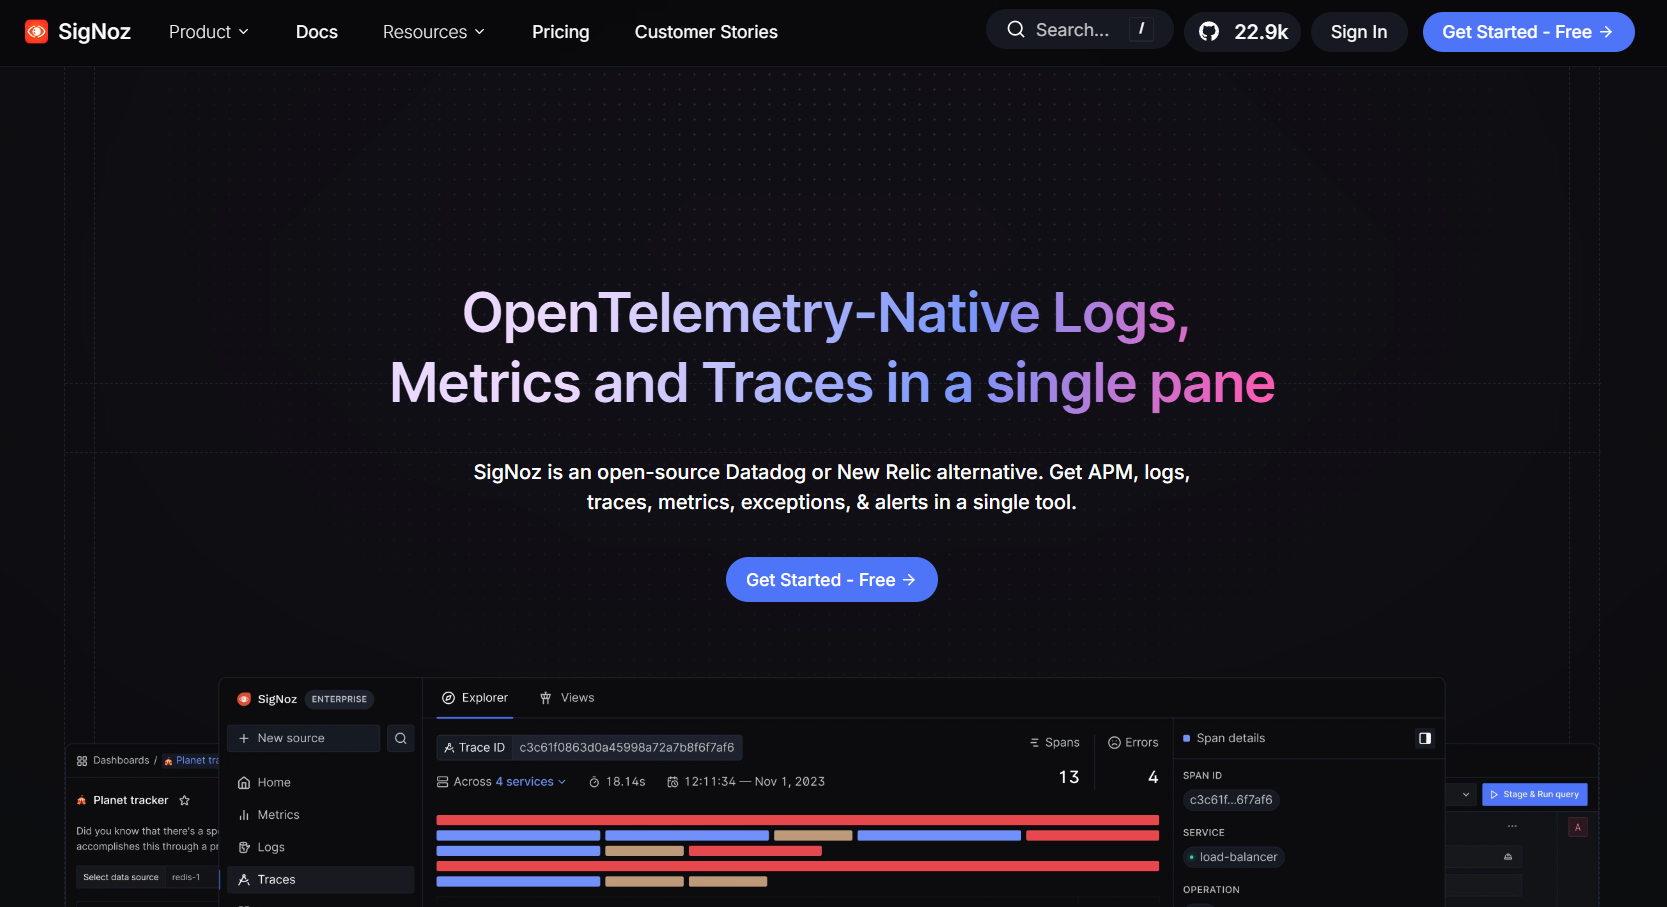
SigNoz is an open-source, OpenTelemetry-native observability platform built as a community-driven alternative to expensive SaaS tools. It’s recognized for providing developers with distributed tracing, metrics, and logs in one interface without vendor lock-in. Many teams choose it for RabbitMQ monitoring because it offers a ready-to-use RabbitMQ dashboard template powered by OTEL, making setup simple for both startups and mid-sized companies scaling their messaging workloads.
RabbitMQ Monitoring Features
- RabbitMQ dashboard template that surfaces queue depth, publish/deliver/ack rates, and consumer activity
- Powered by the OpenTelemetry RabbitMQ receiver, ensuring compatibility with modern telemetry pipelines
- Real-time alerting for consumer stalls, backlog growth, or node health issues
- Unified correlation of RabbitMQ metrics with application traces and logs
Key Features
- Logs, metrics, and traces in a single backend
- Hosted SaaS or fully self-hosted deployment options
- SOC2 and HIPAA compliance for the hosted platform
- Dashboard packs for popular frameworks and services
Pros
- Transparent, per-GB pricing that’s easy to calculate
- Strong OTEL-native alignment and flexibility to self-host
- Active open-source community driving features
Cons
- Managing ClickHouse memory usage is time-consuming
- Operational complexity, especially for managing the stacks
- The UI, while functional, might feel cluttered
Pricing
- Base plan: $49/month (includes credits)
- Logs ingest: $0.30/GB
- Traces ingest: $0.30/GB
- Metrics: $0.10 per million samples
SigNoz RabbitMQ Monitoring Pricing at Scale
For a mid-sized SaaS company that ingests 25,000GB of data by APM hosts, 10,000GB of data by infrastructure hosts, 10,000GB of data by log hosts, and 45,000GB of observability data (charged by the cloud provider), the cost would be approximately $16,000.
Tech Fit
SigNoz is a strong fit for developer-focused teams that want affordable RabbitMQ monitoring with full OTEL support. It’s ideal for startups and mid-sized companies that need flexibility to self-host or run on the cloud, value open-source transparency, and want a vendor-agnostic path for scaling RabbitMQ observability.
6. New Relic
Known for
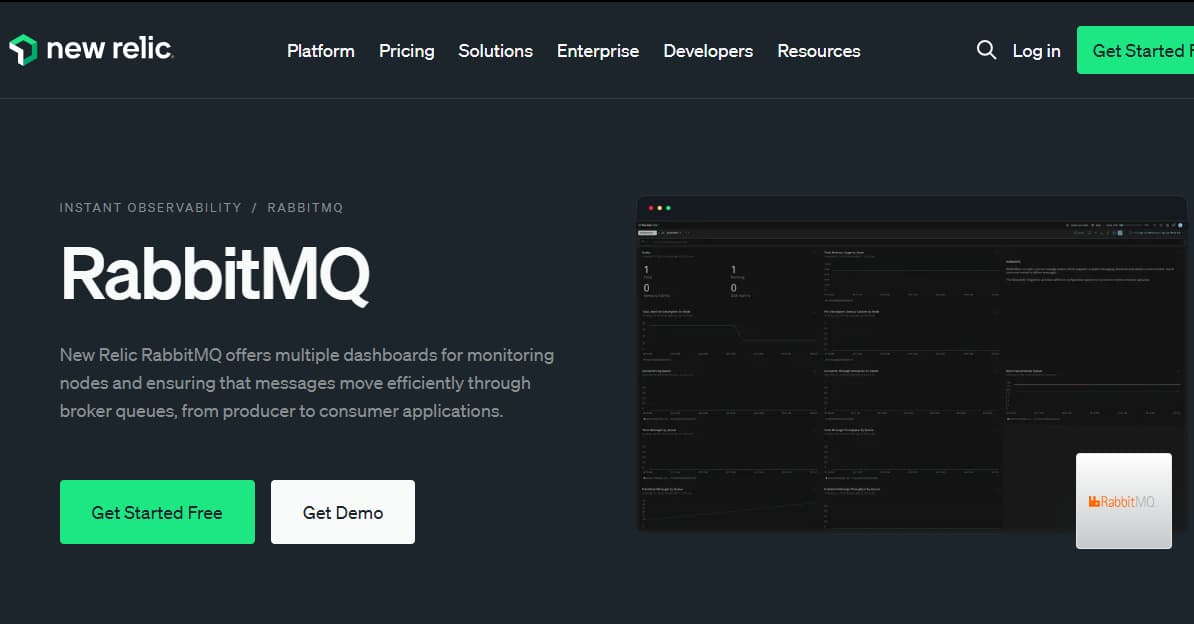
New Relic is known for its usage-based pricing model and a strong focus on developer experience. It provides curated dashboards, quickstarts, and integrations across infrastructure, APM, logs, and synthetics, with RabbitMQ monitoring included as part of its “Instant Observability” library.
RabbitMQ Monitoring Features
- On-host integration that pulls data from the RabbitMQ Management API
- Prebuilt dashboards for queue depth, message publish/deliver/ack counts, consumers, and nodes
- Alert conditions for backlogs, dropped consumers, and unroutable messages
- Ability to correlate RabbitMQ metrics with APM traces and logs for root-cause analysis
Key Features
- Unified observability with APM, infra monitoring, logs, browser and mobile RUM, synthetics
- Instant Observability hub and prebuilt dashboards
- Flexible role-based user licensing
Pros
- Easy to get started with the 100 GB free tier
- Wide integration library with curated RabbitMQ quickstarts
- Simple per-GB data pricing model
Cons
- Costs rise steeply with log-heavy or high-traffic workloads
- Limited flexibility in per-host RabbitMQ monitoring (one RabbitMQ server per host integration)
Pricing
- Free tier: 100GB/month of data ingested
- Data ingest: $0.40/GB after the 100 GB free tier
- Core users: $49 per user/month
New Relic RabbitMQ Monitoring Pricing at Scale
A mid-sized SaaS company ingesting 45TB (~45,000 GB) of telemetry data per month and with 10 full users, the cost would come around ~$25,990/month.
Tech Fit
New Relic is a strong fit for teams that want a single per-GB billing model and curated dashboards out-of-the-box. It works especially well for developers and product teams who value ease of setup, but it can become expensive for enterprises with heavy RabbitMQ traffic or verbose logging.
7. Better Stack
Known for
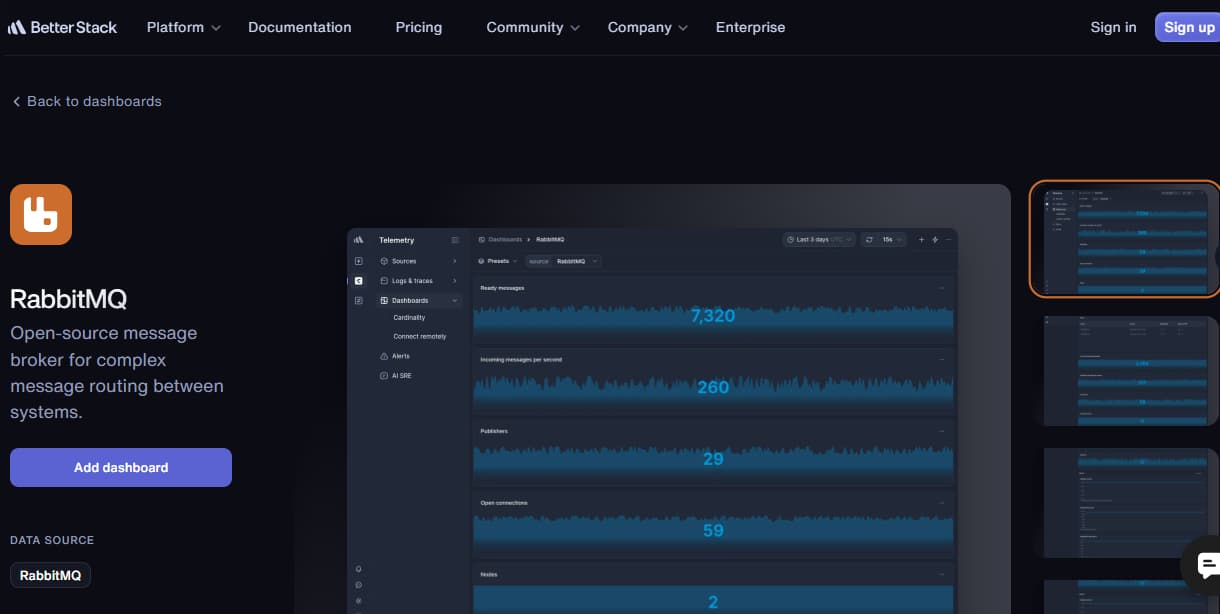
Better Stack is known for its modern, developer-friendly observability suite that combines logs, traces, metrics, uptime checks, and incident management into a single platform. It emphasizes a clean user interface and fast setup, making it attractive to engineering teams that don’t want the complexity of older enterprise monitoring tools. With a prebuilt RabbitMQ dashboard and integration guides, Better Stack provides a straightforward path to monitoring RabbitMQ without heavy overhead.
RabbitMQ Monitoring Features
- Prebuilt RabbitMQ dashboards for visualizing queue depth, consumer activity, and message throughput
- Guides for collecting RabbitMQ logs and metrics with agents like Vector
- Alerting options for detecting queue backlogs, consumer failures, and connection issues
- Ability to connect RabbitMQ telemetry with uptime and incident response tools on the same platform
Key Features
- Unified observability with logs, traces, metrics, uptime monitoring, and incidents
- SQL-like query language for fast log search and analytics
- Intuitive dashboards and alerting tailored for developers
- Integrations with popular DevOps tools for on-call and collaboration
Pros
- Easy onboarding with a clean UI
- Includes incident management and uptime checks out of the box
- Prebuilt RabbitMQ monitoring dashboards speed up setup
Cons
- Expensive when scaling operations.
- Users report missing features like outgoing webhooks that limit usability.
- Steep learning curve.
- Complex initial setup and configuration.
Pricing
Logs & Traces
- Included: 3GB/month retained for 3 days
- Extra ingestion: $0.45 per GB
- Retention: $0.025 per GB per week
- Single-tenant & host-your-own bucket: Enterprise options
- Base platform fee: $208/month
Better Stack RabbitMQ Monitoring Pricing at Scale
For a mid-sized SaaS company operating 125 APM hosts, ingesting 25TB(~25, OOOGB) of data by APM hosts, 10TB (~10,000GB) of logs, 10TB (~10,000GB) of infra hosts, and 45,000GB of observability data (charged by the cloud provider), the cost would come around $20,550/month.
Tech Fit
Better Stack is a great fit for SaaS startups and DevOps teams that want RabbitMQ monitoring tightly integrated with uptime checks, logging, and incident response in one tool. It’s especially appealing for teams that prioritize ease of use, clean dashboards, and bundle-style pricing over the complexity of larger enterprise observability platforms.
8. Dynatrace
Known for
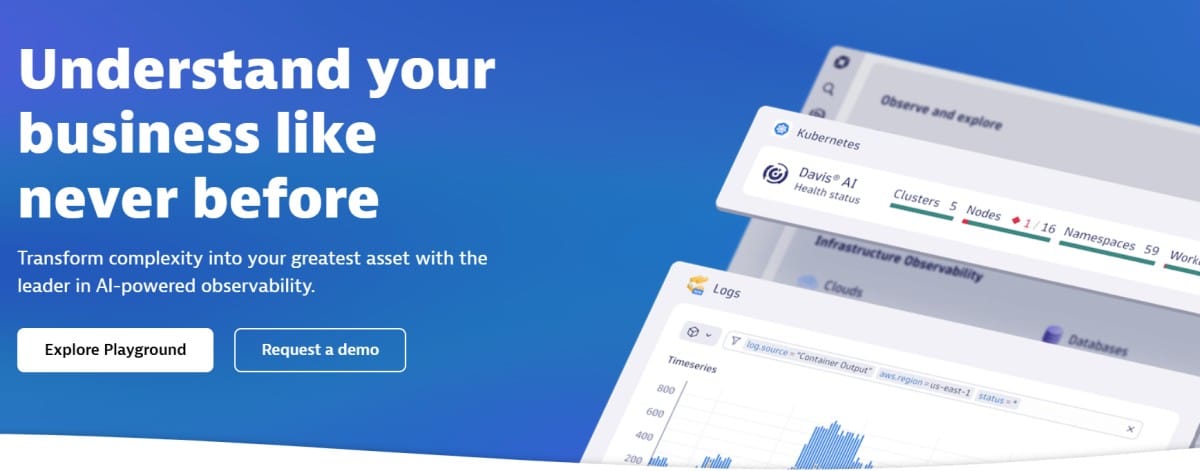
Dynatrace is known for its AI-driven observability and automation platform, powered by the Davis AI engine and its Grail data lakehouse. It provides detailed insights into applications, infrastructure, Kubernetes, and messaging systems like RabbitMQ, with an emphasis on automatic discovery and root-cause analysis.
RabbitMQ Monitoring Features
- Extension-based integration that collects metrics from the RabbitMQ Management API
- Prebuilt dashboards covering queue depth, publish/deliver/ack rates, consumer counts, and node availability
- Support for quorum queues, cluster replication health, and failover awareness
- Automatic baselining with Davis AI to detect anomalies in message throughput or consumer activity
Key Features
- Full-stack monitoring across infrastructure, applications, Kubernetes, and messaging systems
- Logs, metrics, and traces unified in Grail for long-term storage and fast querying
- Davis AI for automated anomaly detection and problem resolution
- Advanced dependency mapping for distributed systems
Pros
- Strong AI-powered anomaly detection and root-cause insights
- Transparent rate card with clear per-GB pricing for logs and traces
- Deep integration with Kubernetes and large-scale distributed systems
Cons
- High cost and complex licensing; pricing is rarely transparent
- Steep learning curve with advanced configuration needs
Pricing
- Infrastructure Monitoring: $29/mo/host
- Full-Stack Monitoring: $58/mo/8 GiB host
Dynatrace RabbitMQ Monitoring Pricing at Scale
A midsized SaaS company operating 125 APM hosts, 200 infra hosts, 10TB(~10,000 GB) of ingested logs, 300,000 custom metrics, 1,500,000 container hours, and 45,000GB of observability data out(charged by cloud provider), the cost would come around ~$21,850/month.
Tech Fit
Dynatrace is a great fit for large enterprises running RabbitMQ in complex, distributed environments that require automated anomaly detection, deep dependency mapping, and AI-driven root-cause analysis. It’s best suited for teams that value advanced intelligence over simple dashboards and are comfortable managing a more complex pricing model.
Conclusion
Monitoring RabbitMQ is essential to keep queues healthy, consumers responsive, and messages flowing reliably across distributed systems. While the native UI offers basic visibility, production workloads demand correlated observability across metrics, traces, and logs to quickly detect and resolve backlogs, consumer stalls, or connection issues.
The tools we’ve explored—ranging from CubeAPM’s RabbitMQ-specific dashboards and flat $0.15/GB pricing to enterprise options like Datadog, New Relic, Dynatrace, and Splunk, as well as flexible platforms like Grafana Cloud, Elastic, SigNoz, and Better Stack—show that no single approach fits every team. Each tool balances integration depth, cost model, and ease of use differently.
For organizations that want predictable costs and deep RabbitMQ visibility, CubeAPM stands out as the most efficient choice. Its direct RabbitMQ integrations, correlation across signals, and transparent pricing make it ideal for teams scaling message-driven systems.
Disclaimer: The information in this article reflects the latest details available at the time of publication and may change as technologies and products evolve.
FAQs
1. What metrics should I monitor in RabbitMQ?
Key RabbitMQ metrics include queue depth, publish/deliver/ack rates, consumer counts, connection and channel usage, and node health. Monitoring these helps detect backlogs, identify stalled consumers, and ensure the broker has enough resources to handle workloads.
2. How do I monitor RabbitMQ in Kubernetes?
The most common approach is to use the RabbitMQ Prometheus plugin (rabbitmq_prometheus) and scrape it with the OpenTelemetry Collector or Prometheus. Tools like CubeAPM can ingest this data, correlate it with application traces, and surface issues directly in dashboards for faster troubleshooting.
3. Can I use the RabbitMQ Management UI for production monitoring?
The Management UI is helpful for small clusters and debugging, but it doesn’t scale well. It lacks long-term data storage, correlation with traces/logs, and automated alerting. For production, it’s better to integrate with a dedicated observability tool.
4. How do I set up alerts for RabbitMQ backlogs?
A common practice is to alert when queue depth exceeds a threshold for a sustained period, or when publish rates exceed deliver rates. Tools like CubeAPM ship with ready-made alert templates for queue backlogs, consumer crashes, and connection limits, helping teams catch issues before they escalate.
5. What’s the best way to monitor RabbitMQ across multiple clusters?
Use a central observability backend that ingests telemetry from each cluster. With OpenTelemetry pipelines, you can route RabbitMQ metrics and logs from multiple environments into one system. Platforms like CubeAPM and Grafana Cloud simplify multi-cluster monitoring by unifying all RabbitMQ signals into consistent dashboards.


