OpenObserve (formerly ) is an open-source observability platform known for fast performance and efficient storage. It supports ingesting logs, metrics, and traces and offers built-in dashboards and search, and has both paid SaaS-based and self-hosting options for extended features.
However, users on Reddit have expressed concerns about OpenObserve’s features, such as RBAC and SSO, being gated behind the paid or enterprise tiers. It can also be costly at scale with separate pricing for RUM, error tracking, session relays, etc.
CubeAPM is the best OpenObserve alternative, with more cost-effectiveness as it’s priced at $0.15/GB for logs, metrics, traces, with no separate charges for RUM, synthetics, and error tracking. It’s smart sampling that further cuts down the cost. The platform is fully self-hosted to ensure compliance with regulations.
In this article, we’ll explore the top 7 OpenObserve alternatives, based on features, pricing, user reviews, and more.
Top 7 OpenObserve Alternatives
- CubeAPM
- Dynatrace
- Datadog
- New Relic
- Grafana
- Signoz
- Uptrace
Why People Are Looking for OpenObserve Alternatives
Despite its performance and cost advantages, OpenObserve presents several limitations that make it difficult to adopt for production-scale observability or compliance-heavy environments.
Not Fully Open Source
While OpenObserve promotes its open-source, self-hosted model as “free,” real-world deployments quickly incur costs, from object storage (e.g., S3), compute, and backups to ongoing SRE maintenance. Total cost of ownership can climb significantly beyond the 200 GB/day of ingestion.
If you choose the paid cloud version, data goes through their servers, which may not be suitable for compliance-focused organizations. Plus, there are separate charges, such as $0.30/GB for remote destinations, $0.10/GB for data processed, and $0.01/GB for query volume, $1/1k sessions for RUM and session replays, and $0.15/1K events for error tracking.
UI Issues
Despite its Rust-based speed and low-cost ingestion, many users report usability challenges with OpenObserve’s UI and dashboarding experience. On Reddit, developers describe the interface as difficult to navigate, making it hard to locate key fields during troubleshooting.
Setup Complexity
While OpenObserve is positioned as easy to deploy, user feedback suggests otherwise. Documentation is sparse and leans heavily on cloud-hosted usage. Community threads describe issues such as the absence of clear steps for ingesting files via syslog or setting up persistent storage. Admins may need to reverse-engineer configurations, which can delay rollouts.
Security Features Limitations
Security features, such as RBAC, SSO, and fine-grained access, are only available in paid plans, whether you choose SaaS or self-hosting deployment of OpenObserve. Keeping basic security controls in paid versions may create trust issues, as one Reddit user puts it.
Criteria for Selecting OpenObserve Alternatives
1. Native OpenTelemetry (OTEL) Support
OpenTelemetry is now the industry standard for telemetry collection. Alternatives must offer native OTEL support across metrics, logs, and traces to ensure interoperability, avoid vendor lock-in, and simplify instrumentation pipelines.
2. Full MELT Coverage
A complete observability solution should provide unified Metrics, Events, Logs, and Traces (MELT). This ensures that teams can debug incidents, monitor systems, and trace performance issues without switching tools or contexts.
3. Scalability & Performance at Volume
Alternatives must handle multi-terabyte/day ingestion, support long-term retention, and maintain low-latency search, even under peak load. This is crucial for teams running large-scale, distributed applications or microservices.
4. Smart Sampling & Cost Optimization
Advanced platforms should implement tail-based or contextual sampling to retain valuable traces while reducing storage costs. This ensures observability remains cost-efficient as data volumes grow.
5. Enterprise-Grade Security & Compliance
Features like SSO, RBAC, tenant isolation, audit logging, and data localization are essential for regulated sectors. Tools that support these out of the box reduce compliance risk and onboarding friction for larger organizations.
6. Transparent, Predictable Pricing
Pricing should be easy to estimate, without hidden costs. Ideal alternatives offer usage-based or transparent pricing and avoid surprise overages like those seen with ingestion-based or add-on-heavy models.
7. RUM, Synthetics & Frontend Monitoring
Modern observability demands visibility into the end-user experience. Platforms should support real user monitoring, synthetic checks, and performance metrics across browsers, APIs, and regions.
8. Support, SLAs & Deployment Flexibility
Look for tools that provide responsive support (Slack, email), SLA-backed reliability, and both cloud and on-prem deployment options. This ensures both operational confidence and deployment freedom.
OpenObserve Overview
Known for
OpenObserve is known as a high‑performance, open‑source observability platform that unifies logs, metrics, tracing, and frontend monitoring into a single solution. Built in Rust with a columnar storage backend and DataFusion query engine, it delivers petabyte‑scale ingestion that saves costs, making it ideal for large self‑hosted deployments.
Standout Features
- Fast Rust Architecture: Built in Rust and optimized with DataFusion for sub-second queries over petabyte datasets.
- Massive Cost Efficiency: Claims around 140× lower storage cost through high compression and efficient object storage use.
- Unified Observability: Combines logs, metrics, traces, and real‑user monitoring in one platform, reducing tool sprawl.
- Stateless, Scalable Design: Horizontal scaling via stateless nodes and decoupled compute & storage layers supports high availability and scale-out deployments.
Key Features
- Logs, Metrics & Traces Support: Ingest and query all three telemetry types through built‑in pipelines.
- Front-End Monitoring (RUM): Offers real-user session tracking, error capture, performance metrics, and session replay.
- Pipeline Enrichment: Supports ingestion pipelines that can redact, enrich, normalize, or transform events during ingestion.
- Flexible Storage Options: Supports S3, MinIO, GCS, Azure Blob, or local storage buckets with columnar Parquet backend.
- SQL & PromQL Query Support: Enables querying logs and traces with SQL, and metrics with SQL or PromQL.
- Dashboarding & Alerts: Built-in visualizations (19 chart types), dashboards, and alerting without external tools.
Pros
- Low telemetry storage costs
- Unified stack eliminates the need for separate tools like Prometheus, Loki, Jaeger, and Grafana
- Fast query performance even at petabyte scale thanks to Rust and DataFusion.
- Open-source with community support and full control over deployment and data.
Cons
- Limited enterprise-grade governance features such as fine-grained RBAC and SSO
- UI/UX can be overwhelming
- Setup complexity
Best for
Teams and technical leaders seeking a high-performance, cost-efficient observability solution who are comfortable managing self-hosted infrastructure and open-source tools. Best suited for startups through mid-size enterprises that prioritize ingestion efficiency and unified telemetry pipelines over managed services or packaged governance features.
Pricing & Customer Reviews
- Free: Open-source tool
- Standard Cloud: $0.30/GB
- RUM: $1/1K sessions
- Error tracking: $0.15/1K events
- Score: 15.9k stars on GitHub
Top 7 IBM Instana Alternatives
1. CubeAPM
Known for
CubeAPM is a next-gen OpenTelemetry-native observability platform engineered for deep MELT visibility, aggressive cost savings, and deployment flexibility. It’s especially known for empowering teams to retain high-fidelity telemetry at scale using smart sampling, while maintaining full control over data storage, retention, and compliance via on-prem, cloud, or BYOC models.
Standout Features
- Smart Sampling with Context Awareness: CubeAPM’s intelligent sampling retains traces based on error rates, latency, and span duration, ensuring that only meaningful data is stored while reducing costs by up to 80%.
- Plug-and-Play Agent Compatibility: Works out of the box with agents from Datadog, New Relic, Prometheus, and Elastic, eliminating migration friction.
- Instant Deployability: CubeAPM can be live within 60 minutes—no custom instrumentation or SDK boilerplate needed.
- Slack-First Support Model: Includes direct messaging with core engineers via Slack or WhatsApp, achieving sub-5-minute response times and dramatically reducing MTTR.
Key Features
- Comprehensive MELT Support: Unified observability across Metrics, Events, Logs, Traces, Real User Monitoring (RUM), synthetics, and error tracking from a single dashboard.
- Native OTEL Compliance: Built 100% on OpenTelemetry with support for OTLP ingestion across all signal types—logs, traces, metrics—standardizing telemetry across services.
- Usage-Based Pricing & Cost Controls: Transparent pricing with no per-seat, per-module, or per-host billing. Teams pay only for what they ingest, starting at $0.01–$0.15/GB.
- Flexible Hosting & Compliance: Deploy CubeAPM in SaaS, on-premises, or air-gapped VPCs with data localization and regulatory compliance (HIPAA, GDPR, RBI).
- Real-Time Dashboards & Alerts: Auto-generated dashboards for Kubernetes, infra, databases, and apps, plus Slack/PagerDuty/webhook alerting for incident response.
- Enterprise Readiness: Includes SSO, RBAC, audit trails, and tenant isolation for secure access and cross-team collaboration.
Pros
- 800+ integrations and ready compatibility with existing tools
- Zero egress charges
- Fully OTEL-native with zero vendor lock-in
- Ultra-fast support and onboarding with Slack-native dev access
- No hidden pricing—predictable ingestion-based cost model
- Smart sampling drastically reduces data volumes without visibility loss
- Suitable for regulated industries via BYOC/on-prem options
Cons
- Not suited for teams looking for off-prem solutions
- Strictly an observability platform, and does not support cloud security management
Best for
CubeAPM is an ideal fit for DevOps, platform, and SRE teams operating microservices-based applications on Kubernetes or hybrid infrastructure. It particularly benefits organizations looking for full MELT observability, high sampling efficiency, transparent pricing, and strict compliance control, all without compromising performance or flexibility.
Pricing & Customer Reviews
- Pricing: Starts at $0.15/GB (includes infra, logs, traces, synthetics, RUM, and error tracking)
- G2 Score: 4.7/5
- Praised for: Transparent pricing, easy onboarding, and industry-best Slack-based support
CubeAPM vs OpenObserve
While OpenObserve delivers cost-effective ingestion and a fast Rust-based backend, CubeAPM goes further by offering true enterprise observability—complete MELT coverage, native OTEL support, real user monitoring, and deep sampling control. It also includes real-time support and predictable usage-based pricing with no ops overhead.
2. Dynatrace
Known for
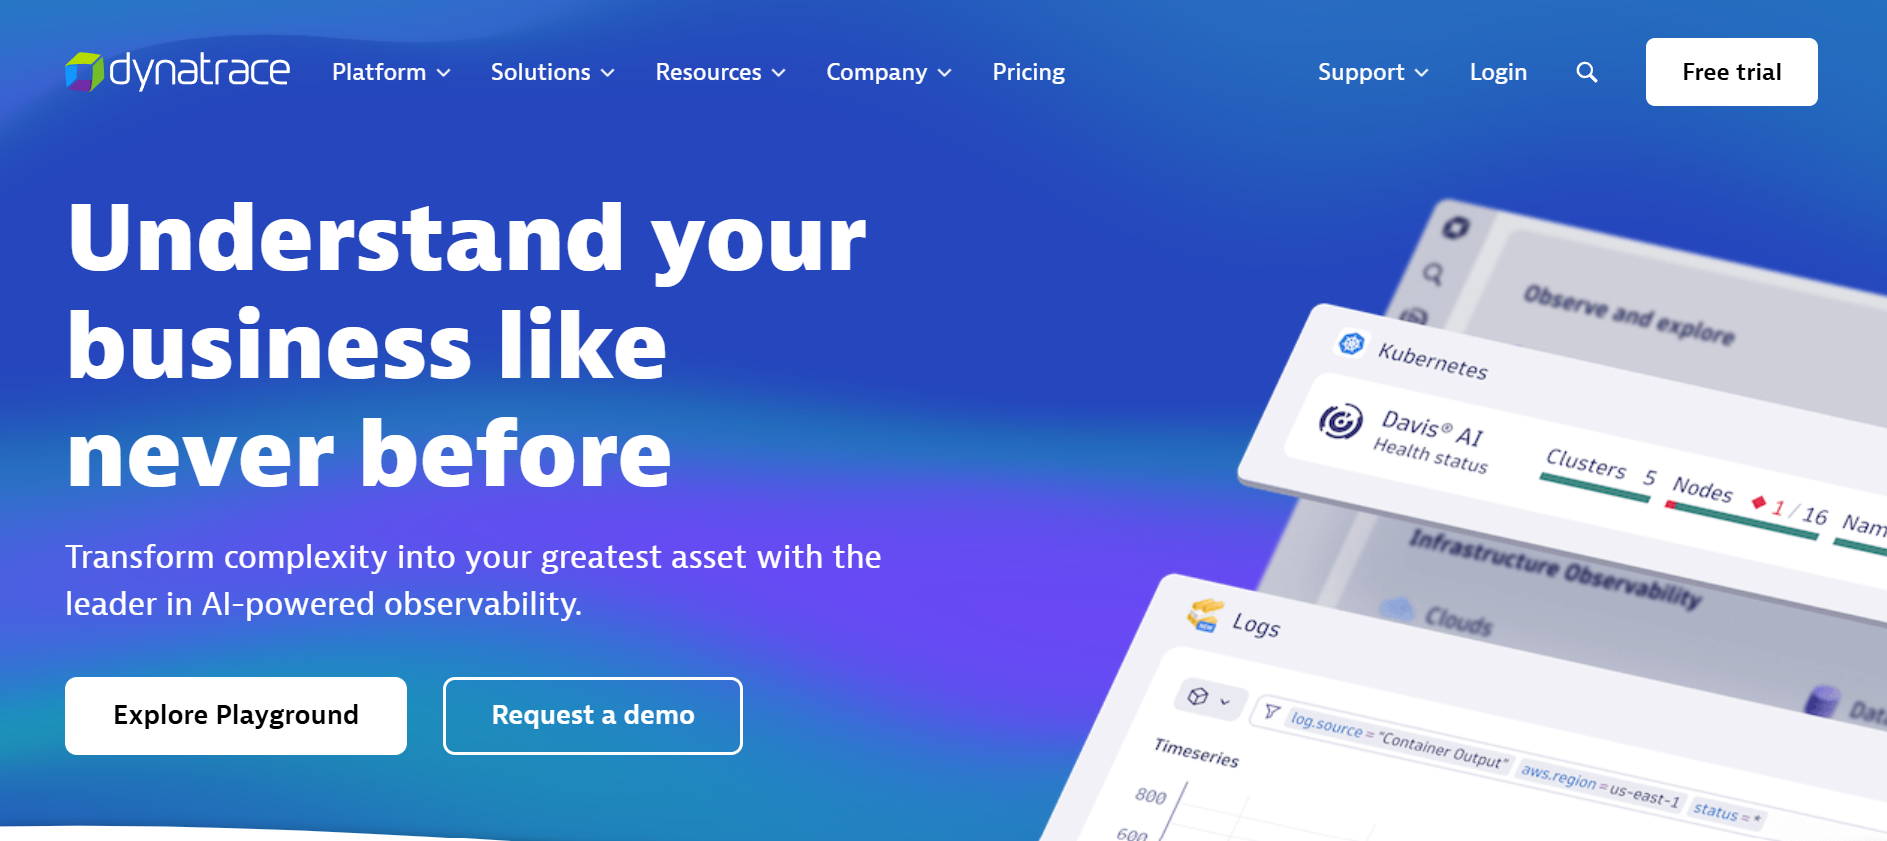
Dynatrace is a premium enterprise observability and application security platform known for unifying MELT telemetry and AI-driven automation in one interface. Its real differentiator is the Davis AI engine, which continuously processes billions of signals to detect incidents, link service dependencies, and identify root causes—all without manual rule-setting or tagging. For enterprises with massive infrastructure footprints or SLAs around uptime, Dynatrace offers unmatched automation and deep insight.
Standout Features
- Smartscape Topology Mapping: Dynamically visualizes service flows, infrastructure relationships, and application dependencies in real time, enabling teams to troubleshoot with full system context.
- Davis AI Root Cause Engine: Uses AI models to correlate anomalies across logs, metrics, traces, and user data, filtering out noise and identifying the true source of an issue within seconds.
- Embedded Runtime Security: Offers built-in RASP (runtime application self-protection) to detect exploits, code-level vulnerabilities, and insecure configurations without needing separate agents.
- Integrated RUM + Synthetics: Combines synthetic transaction tests with live user session monitoring to map end-user experiences to backend issues in a unified stream.
Key Features
- Unified MELT Stack: Provides metrics, logs, events, traces, RUM, and synthetic checks in one platform with shared metadata and context for every telemetry type.
- Agentless Auto-Instrumentation: OneAgent auto-discovers services, APIs, and dependencies without requiring manual configuration or code annotations.
- Real-Time Service Correlation: Offers end-to-end visibility by tracing frontend errors back to specific backend methods, services, or cloud infrastructure.
- Native Kubernetes & Cloud Visibility: Deep integration with public cloud providers and container orchestration platforms, including pod-level metrics, deployment tracing, and node health.
- Built-in Application Security: Observability isn’t just about uptime—Dynatrace monitors app-level vulnerabilities in real time, merging DevSecOps into traditional APM workflows.
- Enterprise Scalability: Designed for hybrid and multicloud infrastructure, with support for auto-scaling agents, large data volumes, and centralized policy enforcement.
Pros
- Best-in-class AI-driven root cause detection with Davis
- Auto-instrumentation across cloud-native, legacy, and containerized services
- Merges observability and application security in one pane of glass
- Intuitive Smartscape maps simplify navigating service-level incidents
- Comprehensive MELT visibility without stitching tools together
Cons
- Expensive at scale
- Steep learning curve
Best for
Dynatrace is best suited for large-scale enterprises, operations teams, and platform engineering groups managing mission-critical systems across multicloud or hybrid environments. It is especially valuable when teams require zero-touch instrumentation, real-time AI-powered incident triage, and combined performance and security observability—all from a centralized, automated platform.
Pricing & Customer Reviews
- Full-Stack Monitoring: $0.08 per 8 GiB host/hour
- Infrastructure Monitoring: $0.04/hour per host
- Kubernetes Monitoring: $0.002/hour per pod
- RUM: $0.00225 per session
- Synthetic Monitoring: $0.001 per HTTP test
- App Security Module: $0.018/hour per 8 GiB host
- G2 Rating: 4.5/5 (based on 1,300+ reviews)
- Praised for: Powerful AI insights, seamless automation, and broad hybrid infrastructure support
- Criticized for: High pricing model
Dynatrace vs OpenObserve
While OpenObserve appeals to engineering teams seeking self-hosted, cost-efficient ingestion pipelines, Dynatrace is purpose-built for enterprise-grade automation and security. Its AI-assisted diagnostics, live topology mapping, and unified performance + security telemetry are more mature, but at the cost of high pricing.
3. Datadog
Known for
Datadog is a leading cloud-native observability and security platform built for modern, fast-scaling teams. With unified coverage across infrastructure, backend services, frontend experiences, and threat monitoring, it offers a consolidated view into system health across hybrid and multicloud environments. Its major appeal lies in its extensive integration network and seamless compatibility with platforms like AWS, GCP, Azure, Kubernetes, and CI/CD pipelines, making it a go-to for DevOps and SecOps teams alike.
Standout Features
- Massive Integration Library: With over 900 built-in integrations, Datadog allows plug-and-play connectivity with nearly every cloud service, database, runtime, and messaging queue—eliminating the need for custom setup in most environments.
- Collaborative Notebooks for RCA: These live documents let engineers correlate metrics, logs, and traces side-by-side, annotate root causes, and share incident context with cross-functional teams.
- Unified DevSecOps Stack: From posture scanning to workload protection and runtime threat detection, Datadog merges observability and security into a single platform.
- Real User Monitoring with Session Replay: Enables deep frontend analysis with session replays, helping frontend engineers debug performance issues with full visual context.
- Advanced Serverless Monitoring: Offers precise observability for AWS Lambda, Azure Functions, and GCP Cloud Functions—surfacing latency, cold starts, and errors with minimal overhead.
Key Features
- Full MELT Observability in One UI: Datadog correlates metrics, traces, logs, synthetics, RUM, and events across a shared schema for unified monitoring and analysis.
- Automatic Instrumentation for Core Languages: Installs lightweight agents for Java, Python, Node.js, Go, .NET, and more, offering fast telemetry capture without significant code changes.
- Cloud-Native Focus: Natively integrates with Kubernetes, AWS ECS, Lambda, Azure Monitor, and GCP Stackdriver—ideal for dynamic, containerized workloads.
- Integrated Security Telemetry: Brings container vulnerability scans, compliance checks, and runtime threat insights into the same workflows as performance monitoring.
- CI/CD-Aware Dashboards: Tracks deployments in real time, tying regressions or errors directly to commit hashes, builds, or pull requests.
- Customizable Dashboards & Widgets: Offers drag-and-drop widgets, real-time health indicators, and team-specific views tailored to different workflows.
Pros
- Extensive out-of-the-box integrations drastically reduce setup time
- Includes observability with security into a single control plane
- RCA tooling like Notebooks enables collaborative, structured debugging
- Deep support for Kubernetes, serverless, and multicloud infrastructure
- ML-powered anomaly detection helps minimize alert noise
Cons
- Costly at scale
- No self-hosted option available
Best for
Datadog is best for high-growth teams running microservices, containers, or serverless workloads across AWS, GCP, or Azure. Its observability + security convergence makes it ideal for DevOps and SecOps collaboration, and its real-time dashboards, CI/CD awareness, and massive integration catalog help fast-moving teams operate with confidence.
Pricing & Customer Reviews
- Infrastructure Monitoring: $15–$34 per host/month
- APM: $31–$40 per host/month (annual); $36 on-demand
- Logs: $0.10/GB ingestion + $1.70M events (for 15-day retention)
- Serverless: $10 per million invocations
- Security Tools: $15–$40 per user/month
- G2 Rating: 4.4/5 (based on 630+ reviews)
- Praised for: Extensive integrations, powerful visualizations, deep coverage across telemetry layers
- Criticized for: Cost, no on-prem deployment
Datadog vs OpenObserve
Datadog brings powerful features and AI-enhanced visibility to the table, especially for teams operating across cloud-native stacks. But compared to OpenObserve, which offers affordable ingestion and flexible self-hosting, Datadog’s ingestion-based pricing can quickly scale.
4. New Relic
Known for
New Relic is a modern SaaS-based observability platform optimized for developers and SREs working in microservices-driven architectures. It offers full-stack MELT telemetry, flexible visualization tools, and precision querying via its proprietary NRQL language. Designed to make telemetry exploration intuitive, it excels at delivering tailored dashboards, real-time anomaly insights, and fast onboarding through native cloud integrations.
Standout Features
- Explorer View for System Mapping: Automatically builds visual topologies of services, hosts, containers, and upstream/downstream relationships—ideal for debugging distributed environments.
- NRQL-Powered Data Analysis: Teams can slice telemetry streams in real time using the New Relic Query Language to generate interactive charts and apply custom logic across metrics, logs, and traces.
- Lookout Anomaly Detection Engine: Uses machine learning baselines to highlight statistically significant anomalies in throughput, latency, and error rates, reducing noise while accelerating detection.
- Highly Customizable Dashboards: Offers an advanced layout engine and reusable widget components that empower teams to build role-specific views and executive-level summaries.
Key Features
- Unified MELT Telemetry Pipeline: Consolidates metrics, traces, logs, events, RUM, and synthetics in one platform with shared context and correlation capabilities.
- Agent-Based Auto-Instrumentation: Supports multiple languages, including Java, Python, Ruby, Node.js, Go, and .NET, providing one-click setup across backend services.
- Cloud & CI/CD Ecosystem Support: Natively connects with AWS, Azure, GCP, Kubernetes, Jenkins, and GitHub to tie performance data to deploy events and infrastructure.
- Real User & Synthetic Monitoring: Tracks user journeys alongside synthetic flows to capture performance trends, session issues, and regressions before users notice.
- AI-Driven Behavior Modeling: Dynamically learns system baselines to reduce false positives in alerting and improve confidence in anomaly signals.
- Instant SaaS Onboarding: Gets teams live within minutes of agent installation, providing dashboards and correlated insights with minimal infrastructure changes.
Pros
- Powerful NRQL-based querying enables granular telemetry analysis
- Rich dashboard customization supports multi-team and leadership reporting
- Streamlined SaaS interface with fast time-to-value and minimal setup
- Auto-discovery maps simplify navigation across services and dependencies
- Broad integrations with cloud providers and CI/CD tools enhance release visibility
Cons
- No option for self-hosting, SaaS-only
- Complex pricing based on ingestion, user roles, and add-ons
Best for
New Relic is a strong fit for SaaS-first organizations, platform engineering teams, and DevOps pipelines seeking precision observability with minimal setup. Its NRQL-powered querying, customizable dashboards, and CI/CD integrations make it ideal for teams who need rich telemetry analysis during deploy cycles or in production troubleshooting, but who are comfortable with a cloud-only model and per-user pricing.
Pricing & Customer Reviews
- Free Tier: 100 GB/month ingest, 1 core user
- Ingestion Cost: $0.40/GB depending on retention
- Core User Seats: $49/user/month
- Full Platform Users: $349/user/month, depending on access
- G2 Rating: 4.4/5 (500+ reviews)
- Praised for: Dashboard flexibility, powerful query engine, and fast SaaS onboarding
- Criticized for: Pricing, no self-hosted option
New Relic vs OpenObserve
Compared to OpenObserve, New Relic delivers a more polished SaaS experience with advanced querying and real-time visual telemetry. However, it lacks deployment flexibility, which OpenObserve offers for teams that prefer control over infrastructure. New Relic excels in CI/CD-aware observability and anomaly detection, but for cost-conscious teams with strict compliance needs, OpenObserve could be better.
5. Grafana

Known for
Grafana is a leading open-source observability platform favored for its flexibility, open standards support, and strong community ecosystem. It allows teams to build tailored dashboards and stitch together modular telemetry pipelines using Prometheus, Loki, and Tempo, offering an ideal foundation for those who prefer infrastructure observability on their terms.
Standout Features
- OTEL-Native Dashboarding Engine: Grafana provides native support for OpenTelemetry through integrations with Prometheus (metrics), Loki (logs), and Tempo (traces), enabling cross-signal correlation in customizable dashboards.
- Built-in Loki and Tempo Backends: These native log and tracing engines tightly integrate into the Grafana UI, allowing unified exploration across signals with minimal tooling overhead.
- Flexible Deployment Options: Grafana can be fully self-hosted, deployed via Grafana Enterprise, or consumed through Grafana Cloud, making it suitable for both regulated and elastic workloads.
- Advanced Alerting and OnCall Management: Its alerting system supports deduplication, silencing, routing policies, and integrates with OnCall for incident resolution, making it highly extensible for SRE workflows.
Key Features
- Rich Time-Series Visualization Engine: Grafana excels at plotting metrics with panels, heatmaps, gauges, and annotations, allowing teams to monitor patterns and anomalies over time.
- MELT Observability Stack Support: Integrates seamlessly with Prometheus (metrics), Loki (logs), and Tempo (traces), giving teams complete control over telemetry ingestion and analysis.
- Plugin and Dashboard Marketplace: Offers a growing library of prebuilt dashboards and data source plugins for tools like MySQL, Kubernetes, Kafka, AWS, and more.
- Deployment Model Versatility: From completely free OSS editions to Grafana Cloud and Enterprise plans, teams can choose their ideal deployment mode based on scale and support needs.
- Granular Role-Based Access Control (RBAC): Allows teams to enforce access restrictions and dashboard-level permissions based on team structure or organizational policy.
- Visual Alert Builder: Teams can define and route alerts to Slack, email, PagerDuty, or custom webhooks using a drag-and-drop UI and escalation trees.
Pros
- Free, open-source core with strong OTEL alignment
- Wide dashboard customization and plugin extensibility
- Flexible deployment options: OSS, Cloud, and Enterprise
- Native integration with Prometheus, Loki, and Tempo
- Large and active open-source community
Cons
- Complex set-up
- Tiered support in paid plans
Best for
Grafana is best suited for platform teams, DevOps engineers, and SREs who want full control over their observability stack using open standards. It’s a great fit for those comfortable managing Prometheus, Loki, and Tempo independently, and who prioritize visualization, deployment flexibility, and vendor neutrality over bundled automation or security analytics.
Pricing & Customer Reviews
- Grafana OSS: Free and fully self-managed
- Grafana Cloud Free Tier: 10,000 active series, 50 GB logs/month
- Pro Tier: Starts at $19/month
- Enterprise Tier: Custom pricing based on scale and support SLAs
- G2 Rating: 4.5/5 (130+ reviews)
- Praised for: Powerful visualizations, flexible deployment, and open-source community
- Criticized for: Limited out-of-the-box APM, manual scaling, and lack of automation/security features
Grafana vs OpenObserve
Grafana delivers unmatched dashboarding and visualization with deep OTEL-native integration and open-source flexibility, making it ideal for custom-built observability stacks. OpenObserve, on the other hand, offers lower operational overhead with built-in ingestion, UI, and query pipelines, albeit with less modularity. Teams choosing Grafana should be ready to manage Prometheus and Loki, while OpenObserve is better suited for those seeking a simpler all-in-one backend.
6. SigNoz
Known for
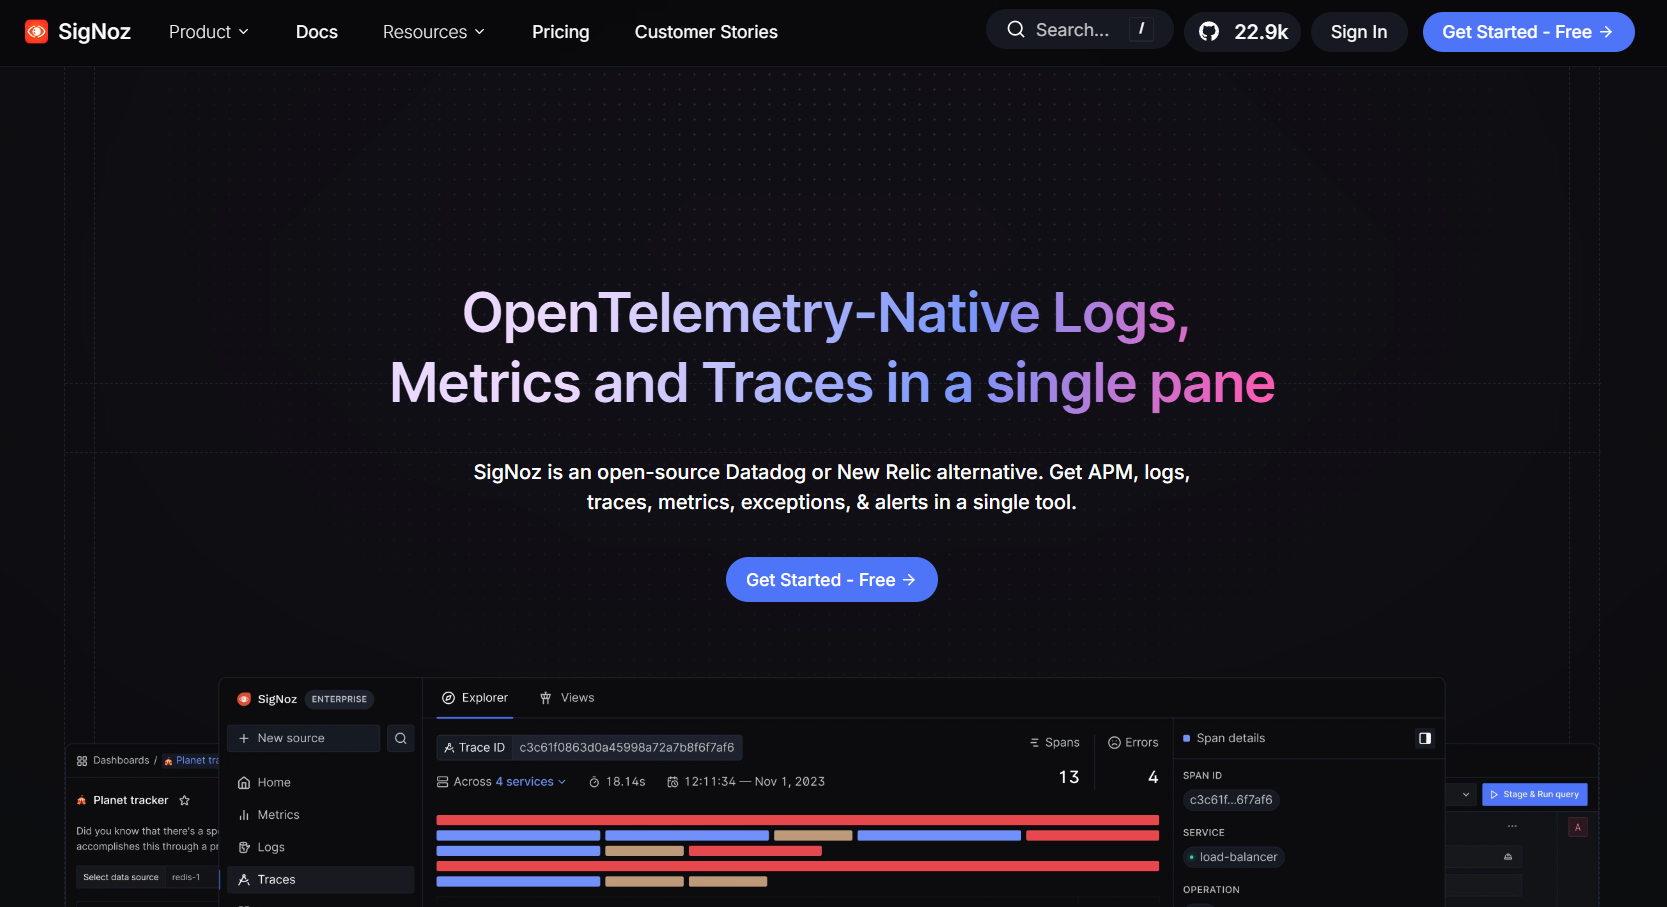
SigNoz is a developer-friendly, OpenTelemetry-native observability platform that combines logs, metrics, and traces in a unified interface backed by ClickHouse. It’s designed for teams looking to stay vendor-neutral while maintaining full control over telemetry data, and is increasingly adopted by companies that want usage-based billing without the complexity of proprietary agents or pricing traps.
Standout Features
- OTEL-First Architecture: Built ground-up to support OpenTelemetry’s data model and semantic conventions, SigNoz avoids proprietary wrappers, making instrumentation portable and easy to maintain.
- Unified ClickHouse Telemetry Store: Uses a single backend to house all telemetry signals, enabling fast queries and cross-signal correlation even with high-cardinality datasets.
- Usage-Based Transparent Pricing: Charges only based on data volume (logs, traces, metrics), rather than per host or user, ensuring cost predictability for scaling teams.
- Multi-Mode Deployment Flexibility: Offers a free OSS edition, managed SigNoz Cloud, and enterprise tiers for organizations with strict compliance or data control requirements.
Key Features
- Integrated MELT Observability: Supports logs, traces, metrics, alerts, and dashboards out-of-the-box, giving teams a single UI to monitor system health without stitching multiple tools together.
- Trace Funnels & Aggregate Insights: Allows filtering and statistical analysis of trace data (like p95 latency or error span trends) without ingesting every span.
- OTEL-Enhanced Log Correlation: Enables direct linking between logs and traces, so developers can debug incidents faster with full telemetry context.
- Open-Source Customizability: Teams can modify the platform, contribute features, or raise issues publicly, thanks to SigNoz’s fully transparent and community-driven approach.
- Prebuilt Dashboards & Latency Metrics: Auto-generates views with percentile-based latency, throughput, and error rate breakdowns to help spot bottlenecks instantly.
Pros
- OTEL-native design eliminates vendor lock-in
- Fully transparent pricing based on telemetry ingestion
- Efficient backend using ClickHouse for low-latency correlation
- Available as OSS, cloud, or enterprise deployment
- Active open-source community and extensible codebase
Cons
- Pre-built integrations and dashboards are gated behind paid plans
- Limited suppport features in paid plans
Best for
SigNoz is an excellent choice for modern engineering teams prioritizing OpenTelemetry adoption, transparent costs, and deployment flexibility. It fits organizations looking to self-manage or customize their observability stack while maintaining deep trace-log-metric correlation in a vendor-neutral format. Especially useful for Kubernetes-native teams comfortable managing ClickHouse and OTEL collectors.
Pricing & Customer Reviews
- Free Tier: Open-source edition available for self-hosted users
- SigNoz Cloud: Starts at $49/month with usage-based billing
- Telemetry Costs: Logs and traces at $0.30/GB; metrics at $0.10 per million samples
- G2 Rating: 4.6/5
- Praised for: Transparent pricing, ease of deployment, and OTEL-native support
- Criticized for: Limited features in free tier
SigNoz vs OpenObserve
While both SigNoz and OpenObserve appeal to teams looking for self-hosted, cost-conscious observability, SigNoz distinguishes itself with its OTEL-native architecture, ClickHouse backend, and better trace-log correlation. It also provides clearer cost modeling and more developer-friendly automation for percentile-based metrics.
7. Uptrace

Known for
Uptrace is an OpenTelemetry-first observability platform designed to deliver distributed tracing, metrics, and logs via a compact, scalable architecture. It’s praised for its developer-centric model, powerful telemetry insights, and the ability to monitor complex systems with minimal overhead while keeping operational costs low.
Standout Features
- OTEL-Compliant Observability Stack: Built natively around OpenTelemetry standards, Uptrace simplifies data collection and eliminates proprietary instrumentation incompatibilities.
- ClickHouse + PostgreSQL Backend: High-volume event storage and metadata audits are handled via ClickHouse and PostgreSQL, delivering fast query times and support for analytics at scale.
- Efficient Trace Processing: Capable of handling over 10K spans/sec on a single core with high compression, enabling enterprise-scale tracing at a fraction of the usual cost.
- Developer-Focused UI and Alerts: Offers SQL-style span querying, auto-generated dashboards, and notification workflows via email, Slack, or webhooks out of the box.
Key Features
- Unified Trace/Metrics/Log UI: A single interface supports MELT-level observability without stitching together multiple tools. Users can switch context seamlessly across spans, logs, and metrics.
- Gesture-Based Query Language: Uses PromQL-like syntax for metrics and SQL-like queries for spans, enabling rapid analysis and flexible data filtering.
- Auto-Generated Dashboards: Upon receiving telemetry, Uptrace auto-creates key panels showing service latency, error rates, and throughput patterns, enhancing time-to-insight.
- Scalable OSS Design: Suitable for self-hosting, Uptrace is fully open source and integrates easily with GitHub, Slack, Telegram, and other community channels for help and extensions.
- Broad Integration Support: Compatible with OTEL collector, Prometheus, FluentBit, CloudWatch, and Grafana as front-end display layer.
- Lightweight Installation: Runs on minimal infrastructure and delivers lower resource usage than alternatives like full-stack APMs.
Pros
- OpenTelemetry-first design ensures vendor neutrality
- Highly efficient backend with ClickHouse for trace/metric correlation
- Cost-effective; processes high throughput with low infrastructure requirements
- Auto-generated dashboards and alert workflows streamline deployment
- Community-driven, open-source flexibility and extensibility
Cons
- Lacks built-in RUM or synthetic monitoring features
- Self-hosted setup and upgrades may introduce operational overhaed
Best for
Uptrace is ideal for developers and DevOps teams embracing OpenTelemetry who need high-volume distributed tracing and log correlation on a budget. It’s particularly well-suited for organizations that prefer running observability on open infrastructure or private clouds and can manage ClickHouse and OTEL pipelines without enterprise-level managed services.
Pricing & Customer Reviews
- Free: up to 50GB or 5k timeseries per month
- Paid: Traces & logs at $0.08/GB, metrics at $0.001 per series
- ProductHunt Rating: 4.8/5
- Praised for: Seamless OpenTelemetry integration, exceptional ingestion efficiency, and fast insight generation.
- Criticized for: No RUM or synthetics
Uptrace vs OpenObserve
Uptrace and OpenObserve share a common open-source and OTEL-native philosophy. Uptrace offers stronger developer tooling, trace-query expressiveness, and higher compression efficiency through ClickHouse. OpenObserve aims for a minimal resource footprint and simplified log-based workflows.
Conclusion: Should You Consider Choosing OpenObserve?
OpenObserve is making strides as an open-source observability platform, offering fast ingestion, Rust-based performance, and low storage overhead. However, it comes with certain downsides, such as UI issues, setup complexity, and security features (RBAC and SSO) available only in the paid tiers.
CubeAPM steps in as the best OpenObserve alternative with better cost-efficiency at a simple $0.15/GB pricing and full self-hosting deployment to ensure compliance with regulations. This fully OTEL-native platform also offers smart sampling to further cut down costs, intelligent alerting, and other impressive features. Book a free demo with CubeAPM now.
Disclaimer: The information in this article reflects the latest details available at the time of publication and may change as technologies and products evolve.
FAQs
1. What are the best alternatives to OpenObserve?
The top OpenObserve alternatives include CubeAPM, Dynatrace, Datadog, New Relic, Grafana, SigNoz, and Uptrace. These tools offer more advanced features like smart sampling, RUM/synthetics, AI-driven diagnostics, full MELT support, and enterprise-grade security.
2. Why do companies look for OpenObserve alternatives?
Teams often seek alternatives due to OpenObserve’s limited features in the free tier, setup complexity, and UI issues.
3. How does CubeAPM compare to OpenObserve?
CubeAPM offers a complete self-hosted environment and better cost-efficiency at $0.15/GB than OpenObserve. CubeAPM is an OTEL-native observability solution with full MELT coverage, smart sampling, and real-time support via Slack or WhatsApp.
4. Is there a self-hosted alternative to OpenObserve with better support?
Yes, alternatives, like CubeAPM, offer self-hosted deployment options with more robust feature sets. CubeAPM, in particular, combines the benefits of open architecture with responsive support, advanced dashboarding, and compliance-friendly self-hosting.
5. Which OpenObserve alternative supports OpenTelemetry best?
CubeAPM is one of the best OTEL-native alternatives to OpenObserve, ingesting all logs, traces, and metrics. CubeAPM also adds smart sampling and enterprise integrations, making it a stronger fit for production-grade observability at scale.


