Mobile apps now drive most digital interactions, making performance and reliability essential for user retention. Even small delays or app crashes can drastically impact engagement, especially as teams adopt hybrid frameworks like Flutter and React Native to serve millions of users on iOS and Android.
As teams build for both iOS and Android, mobile architectures have become more complex, with widespread use of hybrid frameworks and heavy reliance on backend APIs and external services. Many performance issues originate outside the app itself, making crash-only monitoring insufficient and driving the need for deeper, end-to-end visibility across mobile and backend systems.
This guide reviews the leading mobile APM tools for iOS and Android. It compares how these platforms approach mobile performance monitoring, tracing, scalability, and pricing, helping engineering teams evaluate which tools best fit their architecture and operational needs.
What Are Mobile (iOS, Android) APM Tools?
Mobile Application Performance Monitoring (Mobile APM) tools are specialized observability solutions that help developers and SRE teams track how apps behave on real devices and networks. They collect telemetry such as app launch times, UI responsiveness, network latency, crashes, and energy consumption to ensure smooth, stable experiences across iOS and Android platforms.
Unlike traditional APM tools that focus primarily on backend services, mobile APM solutions provide visibility into the user’s device-level experience. They often combine Real User Monitoring (RUM), crash analytics, and distributed tracing to correlate frontend events (like screen transitions) with backend dependencies such as APIs or databases.
Modern tools like CubeAPM take this a step further by leveraging OpenTelemetry instrumentation to connect the full request path from mobile session to microservice and database query. This unified view helps teams pinpoint the exact root cause of slowdowns, whether it’s a heavy UI thread, a throttled API, or network congestion, leading to faster fixes and better user satisfaction.
Common Mobile APM Challenges Teams Run Into
Mobile APM challenges tend to surface once apps are used across real-world devices, networks, and OS versions rather than controlled test environments. Teams struggle with incomplete visibility due to intermittent connectivity, background execution limits, and aggressive OS-level throttling on both iOS and Android.
Crash reports and performance issues often lack sufficient context because sessions are fragmented across app launches, foreground and background states, and offline periods. High cardinality from device models, OS versions, and app builds further complicates analysis, while excessive instrumentation can negatively impact battery life and app startup time, forcing teams to balance observability depth against user experience.
Why Teams Look for the Right Mobile (iOS, Android) APM Tool
1. Play Store and App Store Performance Requirements
Google and Apple now factor performance into app visibility. High crash or ANR (App Not Responding) rates can directly lower app rankings or trigger warnings, pushing teams to adopt deeper, real-time performance monitoring.
2. On-Device Complexity and Energy Impact
Mobile APM must capture data beyond backend traces like battery usage, main thread performance, memory, and UI latency. Poor optimization here leads to faster battery drain and poor app reviews.
3. Inconsistent Instrumentation Across Platforms
OpenTelemetry SDK maturity differs between iOS and Android. Some tools lack full coverage for lifecycle events or crash contexts, creating blind spots across mixed frameworks like Flutter or React Native.
4. Sampling and Trace Visibility Challenges
Head-based sampling drops critical traces under high load, while tail-based sampling adds processing overhead. Teams need flexible sampling strategies to balance cost and visibility.
5. Cost Scaling Across Data Types
Many tools price logs, APM, RUM, and synthetics separately. As telemetry scales, unpredictable per-GB or per-user pricing becomes a financial pain point for mobile-heavy workloads.
6. Fragmented Observability Stack
Crash reporting, logs, metrics, and RUM are often managed across multiple tools, slowing down root-cause analysis and creating operational silos that impact release velocity.
What Mobile APM Looks Like at Scale
At scale, mobile APM focuses on understanding real user experience across thousands or millions of devices rather than individual sessions. Teams monitor app startup time, screen rendering latency, network request performance, crashes, and ANRs while correlating these signals with app versions, OS releases, and rollout phases.
Effective mobile APM systems stitch together fragmented sessions, handle delayed or batched telemetry from offline devices, and surface performance regressions tied to specific releases or device classes. As usage grows, the goal becomes identifying issues that affect meaningful user segments without overwhelming teams with noisy device-level data.
Top 8 Mobile (iOS, Android) Monitoring Tools
1. CubeAPM
Known For
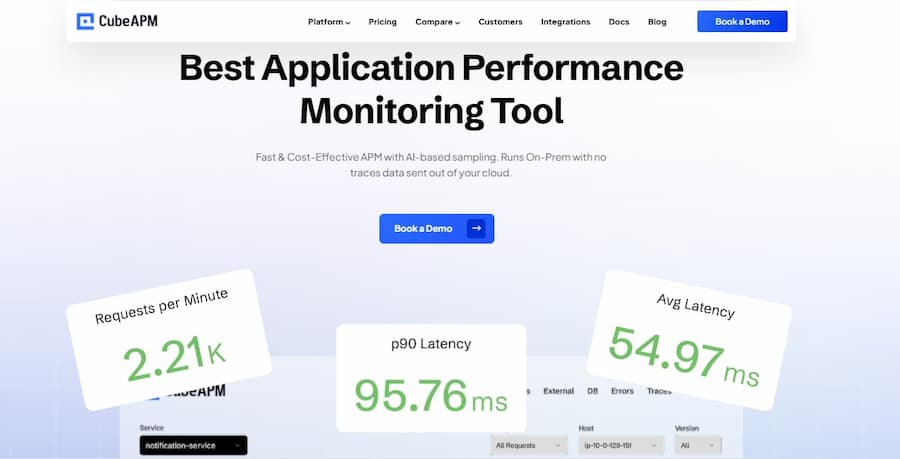
An OpenTelemetry-native observability platform built for modern, data-driven engineering teams. CubeAPM provides full-stack visibility across metrics, logs, traces, and user sessions covering everything from mobile SDK performance to backend microservices. It’s known for blending enterprise-grade APM depth with transparent, ingestion-based pricing and multi-agent support, making it a preferred choice for teams moving away from complex, host-based pricing models.
Mobile (iOS, Android) Monitoring Features
- Real-time crash and error tracking with stack traces.
- End-to-end distributed tracing from mobile device to backend.
- Real User Monitoring (RUM) for app sessions and screen transitions.
- Synthetic mobile transactions to test API reliability.
- Smart sampling for efficient data retention and cost optimization.
- On-device telemetry including UI delays, memory, and network latency.
Key Features
- Full-stack APM, infrastructure, log, and database monitoring.
- Native integrations for OpenTelemetry, Prometheus, and Datadog agents.
- Unlimited data retention with zero per-user or per-host charges.
- Bring-Your-Own-Cloud (BYOC) and self-hosting for data sovereignty.
- Instant Slack and WhatsApp support channels for faster incident response.
Pros
- Transparent pricing and high sampling efficiency.
- Unified MELT observability (Metrics, Events, Logs, Traces).
- Multi-agent compatibility and strong mobile SDK coverage.
- Low latency and compliant with data localization requirements.
Cons
- Not suited for teams looking for off-prem solutions
- Strictly an observability platform and does not support cloud security management
Pricing
- Data Ingestion: $0.15/GB
CubeAPM Mobile (iOS, Android) Application Monitoring Pricing at Scale
*All pricing comparisons are calculated using standardized Small/Medium/Large team profiles defined in our internal benchmarking sheet, based on fixed log, metrics, trace, and retention assumptions. Actual pricing may vary by usage, region, and plan structure. Please confirm current pricing with each vendor.
For a mid-sized SaaS company ingesting 45TB(~45,000) total monthly data ingestion and 45,000TB of observability data outcharged by the cloud provider, the total cost will be about ~$7200/month.
Tech Fit
The technology is best suited for DevOps, mobile, and SRE teams who require end-to-end visibility from mobile sessions to backend services without incurring unpredictable costs. CubeAPM is particularly strong for organizations adopting OpenTelemetry or hybrid monitoring setups, offering both BYOC and self-hosted options to meet compliance and latency needs while ensuring high data control at scale.
2. New Relic
Known For
New Relic is a well-established observability platform known for its comprehensive monitoring suite that covers APM, logs, infrastructure, and browser performance. It offers native mobile SDKs for iOS and Android, giving developers visibility into app performance, crashes, and network behavior. Known for its rich dashboards and detailed UI, New Relic remains a popular choice among enterprises that prefer a fully managed, cloud-hosted monitoring solution.
Mobile (iOS, Android) Monitoring Features
- Native SDKs for iOS, Android, and hybrid frameworks.
- Tracks app launch time, interaction latency, and crash frequency.
- Measures network request timing and external dependency latency.
- Correlates frontend user interactions with backend APM traces.
- Session-based insights with user journey visualization.
Key Features
- Full-stack observability with APM, infrastructure, logs, synthetics, and RUM.
- Custom dashboards and query-based analytics through NRQL.
- Distributed tracing across web and mobile services.
- Integration with AWS, Azure, GCP, and containerized workloads.
- Centralized alerting and anomaly detection.
Pros
- Mature ecosystem with extensive integrations.
- Excellent visualization and query tools.
- Offers generous free tier for small workloads.
- Real-time mobile and backend correlation.
Cons
- Expensive as usage grows
- High pricing for enterprise features and per-user licenses.
- Limited flexibility in data retention and hosting options.
Pricing
- Free Tier: 100 GB/month of data ingestion
- Logs: $0.40/GB beyond the free limit
- Full Platform Users: $418.80/user/month
- Additional costs for longer retention and premium data management.
New Relic Mobile (iOS, Android) Monitoring Pricing at Scale
*All pricing comparisons are calculated using standardized Small/Medium/Large team profiles defined in our internal benchmarking sheet, based on fixed log, metrics, trace, and retention assumptions. Actual pricing may vary by usage, region, and plan structure. Please confirm current pricing with each vendor.
A mid-sized SaaS company ingesting 45TB (~45,000 GB) of telemetry data per month and with 10 full users, the cost would come around ~$25,990/month.
Tech Fit
Best suited for large enterprises and SaaS teams that need an all-in-one hosted observability platform with polished UI analytics. It’s ideal for organizations already invested in New Relic’s ecosystem.
3. Embrace.io
Known For
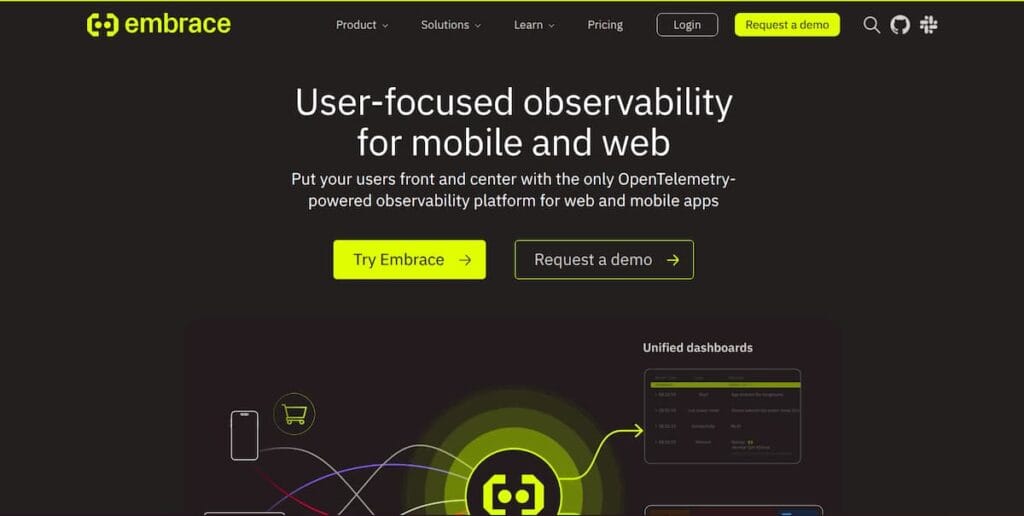
Embrace is a mobile-first observability platform purpose-built for iOS and Android apps, offering full user-session visibility and deep instrumentation for mobile-specific issues. It captures 100% of user sessions, tracking crashes, ANRs, network latency, and UI responsiveness, and ties them directly to user journeys and business outcomes. Known for its OpenTelemetry compatibility and session-based context, Embrace helps teams diagnose issues from the user’s perspective rather than just system metrics.
Mobile (iOS, Android) Monitoring Features
- Automatic crash, ANR, and UI hang detection for iOS and Android.
- Real User Monitoring (RUM) with complete session replay for user interactions.
- OpenTelemetry SDK support for forwarding spans, metrics, and logs.
- Deep network tracing that links device events with backend transactions.
- Expanding coverage to web applications for full user-journey visibility.
Key Features
- Session-centric monitoring captures device information, OS version, app version, and network context.
- Business KPI correlation enables the connection of performance issues with retention or conversion metrics.
- Smart alerting that prioritizes incidents by user and business impact.
- Open standards enable data portability, thereby preventing vendor lock-in.
Pros
- Purpose-built for mobile observability with richer device telemetry.
- Provides full context around user sessions and behavioral impact.
- Aligns engineering metrics with business and UX outcomes.
- Supports OpenTelemetry for flexible integrations.
Cons
- Expensive as usage grows
- Overwhelming UI especially for new users
Pricing
- Free Tier: Up to 1 million sessions per year with limited retention.
- Pro Tier: Starts around $0.80 per 100k sessions, with background sessions charged separately.
- Enterprise: Custom pricing for higher volumes and extended retention.
Embrace.io Mobile (iOS, Android) Monitoring Pricing at Scale
*The following estimate is based on Embrace’s published session-based pricing and models a mid-sized application with consistent monthly traffic. Actual costs may vary depending on how sessions are defined, background activity, platform behavior (web or mobile), and changes to pricing tiers over time.
Embrace follows a session-based pricing model, with a free tier covering up to 1 million sessions per year and paid usage starting at $0.80 per 1,000 sessions. At low volumes, costs remain modest, but they scale directly with user activity. An app generating around 3 million sessions per month would incur roughly $2,400 in monthly charges, while higher-traffic apps at 5 million sessions reach about $4,000 per month. In practice, background activity can increase billable sessions further, pushing costs higher as usage grows.
Tech Fit
Embrace is best suited for mobile engineering and product teams that need granular visibility into app behavior, user sessions, and device-level performance. It’s ideal for consumer-facing apps with large user bases that depend on real-time mobile telemetry to optimize UX, troubleshoot regressions, and connect performance with revenue and engagement metrics.
4. Splunk APM (Splunk Observability Cloud)
Known For
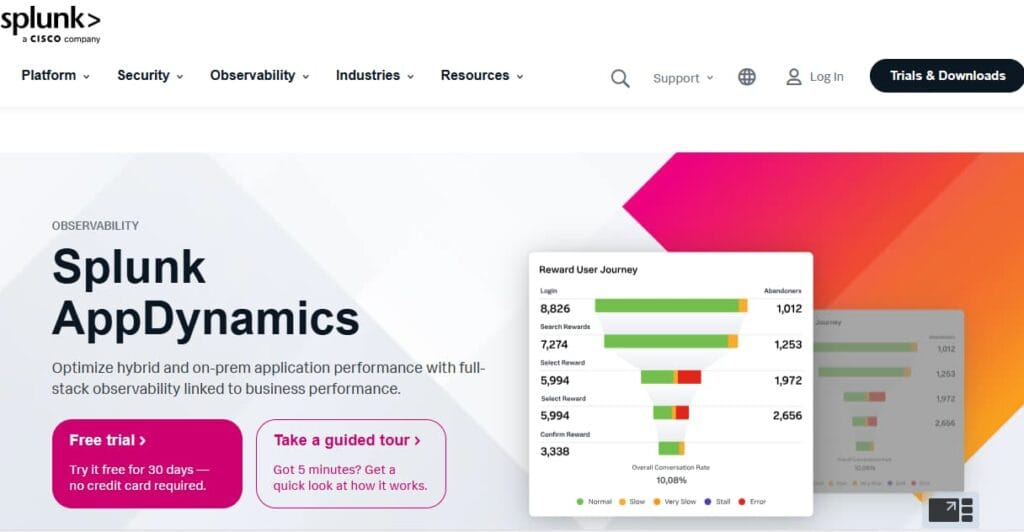
Splunk APM, originally built on SignalFx’s observability engine, is known for its real-time distributed tracing and metrics analytics across large-scale, microservice-based architectures. Now part of the Splunk Observability Cloud, it offers full-stack coverage—metrics, logs, and traces with powerful streaming analytics and AI-driven insights. It is widely used for backend systems that serve iOS and Android apps, providing complete visibility from device APIs to server performance.
Mobile (iOS, Android) Monitoring Features
- OpenTelemetry-based tracing that connects mobile spans to backend services.
- Synthetic transaction support to simulate mobile API requests and measure performance.
- Real User Monitoring (via Splunk RUM) to track frontend or mobile web performance.
- Correlation of mobile session errors with backend latency or database slowdowns.
- Integration with Splunk Log Observer for device and application log analysis.
Key Features
- NoSample™ tracing technology for 100% fidelity across distributed transactions.
- Real-time streaming metrics for sub-second visibility.
- AI-driven anomaly detection and predictive alerts.
- Deep integration with infrastructure, logs, and security observability.
- OpenTelemetry-native instrumentation for flexible deployment across services.
Pros
- Excellent scalability for high-volume, real-time telemetry.
- Fully OpenTelemetry compatible, making integration seamless.
- Unified Observability Cloud ties together APM, infrastructure, and logs.
- Ideal for backend-heavy, distributed applications supporting mobile clients.
Cons
- Users face billing issues with high renewal costs
- Pricing can grow quickly with ingestion-heavy workloads.
- Users experience an inefficient alert system that delays response time
Pricing
- AppDynamics APM: starts at $33/month/CPU core
- Infra Monitoring: starts at $6/month/CPU core
Splunk APM Mobile (iOS, Android) Monitoring Pricing at Scale
*All pricing comparisons are calculated using standardized Small/Medium/Large team profiles defined in our internal benchmarking sheet, based on fixed log, metrics, trace, and retention assumptions. Actual pricing may vary by usage, region, and plan structure. Please confirm current pricing with each vendor.
For a mid-sized SaaS company running 125 hosts and 45,000GB of observability data out (charged by the cloud provider), the cost will be around ~$8,625/month.
Tech Fit
Best suited for enterprises running large-scale microservices or API backends that power mobile applications. Splunk APM is ideal when teams prioritize real-time tracing, OpenTelemetry-native observability, and cross-domain correlation between infrastructure, logs, and app performance. It fits particularly well for organizations already invested in Splunk for log analytics or SIEM, looking to unify monitoring under one observability stack.
5. Dynatrace
Known For
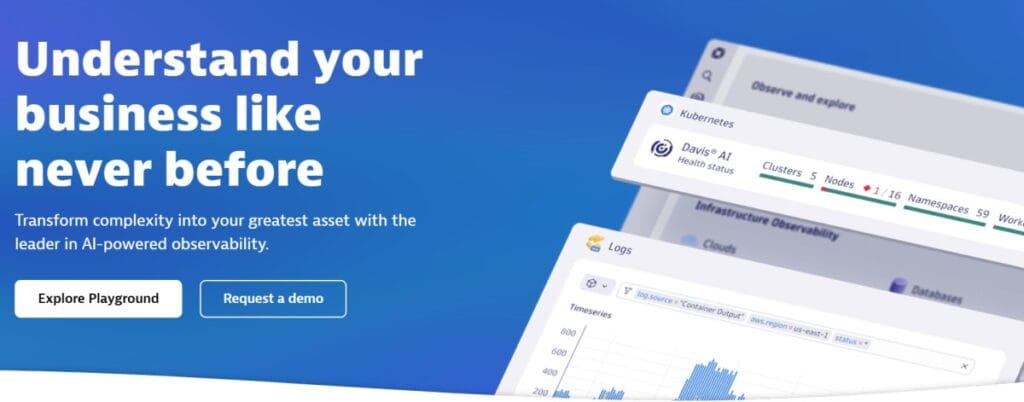
Dynatrace is an enterprise-grade observability platform recognized for its AI-driven automation, auto-discovery of dependencies, and full-stack performance monitoring. Powered by its Davis AI engine, Dynatrace delivers deep insights across applications, infrastructure, and digital experience. Large enterprises widely adopt it, seeking end-to-end observability from mobile user sessions to cloud workloads.
Mobile (iOS, Android) Monitoring Features
- OneAgent SDK for iOS, Android, React Native, Xamarin, and Cordova.
- Captures app start time, crashes, ANRs, UI latency, and user journeys.
- Monitors network requests and backend service dependencies automatically.
- Real User Monitoring (RUM) with session replays and regional performance analytics.
- Synthetic monitoring to simulate mobile interactions and measure global uptime.
Key Features
- Davis AI engine for real-time anomaly detection and root-cause analysis.
- Auto-discovery of services, dependencies, and cloud infrastructure.
- End-to-end tracing from mobile frontend to backend microservices.
- Smartscape topology mapping for real-time dependency visualization.
- Multi-cloud and container-native support for Kubernetes and OpenShift.
Pros
- Automated instrumentation and dependency detection with minimal setup.
- Advanced AI-assisted troubleshooting through Davis AI.
- Unified platform covering APM, infrastructure, RUM, logs, and synthetics.
- High scalability across large enterprise environments.
Cons
- Pricing can escalate rapidly with large-scale or hybrid deployments.
- Users find the learning curve steep, with difficulties in configuring automations
- Users find Dynatrace to be expensive, particularly when adding new features
Pricing
- Infrastructure Monitoring: $29/mo/host
- Full-Stack Monitoring: $58/mo/8 GiB host
Dynatrace Mobile (iOS, Android) Monitoring Pricing at Scale
*All pricing comparisons are calculated using standardised small/medium/large team profiles defined in our internal benchmarking sheet, based on fixed log, metrics, trace, and retention assumptions. Actual pricing may vary by usage, region, and plan structure. Please confirm current pricing with each vendor.
For a midsized SaaS company operating 125 APM hosts, 200 infra hosts, 10TB (~10,000 GB) of ingested logs, 300,000 custom metrics, 1,500,000 container hours, and 45,000 GB of observability data out (charged by the cloud provider), the cost would come to around ~$21,850/month.
Tech Fit
Best suited for large enterprises and DevOps organizations managing complex, cloud-native or hybrid architectures. Dynatrace is ideal when automation, AI-driven analytics, and deep end-to-end correlation matter most especially for teams that need to link mobile performance with backend service health at a global scale.
6. Datadog
Known For
Datadog is a leading observability platform known for its broad ecosystem of 900+ integrations, real-time analytics, and full-stack monitoring that spans infrastructure, APM, logs, and user experience. It provides native mobile SDKs for iOS and Android, enabling developers to track app performance, crashes, and network behavior alongside backend services. Datadog’s appeal lies in its unified dashboards and visualization power, making it a go-to choice for cloud-native and DevOps-driven teams.
Mobile (iOS, Android) Monitoring Features
- Mobile RUM SDKs for iOS, Android, React Native, and Flutter.
- Tracks app startup time, network latency, and crash events.
- Correlates frontend mobile sessions with backend APM traces.
- Supports error tracking, session replays, and device-level analytics.
- Synthetic monitoring for testing mobile API performance and uptime.
Key Features
- Unified observability platform covering APM, logs, infrastructure, and RUM.
- Advanced dashboards with drag-and-drop widgets for performance visualization.
- Machine learning–driven alerts for anomalies and latency spikes.
- Live network mapping and distributed tracing across microservices.
- Wide integration library (AWS, Kubernetes, GCP, Azure, CI/CD tools).
Pros
- Comprehensive ecosystem with end-to-end correlation.
- Strong visualization and alerting capabilities.
- Reliable SDKs and consistent performance tracking for mobile and web.
- Mature support for OpenTelemetry and multi-cloud environments.
Cons
- Costs increase as teams enable more Datadog products
- UI and configuration can feel complex at scale
Pricing
- APM (Pro Plan): $35/host/month
- Infra (Pro Plan): $15/host/month
- Ingested Logs: $0.10 per ingested or scanned GB per month
Datadog Mobile (iOS, Android) Monitoring Pricing at Scale
*All pricing comparisons are calculated using standardised small/medium/large team profiles defined in our internal benchmarking sheet, based on fixed log, metrics, trace, and retention assumptions. Actual pricing may vary by usage, region, and plan structure. Please confirm current pricing with each vendor.
For a mid-sized SaaS company operating 125 APM hosts, 40 profiled hosts, 100 profiled container hosts, 500,000,000 indexed spans, 200 infra hosts, 1,500,000 container hours, 300,000 custom metrics, and ingesting around 10 TB (~10,000 GB) of logs per month with 3500 indexed logs, the monthly cost would be around ~$27,475/month.
Tech Fit
Datadog is best suited for DevOps and mobile-backend teams that need broad observability coverage across mobile apps, APIs, and infrastructure within one unified SaaS platform. It’s ideal for cloud-native organizations and scaling product teams that value extensive integrations and real-time dashboards.
7. Sentry
Known For
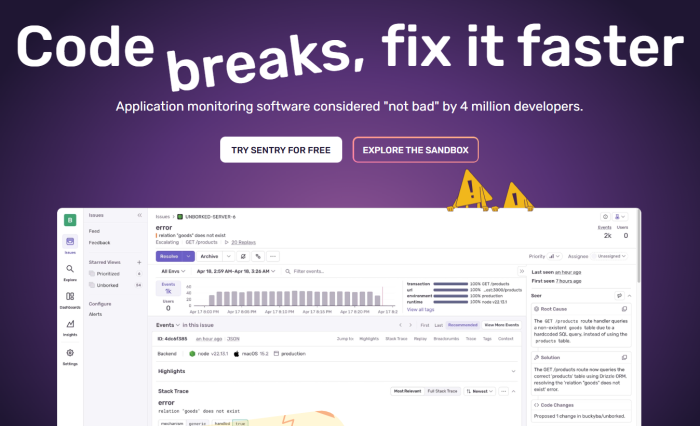
Sentry is a developer-focused, open-source observability platform best known for error tracking, performance monitoring, and crash analytics. Originally built for backend and web applications, Sentry has evolved to include robust mobile SDKs for iOS, Android, and hybrid frameworks. It’s widely adopted by engineering teams that need direct visibility into app health and performance without the heavy cost or complexity of enterprise APMs.
Mobile (iOS, Android) Monitoring Features
- Native SDKs for iOS, Android, React Native, Flutter, and Unity.
- Real-time crash and exception tracking with full stack traces.
- Mobile Performance Monitoring (MPM) for app launch time, ANRs, and slow frames.
- Breadcrumbs for session replay—tracks user actions leading to a crash.
- Network and API latency insights with distributed tracing support.
Key Features
- Error aggregation, grouping, and root-cause analysis.
- Transaction tracing across mobile and backend services.
- Custom performance metrics (TTID, cold start, and app launch time).
- Seamless integrations with GitHub, Jira, Slack, and CI/CD tools.
- OpenTelemetry support for unified tracing pipelines.
Pros
- Open-source foundation with flexible self-hosting.
- Intuitive UI and developer-friendly integration.
- Lightweight SDKs for fast instrumentation.
- Affordable pricing compared to full enterprise APMs.
Cons
- Users experience issues with error handling.
- Users find complex configuration processes challenging
- Users experience an ineffective alerting system with delayed error notifications
Pricing
- Team Plan: $26/user/month (includes basic performance monitoring).
- Business Plan: $80/user/month (adds advanced features, priority support).
- Transactions: $0.55 per 10 K transactions beyond the included limit.
- Error Events: Additional cost beyond free quota, billed per event volume.
Sentry Mobile (iOS, Android) Monitoring Pricing at Scale
*All pricing comparisons are calculated using standardised small/medium/large team profiles defined in our internal benchmarking sheet, based on fixed log, metrics, trace, and retention assumptions. Actual pricing may vary by usage, region, and plan structure. Please confirm current pricing with each vendor.
For a mid-sized SaaS company ingesting 10,000 TB (~10,000 GB) of logs, 500,000,000 indexed spans, and 45,000GB of observability data (charged by the cloud provider), the cost would come to around $12,100/month.
Tech Fit
Sentry is best suited for mobile and product engineering teams that want actionable visibility into crashes, performance bottlenecks, and user experience without the overhead of a complex APM suite. It’s ideal for developers who value open-source flexibility, transparent pricing, and tight Git-integrated workflows to resolve issues quickly across iOS and Android.
8. Firebase Performance Monitoring
Known For
Firebase Performance Monitoring is a free, mobile-first performance tool from Google that helps developers measure real-world app performance directly from user devices. Integrated within the broader Firebase developer ecosystem, it focuses on monitoring app startup times, slow network calls, and UI rendering performance for both Android and iOS. While not a full APM suite, it provides essential visibility into client-side performance that’s especially valuable for mobile teams building on Google Cloud.
Mobile (iOS, Android) Monitoring Features
- Native SDKs for iOS, Android, and web apps.
- Tracks app start time, screen rendering speed, slow and frozen frames.
- Monitors HTTP/S network requests and API response times.
- Supports custom traces for measuring specific code blocks or operations.
- Integrates seamlessly with Crashlytics for crash context and Google Analytics for user behavior insights.
Key Features
- Real-user telemetry from actual devices, not simulated sessions.
- Automatic performance traces for app startup and network activity.
- Easy integration with other Firebase services like Cloud Messaging and Remote Config.
- Web dashboard for filtering performance data by device, OS, geography, and network type.
- Lightweight SDK with minimal overhead, suitable for mobile-first apps.
Pros
- Completely free to use with unlimited basic monitoring.
- Simple setup and automatic instrumentation for common metrics.
- Deep integration with Google Cloud and Firebase ecosystem.
- Ideal for developers who want app performance visibility without heavy configuration.
Cons
- Complex initial setup
- The UI can feel overwhelming especially for new users
Pricing
- Free Tier: Included with every Firebase project.
- Usage: No charge for performance monitoring data or traces.
- Add-ons: Costs apply only if combined with other Firebase services (e.g., Analytics, Hosting, or Cloud Functions).
Firebase Mobile (iOS, Android) Monitoring Pricing at Scale
Even at scale, Firebase Performance Monitoring remains completely free, regardless of the number of active users or data volume. However, teams using Firebase Analytics, BigQuery exports, or Cloud Functions for extended reporting may incur standard Google Cloud usage fees.
Tech Fit
Best suited for startups, indie developers, and small product teams that want an easy, cost-free way to monitor app performance across iOS and Android. Firebase Performance Monitoring is ideal for mobile apps already integrated with Firebase tools and Google Cloud, providing essential visibility.
Conclusion
Mobile APM tools vary widely in how they collect data, scale with usage, and integrate with backend observability. Some prioritize lightweight session analysis and crash visibility, while others extend into full-stack tracing and performance correlation.
The right choice depends on application architecture, traffic patterns, retention requirements, and how closely mobile monitoring needs to align with backend systems. As mobile experiences continue to grow more interconnected with APIs and infrastructure, teams benefit from evaluating not just features but how each tool fits into their broader observability strategy.
Disclaimer: The information in this article reflects the latest details available at the time of publication and may change as technologies and products evolve.
FAQs
1. What does a Mobile APM tool actually monitor?
A Mobile APM tool monitors performance metrics that affect user experience, such as app startup time, crashes, network latency, and ANR (App Not Responding) errors.
2. How is Mobile APM different from traditional APM?
Traditional APMs focus on servers and APIs, whereas Mobile APM tools measure performance directly on real user devices. They track UI responsiveness, network behavior, and crash frequency to ensure smooth app experiences. CubeAPM unifies that telemetry with backend observability in one platform, helping teams see the complete picture across mobile, web, and infrastructure.
3. Which Mobile APM tool is best for Android and iOS developers?
For developers managing native or hybrid apps, CubeAPM stands out for its OpenTelemetry-native design, multi-agent support, and transparent pricing model. It’s ideal for teams needing full-stack visibility without the complex cost tiers found in Datadog.
4. Can Mobile APM tools affect app performance or battery life?
Modern APM SDKs are optimized for efficiency, but heavy instrumentation can still create some overhead. Firebase Performance Monitoring, for instance, provides lightweight tracking but limited flexibility for data control.
5. Do Mobile APM tools support hybrid frameworks like Flutter or React Native?
Yes. Most modern APM platforms support cross-platform frameworks, though the depth of integration varies. The deliver seamless OpenTelemetry-based instrumentation for Flutter, React Native, and Xamarin, ensuring consistent trace correlation between hybrid and native apps.


