React application monitoring tools are now essential for managing complex SPAs and micro-frontends, as React now powers over 44% of global web applications. Yet, many teams struggle to find the right fit due to high ingestion costs, limited RUM support, complex pricing tiers, and poor OpenTelemetry integration.
CubeAPM is the best React application monitoring tool provider that eliminates these challenges through unified observability across metrics, logs, traces, and RUM. Its OpenTelemetry-native design, smart sampling, and predictable pricing empower teams to monitor React performance effortlessly and cost-effectively.
In this article, we’ll explore the best React application monitoring tools, comparing their features, pricing, and ideal use cases.
8 Best React Application Monitoring Tools
- CubeAPM
- Datadog
- New Relic
- Dynatrace
- LogRocket
- Sentry
- Splunk Observability Cloud
- Elastic APM
What is a React Application Monitoring Tool?
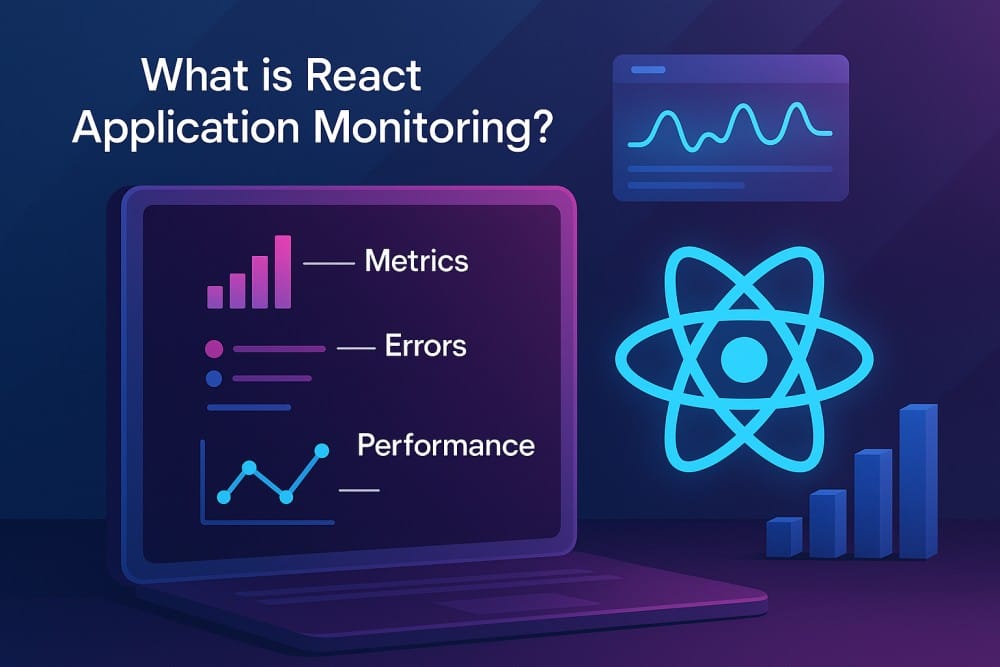
A React Application Monitoring Tool helps developers track, visualize, and optimize how React applications perform in real time—across browsers, devices, and user sessions. It continuously collects metrics, logs, traces, and user interactions to identify performance bottlenecks such as long render times, unhandled JavaScript errors, failed API calls, and slow page loads.
These tools are invaluable for modern businesses that rely on React-driven SPAs or micro-frontends, as they ensure high uptime, fast response times, and exceptional user experience. By providing end-to-end observability—from frontend user sessions to backend services—they help teams detect and resolve issues before they affect customers or SLAs.
Key advantages for modern businesses include:
- Improved User Experience: Monitor Core Web Vitals (LCP, FID, CLS) and React component render times to maintain a smooth interface.
- Faster Debugging: Correlate frontend traces with backend APIs and logs to pinpoint the root cause in seconds.
- Cost Efficiency: Reduce telemetry waste through intelligent sampling and centralized visibility.
- Scalability & Compliance: Maintain performance visibility even in large, distributed systems while keeping data within local or cloud compliance zones.
Example: Tracking React Component Latency with CubeAPM
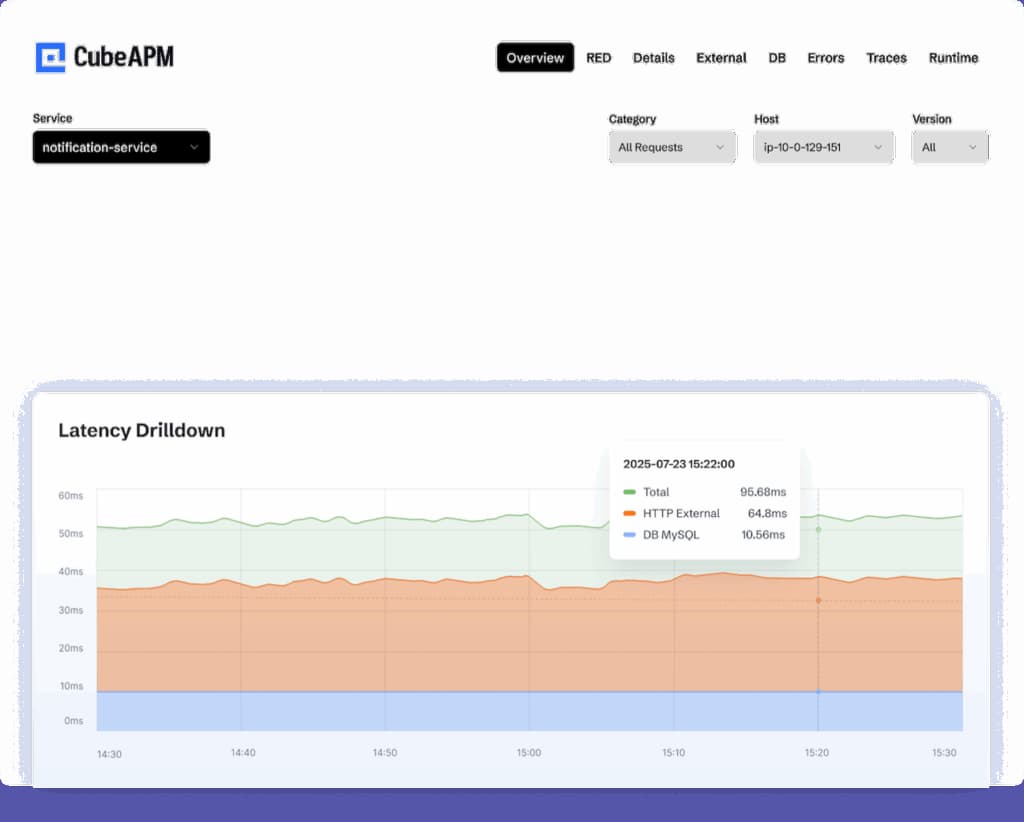
Real-time latency drilldowns in CubeAPM reveal exactly where your service is slowing down
For example, a fintech app built with React can use CubeAPM to trace a slow user dashboard load. Using CubeAPM’s OpenTelemetry-native APM and Real User Monitoring (RUM), developers can visualize every component’s render time and link it to backend API latency. The smart sampling engine captures only high-latency transactions—preserving cost efficiency while retaining meaningful data. From the CubeAPM dashboard, teams can drill down into logs, view distributed traces, or replay the exact user session via Error Tracking and RUM modules, reducing mean-time-to-resolution (MTTR) by up to 70%.
In short, React application monitoring with CubeAPM transforms raw telemetry into actionable insights—empowering teams to deliver fast, reliable, and user-centric web experiences.
Why Teams Choose Different React Application Monitoring Tools
Cost Predictability & Surprise Billing
Many React teams struggle with unpredictable bills as telemetry data grows. Frontend-heavy workloads—RUM, session replay, and component-level metrics—can multiply costs when vendors charge per host, per GB, or per feature. Users frequently face hidden overages under complex SKU-based billing. Predictable pricing models help React teams scale observability without financial risk or constant budget recalibration.
OpenTelemetry-First & Avoiding Vendor Lock-In
React developers increasingly favor tools built on OpenTelemetry to ensure consistent instrumentation across frontend and backend services. An OTel-first approach allows teams to capture browser events, API traces, and logs using open standards—without being locked into a proprietary agent. Open standards simplify migration, data correlation, and future-proofing across evolving frameworks.
RUM – Trace & Log Correlation
Frontend teams don’t just need metrics—they need context. React issues such as hydration errors, route flickers, or slow renders often originate from backend latency or broken APIs. Effective React monitoring tools link Real User Monitoring (RUM) data with backend traces and logs, allowing developers to jump from a lagging user session directly to the root cause. This end-to-end visibility drastically reduces MTTR and accelerates release cycles.
SPA/Soft Navigation & Web Vitals Challenges
Single-Page Applications (SPAs) pose unique monitoring challenges. React’s client-side routing and virtual DOM updates can mask soft navigations, re-render spikes, and LCP/INP changes. Tools that understand SPA lifecycles—like how hydration or route transitions impact Core Web Vitals—deliver more accurate insights. Generic RUM tools often mismeasure SPA routes, leading to misleading Web Vitals data.
Deployment & Data Residency Control
In 2025, privacy, compliance, and performance requirements are driving teams to prefer monitoring solutions that can run on their own cloud (BYOC) or within specific data regions. Enterprises in fintech, healthcare, and government sectors need full control over telemetry pipelines and retention policies. Tools that offer on-prem or regional deployment ensure compliance with GDPR, SOC 2, and local data protection laws while keeping latency low.
Multi-Cloud & Integration Readiness
React frontends typically interact with APIs, CDNs, and microservices spread across AWS, GCP, or Azure. This makes cross-cloud integration critical. Teams choose tools that seamlessly integrate with their existing CI/CD workflows, CDN observability, and performance dashboards, reducing setup friction and preventing siloed visibility. Multi-cloud readiness ensures that frontend metrics align perfectly with backend performance, regardless of infrastructure.
8 Best React Application Monitoring Tools
1. CubeAPM
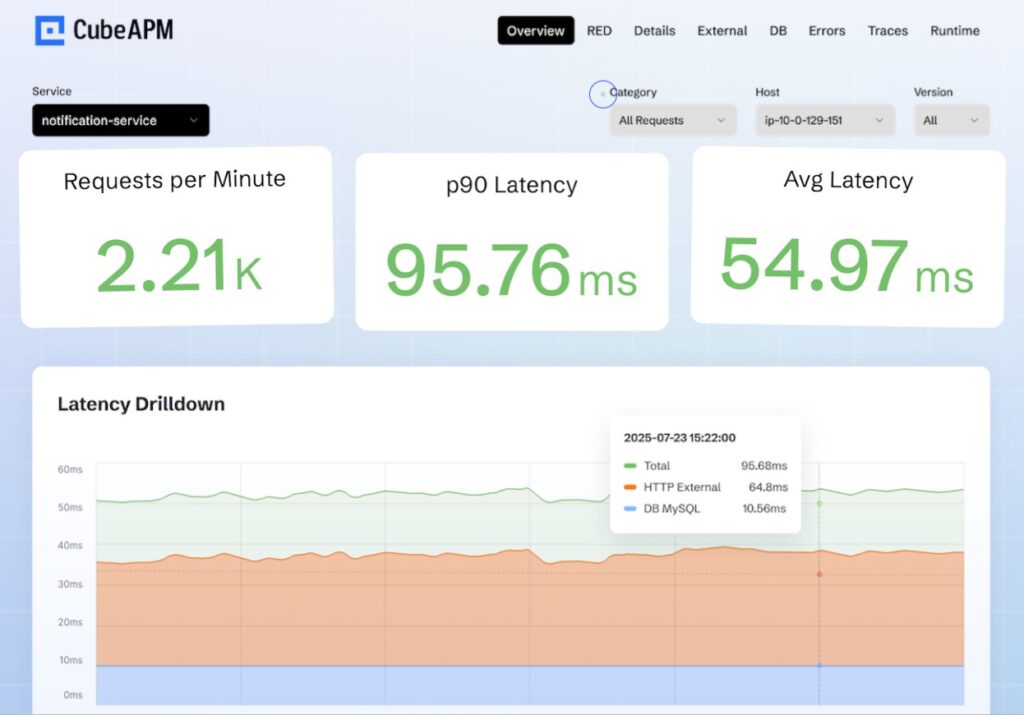
Overview
CubeAPM is an OpenTelemetry-native observability platform designed to simplify full-stack monitoring across modern web and cloud environments. Known for its predictable pricing and developer-centric experience, CubeAPM brings end-to-end visibility into React applications, tracking every user interaction, component render, and API call in real time. With native Real User Monitoring (RUM) and error tracking modules, it helps frontend teams bridge the gap between browser performance and backend latency while maintaining compliance-ready data control under BYOC (Bring Your Own Cloud) options.
Key Advantage
Smart, cost-efficient OpenTelemetry-powered monitoring that delivers full visibility across React apps—without hidden costs or complex licensing.
Key Features
- React Component Tracing: Automatically monitors render times and lifecycle performance across React components.
- Real User Monitoring (RUM): Captures user journeys, Core Web Vitals, and frontend latency metrics to optimize UX.
- Error Tracking: Detects and groups JavaScript and hydration errors with detailed stack traces and browser context.
- Session Insights: Replays user sessions to analyze React state transitions and identify performance regressions.
- Seamless Backend Correlation: Connects frontend telemetry with backend traces for unified observability across APIs and microservices.
Pros
- Transparent per-GB pricing, easy to scale
- Fully OpenTelemetry and Prometheus compatible
- Supports self-hosting and BYOC for compliance
- Unified MELT coverage (Metrics, Events, Logs, Traces)
- Fast, developer-led support via Slack and WhatsApp
Cons
- Not ideal for teams seeking strictly managed SaaS deployments
- Focused on observability; does not include cloud security management capabilities
CubeAPM Pricing at Scale
CubeAPM uses a transparent pricing model of $0.15 per GB ingested. For a mid-sized business generating 45 TB (~45,000 GB) of data per month, the monthly cost would be ~$7,200/month*.
*All pricing comparisons are calculated using standardized Small/Medium/Large team profiles defined in our internal benchmarking sheet, based on fixed log, metrics, trace, and retention assumptions. Actual pricing may vary by usage, region, and plan structure. Please confirm current pricing with each vendor.
Tech Fit
Ideal for JavaScript, TypeScript, and React/Next.js environments. Integrates natively with Node.js, GraphQL, REST APIs, and Kubernetes, giving React teams seamless visibility across frontend, backend, and infrastructure layers.
2. Datadog
Overview
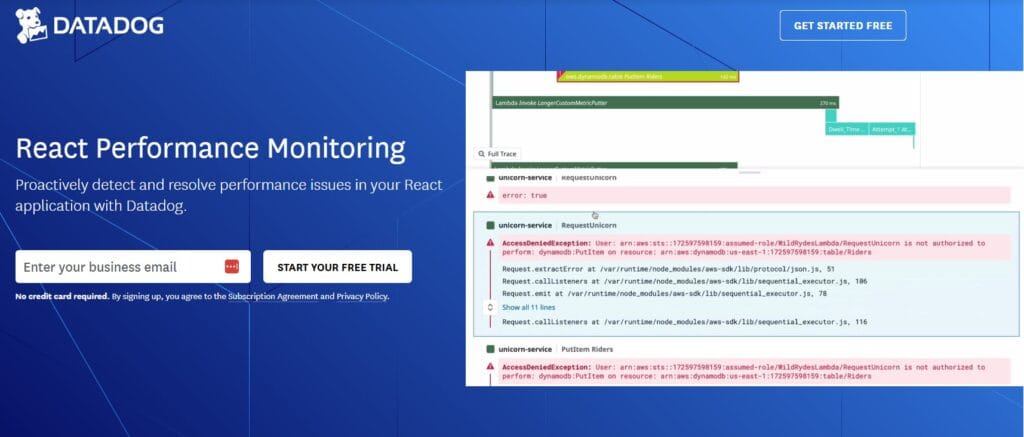
Datadog provides React-focused Real User Monitoring (RUM) that ties browser sessions, Core Web Vitals, and component behavior to backend traces and logs for end-to-end triage. Its React and React Native integrations surface route changes, user actions, long tasks, and errors with session-level context—plus optional Session Replay and Synthetic Browser tests for critical flows.
Key Advantage
Deep RUM↔APM correlation that lets you jump from a slow React interaction or hydration glitch to the exact backend span and log line.
Key Features
- RUM for React (web): Track views, actions, resources, long tasks, errors, and Core Web Vitals with React-aware SDKs.
- React components & profiling: Use Datadog’s React helpers to capture granular component insights and UX context.
- RUM↔APM linking: Correlate user sessions to backend traces for true root-cause analysis across the stack.
- React Native monitoring: Mobile RUM for screens, crashes, network requests, and mobile vitals across iOS/Android.
- Next.js guidance: First-party docs for instrumenting Next.js (React) apps with RUM.
Pros
- Mature React and React Native SDKs with strong docs and examples
- Clean correlation from browser sessions to traces and logs for faster MTTR
- Optional Session Replay and Synthetic Browser tests for critical user journeys
- Productized Core Web Vitals and long-task tracking for SPA realities
Cons
- Pricing spans multiple SKUs (RUM Measure, RUM Investigate, Session Replay, Synthetics), making budget planning at scale difficult
- SaaS-only; no self-hosting
Datadog Pricing at Scale
Datadog charges differently for different capabilities. APM starts at $31/month; infra starts at $15/month; logs start at $0.10/GB, and so on. For a mid-sized business ingesting around 45 TB (~45,000 GB) of data per month, the cost would come around $27,475/month*.
Tech Fit
Strong for React, Next.js, and React Native teams that want out-of-the-box RUM, optional replays, and tight backend correlation within the Datadog ecosystem; integrates with APM, logs, and synthetics for unified triage.
3. New Relic
Overview
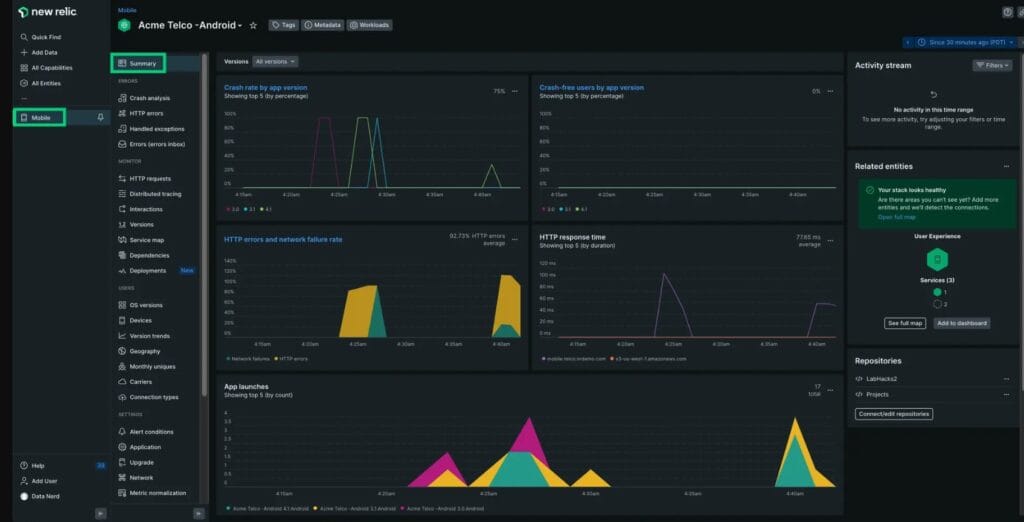
New Relic is a long-standing observability platform with strong React coverage across web and mobile. Its React Native SDK and browser/mobile monitoring surface user interactions, crashes, network timings, and Core Web Vitals, then tie those signals to backend services for full user-journey visibility. Tutorials and best-practice guides help teams instrument React apps quickly and optimize performance in production.
Key Advantage
End-to-end correlation for React and React Native—linking user sessions, component behavior, and mobile/web vitals to backend traces for fast, confident triage.
Key Features
- React Native monitoring: Capture screens, JS errors, crashes, network requests, app starts, and user sessions across iOS and Android.
- Browser/RUM visibility: Track Core Web Vitals, route changes, long tasks, and JS errors in React SPAs with session context.
- Network & API diagnostics: Map slow interactions to specific endpoints and latency sources across the stack.
- Release & version tracking: Compare performance and error rates by app version to spot regressions after deploys.
- Guided install & best practices: First-party setup flows, sample apps, and tuning guidance for React teams.
Pros
- Mature React Native and browser monitoring with rich UI
- Clear user-journey views from interaction to backend service
- Helpful onboarding flows, sample code, and docs
- Broad platform that unifies APM, logs, and infrastructure
Cons
- Data ingest plus user licensing can raise the total cost as usage grows
- SaaS-only; no self-hosting
New Relic Pricing at Scale
New Relic’s billing is based on data ingested, user licenses, and optional add-ons. The free tier offers 100 GB of ingest per month, then it costs $0.40 per GB after that. For a business ingesting 45 TB of logs per month, the cost would come around $25,990/month*.
Tech Fit
Great fit for React web (SPA/Next.js) and React Native (iOS/Android) teams that want a single platform for RUM, mobile monitoring, and backend correlation. Works well in enterprises already standardizing on New Relic for APM and infrastructure, while giving frontend teams deep visibility into real-world UX.
4. Dynatrace
Overview
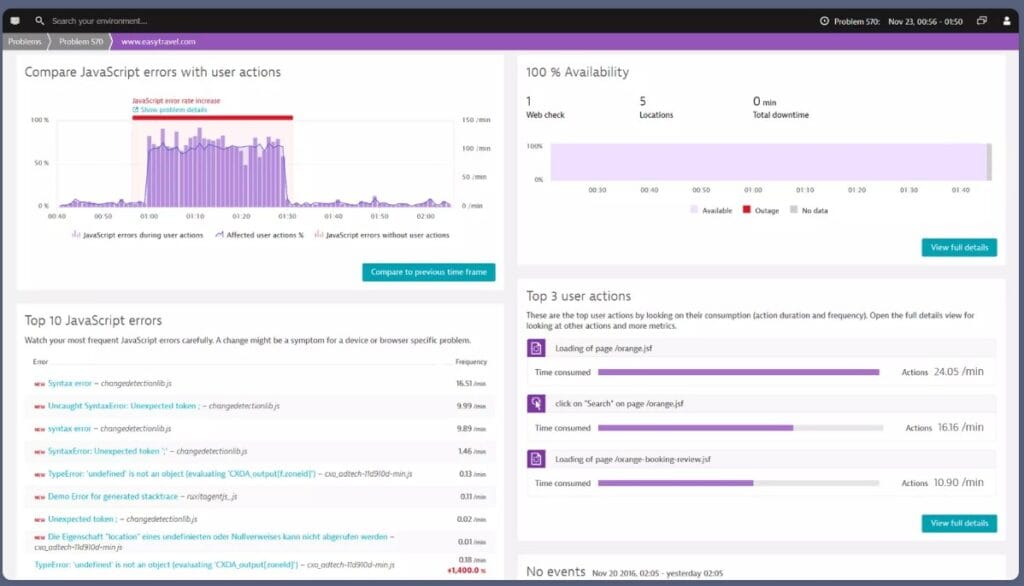
Dynatrace delivers React and React Native monitoring with deep Real User Monitoring (RUM), SPA awareness, and automatic correlation to backend services. Its instrumentation captures user interactions, soft navigations, JavaScript errors, crashes, and network timings, then ties them to traces and resources for full user-journey context across web and mobile.
Key Advantage
React-aware SPA and mobile RUM with end-to-end correlation, letting teams pivot from a problematic interaction or screen to the exact backend dependency and root cause.
Key Features
- SPA soft-navigation tracking: Measures route changes and re-renders in React SPAs for accurate Web Vitals and UX timing.
- React Native monitoring: Captures screens, crashes, network requests, and app starts across iOS/Android for mobile React apps.
- User session & action analytics: Ties clicks, long tasks, and JS errors to specific sessions and backend traces for faster triage.
- Session Replay option: Reconstructs user flows to visualize where React interactions degrade before correlating to services.
- Automatic dependency mapping: Links frontend resources and API calls to services, databases, and infrastructure for holistic visibility.
Pros
- Strong SPA handling with user action and soft-navigation awareness
- Unified view across React web and React Native mobile
- Clear correlation from browser/mobile events to backend services
- Mature docs and guided setup for React frameworks
Cons
- Pricing spans per-session RUM plus per-GiB ingest for traces/events, which requires careful cost modeling
- Steep learning curve
Dynatrace Pricing at Scale
- Full stack: $0.01/8 GiB hour/month or $58/month/8GiB host
- Log Ingest & process: $0.20 per GiB
For a similar 45 TB (~45,000 GB/month) volume, the cost would be $21,850/month*.
Tech Fit
Well-suited to React (SPA/Next.js) and React Native teams that want SPA-aware RUM, optional Session Replay, and automated correlation into backend services and infrastructure—especially organizations standardizing on Dynatrace across apps, mobile, and platforms.
5. LogRocket
Overview
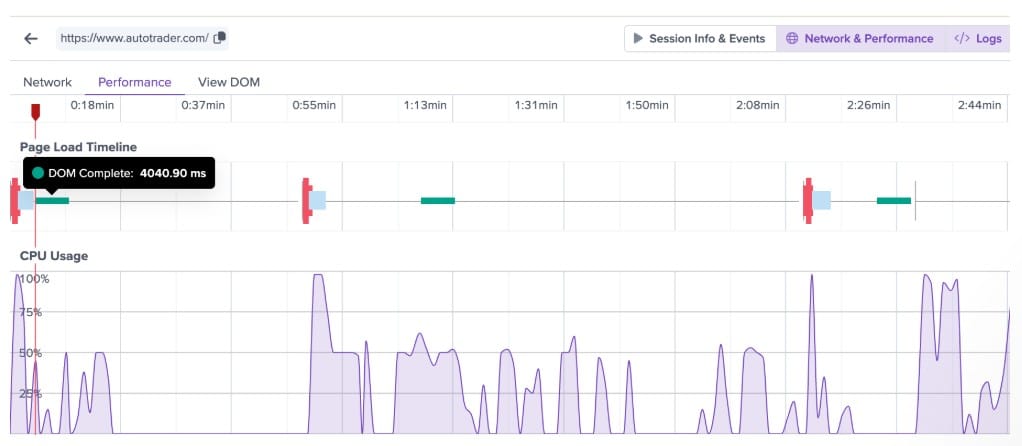
LogRocket is a frontend-focused monitoring and session replay platform built to give developers a user-centric view of React application performance. It records exactly what users see—DOM state, network requests, and console logs—alongside RUM metrics and performance traces. For React teams, it bridges the gap between product analytics and debugging, helping teams identify visual bugs, slow renders, or broken user flows with precision.
Key Advantage
High-fidelity session replay with developer context, providing complete visibility into user sessions, Redux state transitions, and performance bottlenecks across React SPAs.
Key Features
- React session replay: Pixel-perfect recording of DOM, events, and errors for debugging user sessions.
- Performance telemetry: Tracks long tasks, memory, CPU usage, and network performance for each React session.
- Developer debugging surface: Correlates console logs, stack traces, Redux state, and network data directly beside session replays.
- Dashboards & analytics: Provides trend reports and performance charts to measure React app improvements over time.
- Conditional recording: Lets teams filter or sample sessions to balance observability with cost control.
Pros
- Quick root cause discovery via replay and developer data
- Comprehensive performance metrics for React SPAs
- Combines product analytics with performance debugging
- Offers self-hosting for enterprise users
Cons
- Session-based pricing can become expensive for high-traffic React apps
- Session management needs improvement
- Searching and filtering issues
LogRocket Pricing at Scale
LogRocket pricing is based on monthly session volume. Public tiers include Team ($69/month for 10k sessions), Professional ($295/month), and Enterprise (custom pricing with self-host options).
At scale, costs rise as you record more user sessions rather than as log or trace volume grows. For high-traffic applications capturing large numbers of sessions, teams typically move to the Professional or Enterprise (custom-priced) tiers.
Tech Fit
Best suited for React and Next.js teams that need session replay and UX analytics combined with developer debugging tools. It’s particularly valuable for frontend teams looking to visualize user experiences, inspect network activity, and understand performance regressions within complex SPAs.
6. Sentry
Overview
Sentry is a developer-centric monitoring platform known for deep React error and performance visibility. Its React and React Native SDKs surface component render issues, hydration errors, slow interactions, and failing API calls, then link them to releases and source maps so teams can reproduce and fix problems quickly across web and mobile.
Key Advantage
Best-in-class React error + performance debugging with component tracking, rich context, and fast triage from UI symptom to actionable stack trace.
Key Features
- Component Monitoring: Measure render durations and detect slow React components with per-component insights.
- Error Tracking & Source Maps: Group JavaScript exceptions, map minified stacks, and track releases for regression spotting.
- Performance Transactions: Trace user interactions and route changes, correlating them with network/API timings for root cause analysis.
- Session Replay (optional): Reconstruct user flows to see UI state and events that preceded an error or slowdown.
- React Native Monitoring: Capture crashes, JS errors, screens, and network requests across iOS and Android apps.
Pros
- Mature React and React Native SDKs with great docs
- Excellent error context, release tracking, and source mapping
- Strong developer workflow integrations (Git, Jira, Slack)
- Quick path to value for frontend teams
Cons
- Error reporting delays
- Self-hosted option exists, but the SaaS offers the fullest feature set
Sentry Pricing at Scale
Free up to 5K events/month; Teams: from $26/month; Business: usage-based, with tiers for performance monitoring and session replay, starting from $80/month. For mid-sized teams, the cost could be $12,100/month*.
Tech Fit
A strong fit for React, Next.js, and React Native teams that prioritize fine-grained error diagnostics, component-level performance, and developer-friendly workflows—while pairing easily with modern CI/CD and release pipelines.
7. Splunk Observability Cloud
Overview
Splunk Observability Cloud provides React-aware Real User Monitoring across web and React Native, tying UX signals (views, actions, long tasks, errors, crashes) to backend services. Its React Native instrumentation, RUM data model, and manual/auto-instrumentation guides help teams capture route changes, network timings, and user sessions across iOS/Android and the browser, then correlate them with traces and logs for end-to-end triage.
Key Advantage
React and React Native RUM with session-level context, plus seamless correlation to backend services inside the wider Splunk Observability platform.
Key Features
- React Native RUM: Capture screens, crashes, JS errors, network requests, app starts, and user sessions for iOS/Android.
- Web RUM & UX signals: Track views, actions, long tasks, resource loads, and JS errors for React SPAs with session context.
- Correlation to backend: Link frontend sessions to services and traces to pinpoint the exact dependency behind a slow interaction.
- Config & manual instrumentation: Tune which events and attributes you send; add custom attributes for React routes and user actions.
- RUM data model: Standardized event schema for mobile/web so frontend telemetry is consistent and queryable across apps.
Pros
- Strong web and mobile RUM with React Native coverage
- Clear session context and route/action visibility for SPAs
- Integrates with Splunk APM, logs, and infrastructure for full-stack views
- Enterprise ecosystem and support options
Cons
- Pricing mixes host-based tiers with session-based RUM usage, which takes modeling at scale
- Detailed setup and data governance planning are needed to control session volume and costs
Splunk Observability Cloud Pricing at Scale
Splunk prices its Observability Cloud primarily by host per month, with separate charges for log and trace ingestion when volumes exceed plan entitlements.
- Infrastructure only: from $15/host/month
- App & Infra: from $60/host/month
- End-to-End Observability: from $75/host/month
Example (mid-sized company, 45 TB/month and 125 hosts):
- Host licensing (End-to-End): 125 × $75 = $9,375/month
- Logs and traces: 45 TB/month is billed separately under Splunk’s ingest model, which can push costs several thousand dollars higher depending on retention and indexing.
Tech Fit
A good fit for React, Next.js, and React Native teams inside enterprises that want web and mobile RUM tied to backend services, and prefer consolidating APM, logs, and infra under the Splunk Observability umbrella.
8. Elastic APM
Overview
Elastic APM provides Real User Monitoring (RUM) for React via an official React integration, capturing user interactions, page views, errors, and timings in the browser and linking them to backend services for end-to-end analysis. The RUM JS agent supports framework-specific helpers for React and adds distributed tracing for outgoing requests, so React SPA issues can be traced across services in one view.
Key Advantage
React-aware RUM with distributed tracing, letting teams follow a user action in the browser through downstream APIs and services to isolate the true root cause.
Key Features
- React Integration Package: Use @elastic/apm-rum-react to instrument React apps with minimal code and standard patterns.
- Distributed Tracing in Browser: Trace outgoing requests from the React app to correlate UI events with backend latency.
- Framework-Specific Hooks: React-focused guidance for routing, component timing, and SPA behavior to improve measurement accuracy.
- Custom Instrumentation APIs: Add custom spans/labels to capture domain-specific React interactions and business events.
- Unified Observability Backend: Analyze RUM data alongside metrics, traces, and logs in Elastic Observability.
Pros
- Official React RUM integration and docs
- End-to-end visibility from browser to backend with distributed tracing
- Works within broader Elastic Observability (logs, metrics, traces)
- Serverless option with usage-based pricing and OTel-friendly ingest
Cons
- Complex to setup
- Additional costs for retention and egress in serverless pricing can add up at scale
- Self-managed/hosted models require operational expertise to size and run clusters
Elastic APM Pricing at Scale
Elastic’s Serverless Observability pricing starts around $0.15/GB for ingest and $0.02/GB/month for retention. Egress beyond the free tier is $0.05/GB, premium support is an additional 5-15% of monthly spend, and synthetic monitoring is billed separately at $0.10 per 10,000 test runs. Mid-sized scenario (45 TB/month ingest), estimated total: ≈ $17,435/month*.
Tech Fit
Strong for React/Next.js teams that want first-party React RUM tied into a unified Elastic stack, or organizations already standardized on Elastic for logs/metrics who want SPA-aware browser monitoring with distributed tracing.
How to Choose the Right React Application Monitoring Tools
Pricing Model You Can Actually Predict
React monitoring data scales fast—session replays, RUM events, and trace logs can quickly multiply ingestion volume. Choose a tool with transparent, usage-based, or flat-rate pricing that aligns with your growth. Predictable per-GB pricing (like $0.15/GB in CubeAPM) ensures financial control as your React telemetry expands, avoiding hidden costs tied to SKUs or user seats.
OpenTelemetry-First JavaScript Support
Ensure the platform offers native OpenTelemetry support for browser events, React components, and API traces. An OTel-first setup captures every interaction consistently across frontend and backend without proprietary agents. This makes your data portable, future-proof, and easy to analyze alongside other systems.
SPA & Soft-Navigation Awareness
React SPAs rely on client-side routing, meaning traditional RUM tools often misread page loads or miss route transitions. The right tool should understand SPA lifecycle hooks, soft navigations, and component re-renders to measure metrics like LCP, INP, and CLS accurately—even without full page reloads.
RUM ↔ Traces & Logs Correlation
Monitoring tools must connect frontend experience with backend behavior. When a React user faces slow interactions or hydration errors, you should be able to trace that session to specific backend APIs or logs. This seamless correlation reduces troubleshooting time and reveals end-to-end performance issues in seconds.
Core Web Vitals & INP Tracking
Since Interaction to Next Paint (INP) replaced FID in 2024, choose a monitoring tool that measures INP alongside LCP and CLS. For React apps, this ensures responsiveness issues tied to user input and component updates are visible and prioritized in your performance dashboards.
Hydration & Render Error Visibility
React and Next.js apps often face hydration mismatches and rendering delays after SSR. Pick tools that highlight these issues with contextual traces—linking them to network timing, JS bundle size, or state mismatches. Detailed hydration diagnostics help developers fix layout shifts and rendering bottlenecks early.
Session Replay with Privacy Control
For customer-facing React apps, session replay adds value but introduces privacy risk. Select tools offering input masking, region-specific storage, and session redaction controls to comply with GDPR and HIPAA. Safe replays help reproduce issues without exposing sensitive user data.
Data Residency & BYOC Options
Enterprises increasingly require data to remain within specific geographies or clouds. A React monitoring tool should allow Bring Your Own Cloud (BYOC) or self-hosting options to align with compliance frameworks and reduce latency for in-region users.
Integration Fit & SDK Efficiency
The chosen SDK should integrate smoothly with React, Next.js, or Vite builds—without bloating bundle size or affecting performance. Look for modular, tree-shakable SDKs that provide CI/CD, Git, and alerting integrations. Efficient SDKs ensure monitoring adds insight, not overhead.
Conclusion
Choosing the right React application monitoring tool can be challenging for modern teams. Between opaque pricing, limited RUM visibility, and scattered integrations, developers often struggle to connect frontend user experiences with backend performance.
CubeAPM solves these pain points by unifying metrics, logs, traces, and events into one OpenTelemetry-native platform. It delivers full-stack React observability with predictable $0.15/GB pricing and no add-on charges. Teams gain real-time visibility and self-hosting without complexity or financial surprises.
Book a FREE demo with CubeAPM today.
Disclaimer: The information in this article reflects the latest details available at the time of publication and may change as technologies and products evolve.
FAQs
1. What is a React application monitoring tool used for?
It helps developers track how React apps perform in real-time—monitoring user sessions, component renders, JavaScript errors, and API latency to optimize performance and user experience.
2. Why do teams need React-specific monitoring?
React SPAs rely heavily on client-side rendering, which traditional APMs often miss. React monitoring tools track hydration, re-renders, and route transitions to ensure smooth user interactions.
3. How does CubeAPM monitor React applications?
CubeAPM offers end-to-end visibility for React apps using OpenTelemetry-based tracing, Real User Monitoring, and error tracking. It monitors everything—from user clicks to backend dependencies—on a unified dashboard.
4. Is CubeAPM more affordable than other monitoring tools?
Yes. CubeAPM charges a predictable $0.15/GB with no separate fees for logs, metrics, or retention, making it up to 50% cheaper than traditional APM tools for the same data volume.
5. Can CubeAPM be self-hosted for compliance?
Absolutely. CubeAPM supports Bring Your Own Cloud (BYOC) and on-prem deployment options to help teams meet data localization and privacy requirements while keeping latency low.


