Logstash, part of the Elastic Stack, is an open-source pipeline tool that ingests, transforms, and routes data from multiple sources to outputs like Elasticsearch. With its wide plugin ecosystem, it supports real-time log enrichment, durable queues, and flexible codecs, making it a core component in enterprise observability setups.
Although powerful, Elastic Stack can be resource-intensive, a steep learning curve might slow adoption, and storage and retention costs in ELK environments can add up quickly.
CubeAPM is the best Logstash alternative with a cost-effective pricing model of just $0.15/GB, context-based smart sampling to cut costs, an easy-to-use dashboard, and a self-hosting option to help teams with compliance requirements. In this article, we’ll explore the top Logstash alternatives based on features, pricing, user feedback, and more.
Top 7 Logstash Alternatives
- CubeAPM
- Datadog
- New Relic
- Dynatrace
- Graylog
- Fluentd
- Rsyslog
Why Look for Logstash Alternatives
Costly at Scale
Logstash/Elastic starts with appealing pricing, but monthly costs can escalate quickly due to retention, egress, and scaling. According to Elastic’s Serverless Observability pricing, ingest starts at $0.09/GB, egress at $0.05/GB (beyond 50GB free), and data retention costs start at $0.019/GB. All these costs make the overall costing high, especially for larger observability needs.
Resource Consumption & Infrastructure Overhead
Many users report that Logstash becomes resource-hungry under high log volume. Because it’s JVM-based and often uses heavy filters (e.g., grok), CPU and RAM usage rise steeply. In Kubernetes or cloud-native deployments, teams must over-provision memory or tune heap sizes constantly to avoid pipeline failures. This raises the infrastructure and maintenance burden. G2 reviews mention “resource-intensive, especially as data volume grows” for Logstash.
Limited Self-Hosting
Logstash under ELK Stack is available as both SaaS and self-hosted/self-managed options. However, self-hosting is available as a separate plan and not included in Elastic Cloud Hosted or Serverless plans. So, organizations with strict data residency needs to validate this carefully if they wish to go with Serverless or Cloud.
Criteria for Selecting Logstash Alternatives
Comprehensive MELT Capabilities
The next solution should handle metrics, events, logs, and traces in one place. Having all signals under a single roof speeds up root-cause analysis and reduces the hassle of juggling multiple tools.
OpenTelemetry as a First-Class Citizen
Support for OpenTelemetry is essential today. Tools that can natively ingest OTEL data give teams flexibility to standardize instrumentation across services while staying free from vendor lock-in.
Intelligent Sampling for Cost Control
Not every log or trace needs to be stored forever. Platforms that apply context-aware sampling keep the most valuable data—such as errors or high-latency requests—while trimming out the noise, reducing costs without compromising insight.
Deployment Flexibility and Data Ownership
For businesses working under strict compliance rules like GDPR or India’s DPDP, having the option to self-host or deploy in your own cloud ensures data never leaves your environment and avoids surprise egress bills.
Predictable and Transparent Pricing
Budgeting gets tricky when fees are scattered across ingestion, retention, and egress. Favor solutions with clear per-GB pricing and included retention, so finance teams know exactly what the monthly spend will be.
Ease of Management and Responsive Support
Logstash often requires careful tuning and expertise to keep pipelines stable. Look for alternatives that are lightweight to run on Kubernetes and backed by real-time support channels, helping teams resolve incidents faster.
Logstash Overview
Known for
Logstash is known for being an open-source data ingestion and transformation pipeline. It collects logs and events from multiple sources, parses and enriches them, then ships them to destinations such as Elasticsearch or other analytics systems.
Standout Features
- Over 200 plugins: supports a wide range of input, filter, codec, and output plugins.
- Rich filtering & transformation: grok parsing, geo-IP enrichments, field manipulation.
- Durability & reliability: persistent queues, dead-letter queues, safe delivery.
Key Features
- Inputs & Outputs: connects to numerous data sources and multiple output destinations.
- Filters & Codecs: parse unstructured data, apply schemas, transform fields.
- Extensibility: plugin framework for custom development.
- Security & Monitoring: monitoring of pipelines, encryption in transit, RBAC, secure keystores.
Pros
- Highly flexible pipelines & transformations
- Large ecosystem & plugin support
- Strong integration with Elasticsearch, Beats, and Kibana
- Free open-source version for self-managed use
Cons
- Resource-intensive at high volumes
- Steep learning curve for configuration and tuning
- Costly at scale
Best for
Logstash is best for organizations already invested in the Elastic Stack that need flexible log ingestion and transformation pipelines. It suits teams with engineering capacity to manage complex infrastructure, where customization and extensibility matter more than ease of use or predictable costs.
Logstash Pricing & Customer Reviews
- Pricing: Logstash itself is free to use when self-managed, but costs include infrastructure and operations. Elastic Cloud pricing starts at $99/month.
- G2 rating: 4.5/5
- Praised for: flexible pipelines, plugin ecosystem, strong integrations, real-time log processing
- Criticized for: high resource usage, costs at scale
Top 7 Logstash Alternatives
1. CubeAPM
Known for
CubeAPM is known for being a modern, OpenTelemetry-native observability platform that unifies Metrics, Events, Logs, and Traces (MELT). It helps teams simplify monitoring with transparent pricing and full-stack coverage while offering both SaaS and self-hosted options.
Standout Features
- Full MELT observability: supports metrics, events, logs, and distributed traces in one platform.
- Smart sampling engine: context-aware sampling that reduces cost while keeping critical data.
- Data localization compliance: BYOC/self-hosting ensures data never leaves your cloud.
Key Features
- Distributed Tracing: deep visibility into service dependencies and performance bottlenecks.
- Infrastructure Monitoring: built-in dashboards for servers, Kubernetes, and cloud resources.
- Log Monitoring: real-time log ingestion, search, and correlation with traces.
- Synthetic Monitoring: test endpoints and flows with uptime and performance checks.
- Real User Monitoring (RUM): front-end performance tracking across browsers and devices.
- Error Tracking: detect and resolve application errors with detailed context.
Pros
- Transparent, predictable pricing ($0.15/GB ingestion)
- Unlimited data retention at no extra cost
- 800+ integrations with popular agents and platforms
- Responsive support channels via Slack/WhatsApp with core developers
Cons
- Less suited for teams that prefer exclusively vendor-managed SaaS with no self-hosting option
- Primarily focused on observability and does not cover adjacent areas like cloud security management
Best for
CubeAPM is best for organizations seeking an affordable, OpenTelemetry-native alternative to Logstash and Elastic Stack. It is especially useful for teams in regulated industries that require data localization compliance and those looking to consolidate MELT observability into one platform without hidden costs.
CubeAPM Pricing & Customer Reviews
- Pricing: $0.15/GB ingestion, unlimited retention included; no egress surprises
- G2 Rating: 4.7/5
- Praised for: predictable pricing, fast support, modern OTEL-native architecture, flexible deployment options
CubeAPM vs Logstash
While Logstash specializes in log pipelines and transformations, CubeAPM provides a complete MELT observability suite with logs, metrics, traces, RUM, synthetics, and error tracking. CubeAPM also offers smarter sampling to keep costs low, affordable pricing with unlimited retention, and data-localization compliance through self-hosted/BYOC deployments.
2. Datadog
Known for
Datadog is a cloud-native, SaaS observability platform that unifies infrastructure monitoring, APM, log management, RUM, synthetics, error tracking, security, and more—accessible through one UI and APIs. It’s widely adopted for its breadth (900+ built-in integrations) and strong product velocity across MELT and adjacent categories.
Standout Features
- 900+ integrations: prebuilt collectors and dashboards cover major clouds, runtimes, databases, and platforms.
- AI assistance & anomaly detection: Bits AI and Watchdog accelerate triage and surface outliers automatically.
- Unified MELT workspace: correlate metrics, logs, traces, user sessions, and synthetic tests in one place for faster RCA.
Key Features
- APM & Tracing: distributed tracing, flamegraphs, service maps, dynamic instrumentation, and continuous profiler.
- Log Management: real-time ingestion, pipelines, multiple indexing/retention tiers, archive/rehydration workflows.
- Infrastructure Monitoring: host/container/Kubernetes monitoring, autoscaling insights, network, and cloud cost views.
- Digital Experience: browser and mobile RUM, session replay, product analytics, and synthetic monitoring.
Pros
- Broad, mature product suite across observability and security
- 900+ integrations and a strong ecosystem
- Robust APM with profiling and database monitoring
- Powerful dashboards, alerts, notebooks, and collaboration
Cons
- Pricing can become complex and higher at scale (hosts, indexed spans/events, retention, egress)
- SaaS-only; no self-hosted deployment option
Best for
Datadog fits teams that want a full-featured, SaaS observability platform with rapid time-to-value, extensive integrations, and deep APM/log/RUM capabilities, especially in cloud-first environments where centralized control and AI-assisted triage matter.
Datadog Pricing & Customer Reviews
- Pricing: Infrastructure Monitoring Pro starts at $15/host/month; Logs ingestion is $0.10/GB; APM & Continuous Profiler start at about $31/host/month. RUM begins around $1.50 per 1,000 sessions.
- G2 rating: 4.4/5
- Praised for: wide product coverage, integration depth, powerful APM/log workflows, quality dashboards, and alerting
- Criticized for: costly at scale
Datadog vs Logstash
Logstash is an open-source pipeline focused on ingest/transform/route; you own the deployment, tuning, and scaling. Datadog is a managed end-to-end observability platform with APM, infra, logs, RUM, synthetics, and AI assistance, priced per hosts/spans/events with multiple retention tiers.
3. New Relic
Known for
New Relic is a full-stack, SaaS observability platform that brings APM, infrastructure, logs, RUM (browser & mobile), synthetics, error tracking, and business journey mapping (Pathpoint) into one workspace—now with first-class OpenTelemetry (OTLP) ingest.
Standout Features
- Unified data + user model: access 50+ capabilities with one platform and user tiers, avoiding per-host licensing.
- Native OTLP ingest: send OpenTelemetry traces, metrics, and logs directly to New Relic’s OTLP endpoint.
- Pathpoint (business observability): visualize customer/product/service journeys to tie telemetry to business outcomes.
Key Features
- APM & Tracing: distributed tracing, code-level profiling, service maps, and Transaction/APM 360 workflows.
- Log Management: centralized, AI-assisted log analytics with “logs in context.”
- Infrastructure Monitoring: host/container/Kubernetes visibility, change tracking, cloud integrations.
- Digital Experience: browser RUM, mobile monitoring, session replay, and synthetics for proactive testing.
Pros
- Broad, mature suite across MELT with strong product velocity
- Usage-based pricing model with a generous free tier
- Native OTLP support and rich integrations
- Good dashboards, alerting, and troubleshooting workflows
Cons
- Pricing model (users + data or compute + data) can be complex
- SaaS-only; no self-hosting
Best for
Teams that want a single, cloud-hosted observability hub covering apps, infra, logs, and user experience, with native OTEL pipelines and options to tie reliability to business journeys. Strong fit for cloud-first orgs consolidating multiple tools into one platform.
New Relic Pricing & Customer Reviews
- Pricing: Free tier includes 100 GB/month of data ingest and one full-platform user. Beyond that, Original Data is $0.40/GB, while Data Plus is $0.60/GB. Paid plans: $49/user/month to $349/user/month.
- G2 rating: 4.4/5
- Praised for: real-time monitoring, ease of use, integrations, insightful dashboards, and troubleshooting
- Criticized for: expense at scale
New Relic vs Logstash
Logstash is a self-managed ingest/transform/route pipeline—great for building custom log flows, but it stops short of end-to-end observability. New Relic delivers a managed, full-stack platform: APM, infra, logs, RUM, and synthetics, plus native OTLP ingest and Pathpoint to map telemetry to business journeys.
4. Dynatrace
Known for
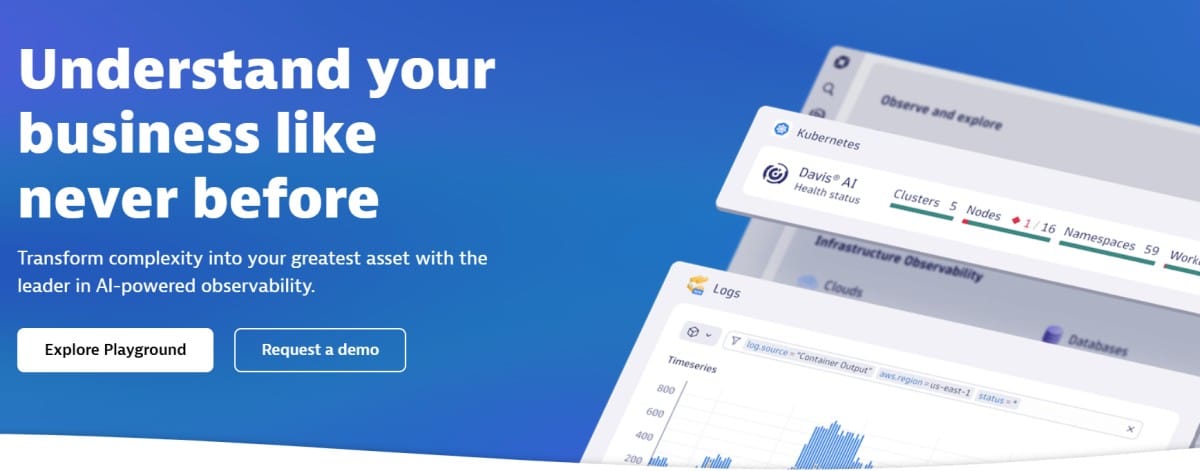
Dynatrace is known for a unified, AI-powered observability and security platform that automates discovery, context generation, and root-cause analysis at scale. Its OneAgent and Grail data lakehouse are central to delivering full-stack insights across apps, infra, logs, and business metrics.
Standout Features
- AI-powered causal analysis (Davis®): automatic anomaly detection, causal insights, and prescriptive guidance.
- Grail data lakehouse: indexless, schema-on-read storage for high-performance analytics across signals.
- OneAgent single deployment: one install per host for automatic instrumentation and continuous collection.
Key Features
- Full-Stack Monitoring: combine application, infrastructure, network, and security telemetry for contextual answers.
- Log Management & Analytics: ingest, process, and query logs with fast, contextual correlation to traces and metrics.
- Digital Experience (RUM & synthetics): real user monitoring, session replay, and synthetic checks for UX and availability.
- Business Observability: tie telemetry to business KPIs and customer journeys using built-in analytics.
Pros
- Automated, AI-driven root-cause analysis and causal insights
- Single-agent instrumentation that reduces setup toil
- High-performance analytics via Grail for correlated MELT queries
- Broad platform capabilities across observability, security, and automation
Cons
- Expensive for smaller teams
- Steep learning curve
Best for
Dynatrace is best for large and enterprise organizations that need deep, automated observability and causal AI across complex cloud-native and hybrid environments, and who want a single platform that covers observability, AIOps, and security at scale.
Dynatrace Pricing & Customer Reviews
- Pricing: Full-Stack Monitoring costs $0.08 per 8GiB-hour for host-based metric collection; Infrastructure Monitoring costs $0.04 per host-hour; Logs ingest & process at about $0.20 per GiB; Traces ingest & process also around $0.20 per GiB; RUM sessions are priced at approximately $0.00225 per session; synthetic monitoring requests ~ $0.001 each.
- G2 rating: 4.5/5
- Praised for: automated instrumentation and discovery, AI-driven insights, unified analytics, high-throughput log/trace handling
- Criticized for: Costly for small teams with tight budgets
Dynatrace vs Logstash
Dynatrace offers a managed, AI-driven platform that ingests, analyzes, and correlates MELT signals out of the box—with built-in automation, tracing, and a unified data lake—whereas Logstash is a self-managed pipeline focused on log ingestion, parsing, and routing.
5. Graylog
Known for
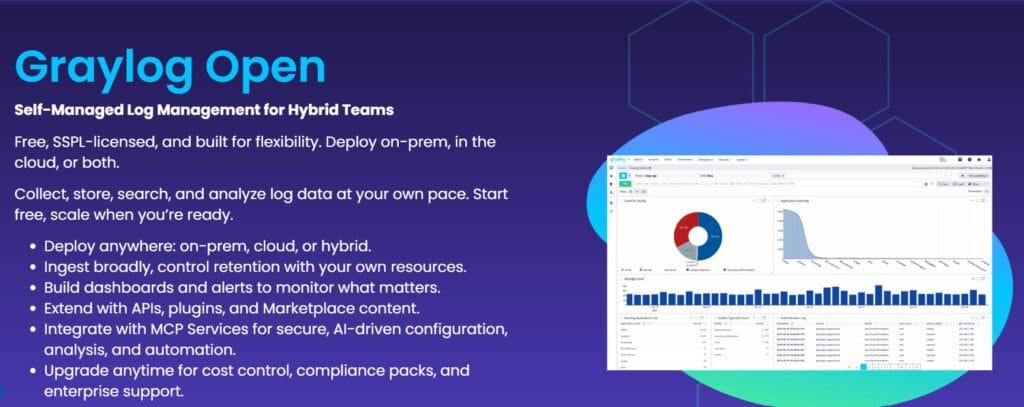
Graylog is known for centralized log management with source-available Graylog Open, plus commercial offerings—Graylog Enterprise, Graylog Security (SIEM), and Graylog API Security—that add enterprise features for observability and security. It emphasizes flexible deployment (cloud, on-prem, or hybrid) and cost control through data tiering and consumption-based licensing.
Standout Features
- Source-available core: Graylog Open (SSPL) provides a free, self-managed foundation you can run on-prem or in your cloud.
- Consumption-based licensing: “Store everything, pay only for what you analyze” with Active Data vs. standby tiers for predictable spend.
- Flexible deployment: Same experience whether you choose Graylog Cloud (AWS) or self-managed/on-prem, with hybrid options.
Key Features
- Pipelines & enrichment: parse, normalize, enrich, and route logs in real time to improve searchability and context.
- Search, dashboards & investigations: fast search, curated dashboards, and investigation workflows for operations and security.
- Events, alerts & correlations: rules, detections, and alerting to surface anomalies and reduce time to response.
- Data management & tiering: intelligent routing to active or standby storage to balance performance with cost.
Pros
- Free, source-available core with upgrade path
- Cloud, on-prem, and hybrid deployment flexibility
- Consumption model focused on Active Data
- Security offerings (SIEM, API Security) built on the same platform
Cons
- Difficult setup and maintenance
- Limited visualizations
Best for
Teams that want full control over log data with the freedom to deploy on-prem, in their own cloud, or as a managed service—while keeping costs predictable through Active/standby tiering. A strong fit for organizations seeking an enterprise log platform that can expand into SIEM and API security without switching stacks.
Graylog Pricing & Customer Reviews
- Pricing: Graylog Enterprise: $15,000/year (paid annually), Graylog Security: $18,000/year, and Graylog API Security: $18,000/year. Graylog Small Business offers free up to 2 GB/day.
- G2 rating: 4.4/5
- Praised for: Easy to install, good customer support, efficient log management
- Criticized for: Dashboard issues
Graylog vs Logstash
Logstash is a self-managed pipeline focused on ingest/transform/route, great for custom log flows, but limited to logs without turnkey security features. Graylog adds enterprise log management with built-in dashboards, alerting, investigations, and optional Security and API Security capabilities, plus cloud/on-prem flexibility and a consumption-based pricing approach that can simplify cost planning.
6. Fluentd
Known for
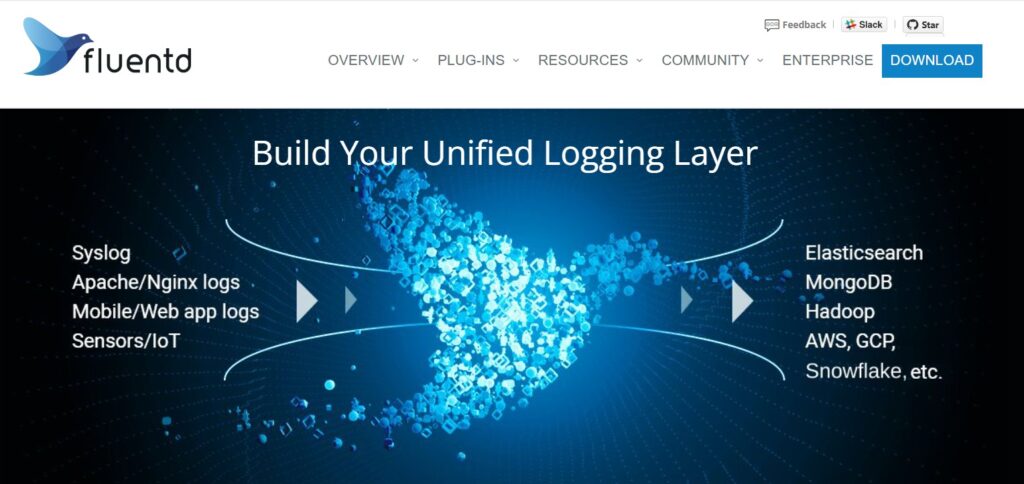
Fluentd is known for being an open-source, cloud-native data/log collector that builds a unified logging layer. It decouples data sources from backends, treats logs as JSON for easy parsing/enrichment, and ships data to many destinations across the stack.
Standout Features
- Unified logging layer: decouples producers and consumers so you can route the same data to multiple backends simultaneously.
- Plugin architecture: input, filter, and output plugins enable flexible parsing, enrichment, and delivery.
- LTS packages & cross-platform installers: official LTS channels and installers (including Windows MSI) for stable enterprise adoption.
Key Features
- Data collection & transformation: collect from apps, syslog, containers; parse and enrich events in-stream.
- JSON-first processing: treats logs as JSON for consistent structure, searchability, and schema evolution.
- Buffering & reliability: memory/disk buffers, retries, and backpressure controls to prevent data loss.
- Broad integrations: connectors for 125+ systems via plugins to outputs like object storage, message queues, and analytics backends.
Pros
- Open source and widely adopted in cloud-native environments
- Flexible plugin model for parsing, enrichment, and routing
- Reliable buffering and delivery semantics
- Available LTS and official installers for stable operations
Cons
- Difficult to monitor and debug
- Learning curve
Best for
Teams that want a lightweight, open-source alternative to Logstash for log collection and routing—especially in Kubernetes or hybrid environments—while keeping control of configuration, scaling, and destination choice. Fluentd fits well where you already have or prefer your own search/analytics backend and need a flexible, reliable pipeline.
Fluentd Pricing & Customer Reviews
- Pricing: Fluentd is free and open source (Apache 2.0). Commercial Enterprise Services (support, custom plugins, managed services with SLAs) are available through official partners; pricing is by inquiry.
- G2 rating: 4.4/5
- Praised for: unified logging layer, plugin ecosystem, JSON-first design, LTS availability
- Criticized for: Learning for new users
Fluentd vs Logstash
Both are powerful log collectors with rich plugins, but Fluentd emphasizes a lightweight, JSON-first, cloud-native pipeline with LTS channels and broad plugin coverage. Logstash offers deep filter plugins and tight Elastic Stack integration, but is heavier to run. Choose Fluentd when you want an open-source collector that’s easy to run at the edge and in Kubernetes, and pair it with your preferred analytics/storage backend.
7. Rsyslog
Known for
Rsyslog is known for being a high-performance, modular syslog daemon and log pipeline widely deployed across Linux systems. It provides reliable log collection, transformation, and routing while maintaining a lightweight footprint, making it a staple in enterprise and cloud environments.
Standout Features
- High-performance, multithreaded engine: near wire-speed ingestion with disk-assisted queues for reliability.
- Flexible routing & filtering: property- and expression-based filters, rulesets, and templating for dynamic outputs.
- Broad output integrations: modules for Elasticsearch, Kafka, databases, cloud endpoints, and more.
Key Features
- Secure transport: TCP, TLS/SSL, and RELP for reliable, encrypted delivery.
- Structured logging: JSON support, parsing/enrichment modules, and powerful templating.
- Action queues & buffering: in-memory/disk queues, rate limiting, and backpressure controls.
- Linux-native design: lightweight, widely adopted as the default syslog daemon in many Linux distributions.
Pros
- Mature, fast, and lightweight
- Highly configurable with a rich module ecosystem
- Reliable delivery with buffering and retries
- Free and open source for Linux
Cons
- No built-in UI, dashboards, or analytics
- Debugging difficulty
Best for
Rsyslog is best for organizations that want a stable, Linux-native log collector and forwarder with minimal resource use, especially in environments where logs need to be shipped reliably to Elasticsearch, Kafka, or an observability backend. It’s well-suited as an edge collector or central relay in larger pipelines.
Rsyslog Pricing & Customer Reviews
- Pricing: Rsyslog for Linux is completely free and open source. The Rsyslog Windows Agent is commercially licensed per machine, with editions priced at Basic $55, Professional $79, and Enterprise $109.
- G2 rating: 4.2/5
- Praised for: speed, reliability, flexible configuration, long-term stability on Linux
- Criticized for: steep learning curve, lack of built-in analytics
Rsyslog vs Logstash
Rsyslog is a lightweight, Linux-native pipeline designed for high-speed log forwarding, reliability, and minimal overhead. Logstash, on the other hand, provides a richer plugin ecosystem and is more advanced in-pipeline transformations, but is heavier to run. Teams seeking simplicity, performance, and stability often lean toward Rsyslog, while those needing advanced enrichment and Elastic Stack integration favor Logstash.
Conclusion
Logstash remains powerful for log ingestion and routing, but it can be complex, heavy resource use, and unpredictable Elastic Cloud costs push many teams to seek better options.
CubeAPM solves this with a full-stack observability solution with native OpenTelemetry support, unified metrics, events, logs, and traces (MELT), smart sampling to cut down costs, unlimited retention, self-hosting to comply with regulations, and responsive customer support.
Book a free demo with CubeAPM today.
Disclaimer: The information in this article reflects the latest details available at the time of publication and may change as technologies and products evolve.
FAQs
1. What are the best Logstash alternatives?
Some of the best Logstash alternatives include CubeAPM, Datadog, New Relic, Dynatrace, Graylog, Rsyslog, and Fluentd. These tools offer different strengths, from enterprise observability to lightweight log shipping.
2. Why should I look for an alternative to Logstash?
Logstash can be resource-intensive, complex to configure, and costly for smaller teams with a tighter budget.
3. Which Logstash alternative is the most cost-effective?
CubeAPM is the most cost-effective Logstash alternative. It charges a $0.15/GB of ingested data with unlimited retention, avoiding the unpredictable costs.
4. Do Logstash alternatives support OpenTelemetry?
Yes. Modern tools like CubeAPM, New Relic, and Dynatrace natively support OpenTelemetry, ensuring future-proof instrumentation across metrics, logs, and traces.
5. Which Logstash alternative is easiest to manage?
For teams wanting simplicity, CubeAPM and Fluentd are often preferred. CubeAPM provides an all-in-one self-hosted option, while Fluentd is lightweight and ideal for Kubernetes and container-based environments.


