JavaScript application monitoring tools are essential in 2025, with 98.9% of websites using JavaScript as a client-side language. Almost every user’s experience depends on the performance, from page load times to interactive responsiveness.
Small issues, like slow rendering or unhandled errors, can mean lost revenue, bouncing users, and damaged reputation. But the challenge for most teams is choosing the right monitoring solution as the costs balloon with increasing telemetry, complex setups, alert overload, and so on.
CubeAPM is the best JavaScript application monitoring tool provider, built to solve these issues. It offers real user monitoring (RUM), end-to-end distributed tracing, error tracking, strong OpenTelemetry support, compliance-ready data handling, and transparent, usage-based pricing, all with minimal setup friction.
In this article, we’ll explore the top JavaScript application monitoring tools, comparing their features, pricing, integrations, and best use cases.
Top JavaScript Application Monitoring Tools
- CubeAPM
- Datadog
- New Relic
- Dynatrace
- LogRocket
- Sentry
- AppSignal
- Better Stack
What is a JavaScript Application Monitoring Tool?
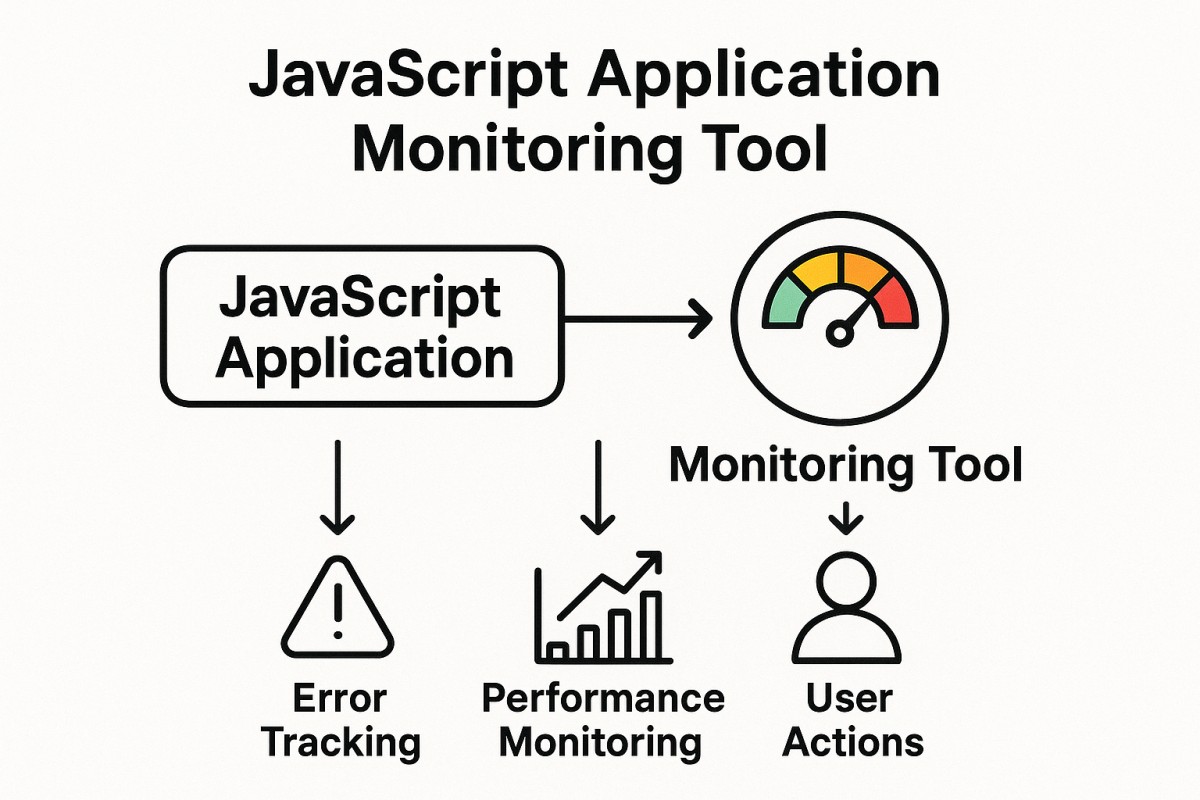
A JavaScript Application Monitoring Tool is software that continuously tracks the performance, availability, and errors of applications built with JavaScript. It captures key metrics like page load times, Core Web Vitals, API response latency, and user interactions, then correlates these with backend traces and logs. By doing so, it helps teams identify where bottlenecks occur — whether in the front-end code, third-party scripts, APIs, or infrastructure.
For modern businesses, this monitoring is more than just a technical safeguard — it directly impacts revenue, customer satisfaction, and brand reliability. Choosing the right monitoring tool enables teams to:
- Detect and resolve JavaScript errors before they frustrate users.
- Track real user experiences (RUM) across devices, browsers, and geographies.
- Correlate frontend actions with backend services using distributed tracing.
- Optimize infrastructure costs with smart sampling and efficient data retention.
- Stay compliant with regional data laws by controlling where telemetry is stored.
In short, JavaScript application monitoring tools give organizations a way to transform raw telemetry into actionable insights, ensuring both performance and compliance as applications scale.
Example: Debugging Slow Checkout Flows with CubeAPM
Imagine an e-commerce site built with React where users experience lag at the checkout stage. With CubeAPM, every step of the transaction is tracked in real time. Real User Monitoring (RUM) highlights rising Largest Contentful Paint (LCP) on the checkout page. Distributed tracing links this slowdown to a backend payment API with 900ms latency. Meanwhile, log monitoring surfaces repeated 500-error entries from the payment gateway, and synthetic tests confirm the issue affects multiple regions.
Because CubeAPM supports smart sampling and OpenTelemetry-native instrumentation, the team sees the full story — from the browser click to the failing backend call — without drowning in unnecessary data. They fix the API configuration, and CubeAPM dashboards in the Playground instantly show checkout performance restored, reducing cart abandonment and improving revenue.
Why Teams Choose Different JavaScript Application Monitoring Tools?
Cost predictability at front-end scale
JavaScript telemetry grows fast — real user monitoring beacons, session replay streams, and error traces can quickly hit terabytes. Many teams report unpredictable bills when vendors charge separately for RUM, logs, and retention. This is why organizations now prefer tools that offer flat per-GB pricing, transparent cost breakdowns, or BYOC/self-hosted deployments to keep budgets predictable and under control.
OpenTelemetry-first to avoid lock-in
With OTel SDKs for both browser and Node.js now stable, developers want instrumentation that is portable across vendors. An OpenTelemetry-first approach ensures teams don’t get stuck rewriting code when switching platforms or adopting multi-cloud strategies. It also helps unify traces from JavaScript front-ends with backend microservices, making end-to-end observability easier to maintain.
SPA accuracy: soft navigations and Core Web Vitals
Single-page apps like those built on React, Vue, or Angular don’t reload pages in the traditional way, so monitoring must detect route changes and soft navigations correctly. Google’s Core Web Vitals, especially INP and LCP, require accurate field data to capture user-perceived performance. Teams, therefore, look for tools that attribute slowdowns to long tasks, scripts, or third-party components, instead of just reporting generic “page slowness.”
Strong front-end ↔ back-end correlation
Frontend-only charts rarely solve real-world performance issues. What teams need is seamless correlation between browser actions, API calls, and backend services. Tools that propagate trace context (traceparent) across the stack make it possible to trace a user’s click all the way to a database query or failing service, enabling developers to resolve root causes quickly rather than guessing.
Data residency and session replay governance
JavaScript monitoring can expose sensitive data, whether through error payloads, URLs, or user session recordings. Enterprises in regulated sectors require strict PII masking, consent management, and the ability to keep telemetry in-region. This is why many buyers now evaluate tools on their compliance story — GDPR, HIPAA, DPDP — and favor vendors offering self-hosting or BYOC deployments to keep legal teams comfortable.
Developer ergonomics and noise reduction
Front-end engineers often face overwhelming error volumes and messy stack traces without source maps. Effective JavaScript monitoring should automate source-map handling, group related errors, and apply smart sampling so that only actionable data gets through. By reducing noise and providing clear, de-minified stack traces, these tools make debugging faster and adoption smoother across dev teams.
Top 8 JavaScript Application Monitoring Tools
1. CubeAPM
Overview
CubeAPM has established itself as a next-generation observability platform built with OpenTelemetry-first design and seamless compatibility for JavaScript-heavy applications. Known for its transparent pricing and real-time monitoring capabilities, it is trusted by engineering teams who want full visibility into both frontend JavaScript performance and backend services without dealing with hidden costs or vendor lock-in. Its market position is strengthened by features like smart sampling, compliance-ready deployment, and rapid time-to-value for modern web apps.
Key Advantage
End-to-end correlation of JavaScript front-end interactions with backend traces, helping teams diagnose issues faster and improve user experiences.
Key Features
- Real User Monitoring (RUM): Capture Core Web Vitals (LCP, INP, CLS) and user session metrics in real time.
- Error Tracking: Detect and group unhandled JavaScript exceptions, promise rejections, and client-side API failures.
- Distributed Tracing: Link JavaScript browser spans with Node.js and backend services using trace context.
- Synthetic Monitoring: Simulate user flows across web applications to catch issues before they impact users.
- Log Correlation: Combine JavaScript errors and logs with traces for faster debugging.
Pros
- Transparent and predictable pricing
- Strong OpenTelemetry and Prometheus compatibility
- High data residency and compliance flexibility with BYOC/self-host options
- Direct support channels with fast response times
Cons
- Less suited for teams that prefer fully off-prem managed solutions
- Focused on observability only, without cloud security management features
CubeAPM Pricing at Scale
CubeAPM uses a transparent pricing model of $0.15 per GB ingested. For a mid-sized business generating 45 TB (~45,000 GB) of data per month, the monthly cost would be ~$7,200/month.
*All pricing comparisons are calculated using standardized Small/Medium/Large team profiles defined in our internal benchmarking sheet, based on fixed log, metrics, trace, and retention assumptions. Actual pricing may vary by usage, region, and plan structure. Please confirm current pricing with each vendor.
Tech Fit
CubeAPM works best for JavaScript ecosystems, including modern frameworks like React, Angular, and Vue. On the server side, it supports Node.js, Python, Java, Go, Ruby, and .NET, making it a strong choice for full-stack monitoring where the browser layer plays a central role.
2. Datadog
Overview
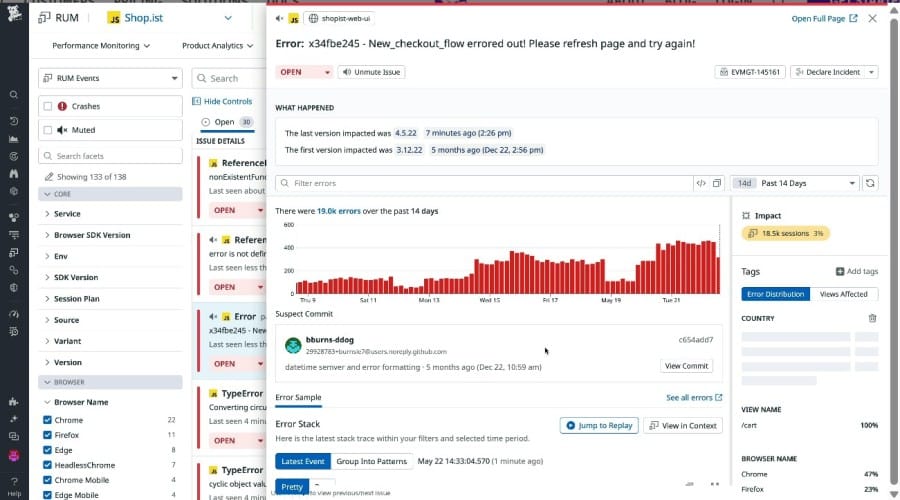
Datadog is a popular choice for JavaScript-heavy teams that want frontend RUM, Session Replay, and browser logs tied directly to backend APM and logs for fast, unified triage. Its RUM product measures Core Web Vitals, groups high-volume JS errors into insights, and lets engineers pivot from a user session to traces and logs in a click—handy for rooting out SPA-specific regressions and third-party script issues.
Key Advantage
Unified frontend-to-backend troubleshooting: correlate RUM sessions (and replays) with APM traces and logs to move from symptom to root cause quickly.
Key Features
- RUM sessions & Core Web Vitals: Capture LCP/CLS/INP, load times, and surface high-impact sessions for targeted fixes.
- Session Replay (add-on): Pixel-accurate replays to diagnose UI friction like rage clicks and broken flows.
- Browser Logs SDK: Ship JS console logs and custom events from the browser to analyze alongside backend data.
- Error insights: Group noisy JS errors, pinpoint the exact line, and segment by browser, device, or release.
- End-to-end correlation: Seamlessly pivot between sessions, traces, and logs for full context.
Pros
- Mature RUM and replay with strong SPA troubleshooting
- Tight correlation across RUM, traces, and logs for faster MTTR
- Good browser logging and custom event collection for JS teams
- Works well with synthetic monitoring to validate fixes pre-release
Cons
- JS console logs are billed by GB while RUM and replay are billed per session, so costs can add up at scale
- SaaS-only; no self-hosting
Datadog Pricing at Scale
Datadog charges differently for different capabilities. APM starts at $31/month; infra starts at $15/month; logs start at $0.10/GB, and so on. For a mid-sized business ingesting around 45 TB (~45,000 GB) of data per month, the cost would come around $27,475/month.
Tech Fit
Strong for modern web apps (React, Vue, Angular) that need real-user JS telemetry plus Node.js and backend APM in the same pane. Ideal when teams want session-level evidence (RUM/Replay) and the ability to pivot into traces/logs without switching tools.
3. New Relic
Overview
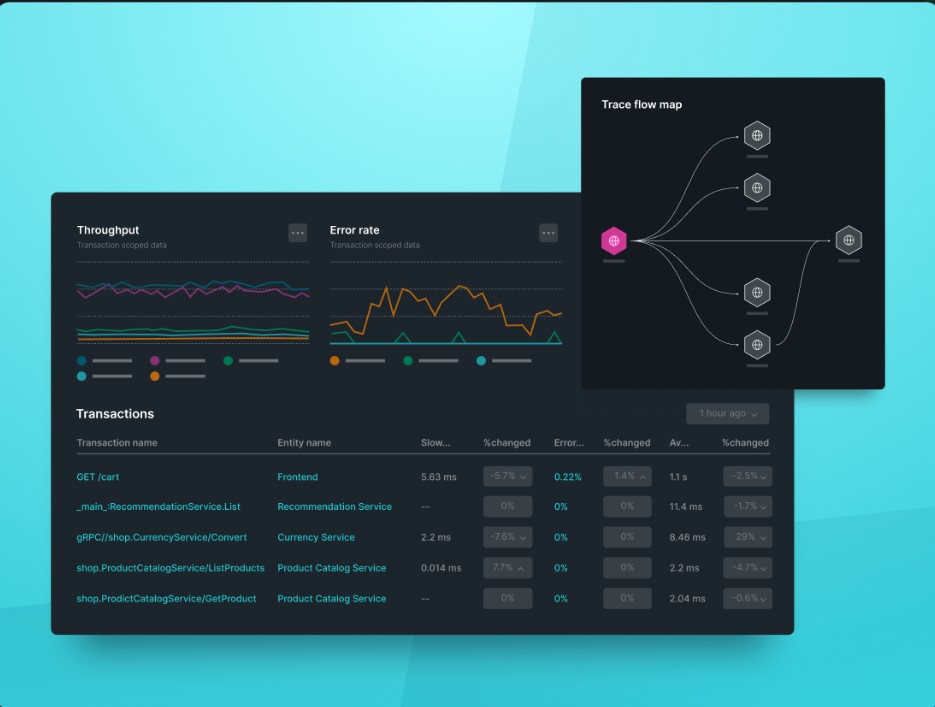
New Relic is one of the most established observability platforms, with a Browser Monitoring agent tailored for JavaScript-heavy apps. It tracks Core Web Vitals, JavaScript errors, AJAX/fetch requests, and single-page application navigations, while also offering optional Session Replay for replaying user sessions. With strong integration into its APM and logs, New Relic helps front-end teams trace issues from a slow button click down to the backend service or query responsible.
Key Advantage
Advanced JavaScript RUM and error analytics with SPA support and the ability to drill into full-stack traces for context-rich debugging.
Key Features
- Core Web Vitals monitoring: Capture LCP, INP, and CLS with page-level insights.
- SPA route tracking: Detect soft navigations and route changes in frameworks like React, Angular, and Vue.
- JavaScript error analysis: Group noisy errors, use source maps for readable stacks, and view error profiles.
- AJAX/fetch tracking: Measure and attribute slow responses to specific API calls.
- Session Replay: Visualize real user sessions to understand UI issues.
Pros
- Mature and feature-rich browser monitoring agent
- Clear workflows for Core Web Vitals and SPA performance
- Strong error grouping and replay for frontend troubleshooting
- Large library of docs and community guides for modern JS apps
Cons
- Pricing can scale quickly with data volume and user licenses
- SaaS-only; no self-hosting
New Relic Pricing at Scale
New Relic’s billing is based on data ingested, user licenses, and optional add-ons. The free tier offers 100 GB of ingest per month, then it costs $0.40 per GB after that. For a business ingesting 45 TB of logs per month, the cost would come around $25,990/month.
Tech Fit
Well-suited for modern front-end frameworks (React, Angular, Vue, Next.js) and teams already using New Relic APM. It provides a strong feature set for browser monitoring but is better suited for enterprises willing to pay a premium for advanced retention and replay capabilities.
4. Dynatrace
Overview
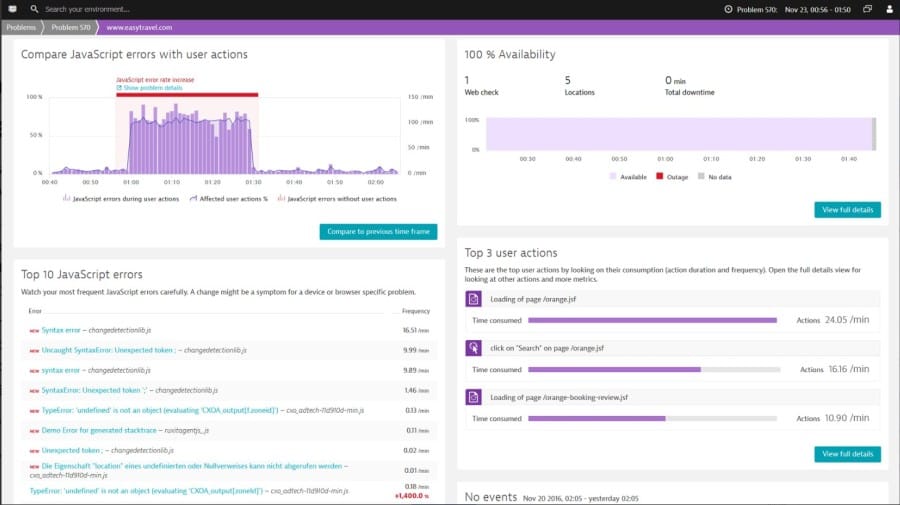
Dynatrace offers a deep Digital Experience Monitoring stack for JavaScript applications: SPA-aware Real User Monitoring (RUM), optional Session Replay, and robust setup options (auto-injection via OneAgent or agentless script). It models web apps as first-class “applications,” captures user actions and sessions, and provides SPA-specific UX signals such as Visually complete alongside error analysis—useful when you need to see how real users experience route changes without full page reloads.
Key Advantage
Highly configurable SPA-aware RUM with flexible injection (OneAgent or agentless) and business-context enrichment for analyzing real user journeys end-to-end.
Key Features
- SPA-aware measurements: Track user actions without page loads, surface JavaScript errors fast, and use Visually complete for perceived UX timing in single-page apps.
- Agentless or auto-injected setup: Insert a RUM snippet when you can’t install OneAgent, or let OneAgent auto-inject the JS tag for you.
- Custom properties & tagging: Add user/session properties and tags to tie telemetry to business context and segment behavior.
- Session Replay controls: Capture privacy-aware replays to reproduce UI issues; billing distinguishes normal RUM sessions vs. sessions with replay.
- Trace correlation: Link user actions to backend distributed traces (including cross-origin configurations) for true front-to-back debugging.
Pros
- Strong SPA focus with visually complete and user-action analytics
- Flexible deployment: OneAgent auto-injection or agentless snippet
- Rich customization via JS API, user/session properties, and tagging
- Mature replay and synthetic options for validating key journeys
Cons
- Multiple meters (per-session RUM and per-GiB Grail ingest) make budget planning complex
- Learning curve is steep
Dynatrace Pricing at Scale
- Full stack: $0.01/8 GiB hour/month or $58/month/8GiB host
- Log Ingest & process: $0.20 per GiB
For a similar 45 TB (~45,000 GB/month) volume, the cost would be $21,850/month.
Tech Fit
Best for enterprises running React/Vue/Angular SPAs that need granular UX timing (including Visually complete), privacy-aware Session Replay, and the option to deploy either agentless or with OneAgent while preserving end-to-end trace correlation into backend services.
5. LogRocket
Overview
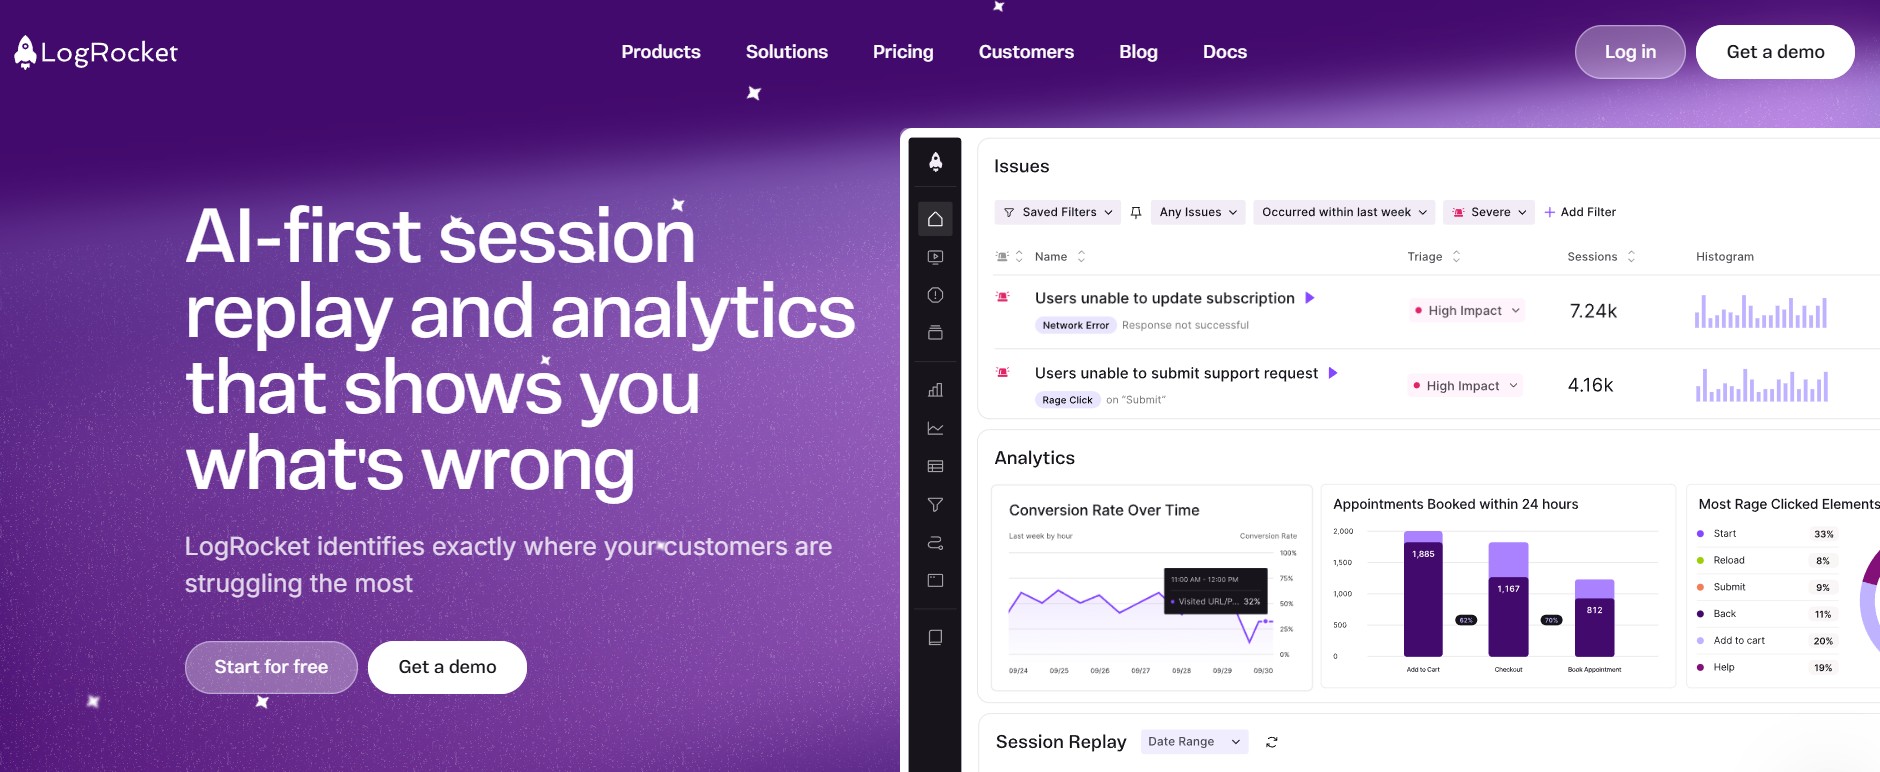
LogRocket is best known in the JavaScript world for session replay + frontend performance + error tracking in one workflow. It captures pixel-perfect replays alongside console logs, network requests, and JS exceptions, then layers Core Web Vitals and performance telemetry to show how issues impact real users—especially useful for SPA teams hunting down long tasks, route-change regressions, or third-party script slowdowns.
Key Advantage
Session-centric debugging that pairs pixel-accurate replay with JS errors, network events, and performance metrics so engineers can reproduce and fix issues quickly.
Key Features
- Real User Monitoring (CWV): Track LCP, INP, CLS and surface sessions with poor UX for targeted fixes.
- Performance telemetry: Inspect long tasks, CPU/memory usage, browser crashes, and network speed per session.
- JavaScript error logging: Group errors, attach de-minified stacks via source maps, and map impact to sessions.
- Network & console capture: Record XHR/fetch payloads and console logs to see exactly what the browser saw.
- Analytics & dashboards: Build charts and funnels to quantify performance impact over time.
Pros
- Excellent session replay for reproducing UI bugs
- Strong JS error + network + console visibility tied to real sessions
- SPA-friendly workflows for route changes and long-task analysis
- Clean onboarding and tooling focused on frontend teams
Cons
- Costs scale by session volume; high-traffic apps may need enterprise tiers
- Session management needs improvement
- Searching and filtering difficulty
LogRocket Pricing at Scale
LogRocket prices by sessions. Public tiers show Team at $69/month for 10k sessions or $139/month for 25k sessions; Professional starts at $295/month and Enterprise is custom for higher volumes. Team is generally positioned for roughly 10k–50k sessions/month; above that, Professional/Enterprise is typical.
Illustrative example (mid-sized JS org): assume 5 million sessions/month. Using Team’s sticker rates as a per-session proxy gives a high-end estimate of ≈ $0.0069/session (10k plan) → ~$34,500/month, or ≈ $0.00556/session (25k plan) → ~$27,800/month.
Tech Fit
Frontend-first teams on React, Next.js, Vue, Angular that need replay-driven debugging, Core Web Vitals, and session-level performance/error context. Works well as a dedicated frontend monitoring & replay layer alongside a back-end APM when deep server tracing isn’t required inside the same tool.
6. Sentry

Overview
Sentry is a developer-first platform that excels at JavaScript error tracking, frontend performance monitoring, and session replay. It captures Web Vitals, JS exceptions with de-minified stack traces, network/fetch timing, and SPA route changes, then ties them to traces so you can jump from a user’s broken interaction to the backend span or API call involved. With opinionated defaults and strong framework SDKs, Sentry fits neatly into modern React, Next.js, Vue, and Angular workflows.
Key Advantage
Rapid error-to-fix workflows for JavaScript: from real-time alerts and readable stack traces to Web Vitals and replay, all in one developer-friendly UI.
Key Features
- Web Vitals (INP, LCP, CLS): Field data from real users with page- and route-level drill-downs.
- JavaScript errors & source maps: Grouped issues, readable stacks, release tracking, and regression signals.
- Performance & tracing: Frontend transactions and spans linked to backend work for end-to-end context.
- Session Replay: Video-like reproductions of user sessions to reproduce UI issues quickly.
- Breadcrumbs & network capture: Console logs, XHR/fetch details, and user actions to complete the timeline.
Pros
- Excellent developer ergonomics and fast time-to-value
- Strong JS SDKs and framework guides for SPA setups
- Clear error grouping and de-minified stacks with source maps
- Web Vitals and replay give product-impact context, not just charts
Cons
- Event-based pricing (errors, spans, replays, logs) requires careful budget planning
- Error reporting delays
Sentry Pricing at Scale
Free up to 5K events/month; Teams: from $26/month; Business: usage-based, with tiers for performance monitoring and session replay, starting from $80/month. For mid-sized teams ingesting 45 TB of data, the cost could be $12,100/month.
Tech Fit
Teams prioritizing developer-centric JS monitoring—fast error triage, readable stacks, SPA performance, Web Vitals, and session replay—across React, Next.js, Vue, Angular, and Node.js. Works well when you want actionable frontend insights tightly integrated into everyday dev workflows.
7. AppSignal
Overview
AppSignal is a developer-friendly APM that teams often adopt for JavaScript error tracking on the frontend and Node.js performance on the backend—without wrestling with complicated SKUs. Its JS library focuses on catching client-side exceptions, enriching events with breadcrumbs (user actions, network calls, console output), and de-minifying stack traces via source maps. For Next.js shops, AppSignal can also ingest Web Vitals so you can trend UX metrics alongside app telemetry.
Key Advantage
Developer-centric JS error visibility with breadcrumbs + source maps, so front-end failures are readable and reproducible—and can be correlated with Node.js performance data in the same product.
Key Features
- JavaScript error tracking: Catch exceptions and promise rejections, group issues, tag with user/context, and alert your team.
- Source maps & readable stacks: Upload sourcemaps to turn minified traces into function, file, and line numbers you can act on.
- Breadcrumbs (network, console, window): Auto-capture requests, console calls, and UI events leading up to an error for faster repro.
- Issue tracker & alerts: One-click send to Jira/GitHub and real-time notifications via Slack, PagerDuty, and more.
- Next.js Web Vitals (integration): Option to forward LCP/CLS/INP and related metrics to AppSignal “Magic Dashboards.”
Pros
- Simple, predictable request-based pricing with relaxed upgrade policy
- Unlimited users and apps included, good for growing teams
- Solid JS error context with breadcrumbs and source-map de-minification
- Strong fit for Node.js backends alongside frontend error tracking
Cons
- UI needs improvement
- Fewer integrations
AppSignal Pricing at Scale
AppSignal prices by requests (web requests + background jobs). The Starter plan is about $23/month for roughly 250k requests/month and scales with request volume; optional add-ons (like long-term log storage) are available. Because billing is request-based, a scenario defined purely as “45 TB of telemetry” doesn’t map directly—you’d size your plan by the monthly request count and any add-ons.
Tech Fit
Best for teams that want straightforward JS error monitoring (React, Vue, Angular, plain JS) with breadcrumbs and clean stack traces, plus a solid Node.js APM story. If you need full browser RUM and session replay, you’ll likely pair AppSignal with a dedicated frontend RUM/replay tool—or consider a platform that includes those natively.
8. Better Stack
Overview
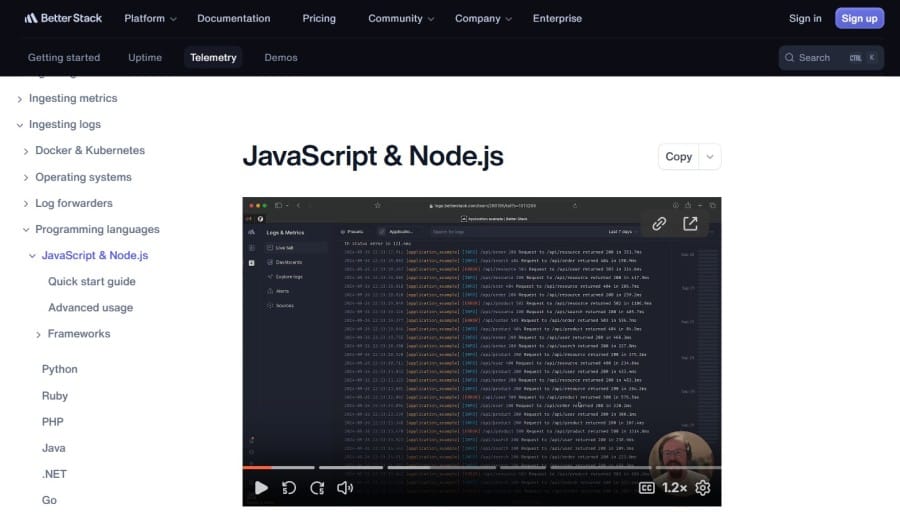
Better Stack combines log management, distributed tracing, and incident response in one platform, with a workflow that’s friendly to JavaScript teams. You can ship browser and Node.js logs, instrument traces with OpenTelemetry, and then query everything together using SQL/PromQL or a drag-and-drop UI. It’s a solid fit if your JS monitoring strategy leans on front-end logs + trace correlation rather than full RUM or session replay.
Key Advantage
OTel-native logs + traces in one place: capture JavaScript logs and browser/Node spans, then investigate issues with unified, fast queries.
Key Features
- JavaScript & Node logging: Send console errors and structured logs from browser and Node.js with context attached.
- OpenTelemetry web & service tracing: Emit spans from the browser and propagate trace context to backend services.
- Query with SQL/PromQL: Correlate logs, spans, and metrics using familiar query languages for faster diagnosis.
- Own-bucket option: Store telemetry in your S3 bucket to optimize costs and retention policies.
- Built-in incident workflows: Escalate to on-call, merge incidents, and post-mortem without leaving the platform.
Pros
- OpenTelemetry-first for future-proof instrumentation
- Unified log + trace investigation with powerful SQL querying
- Option to store data in your own S3 bucket
- Tight handoff to on-call and incident management
Cons
- SaaS-only; no self-hosting
- Swift cost spike from free to paid license
Better Stack Pricing at Scale (updated)
- Free tier: Includes 10 monitors, 1 static page, 3 GB logs (3-day), 2B metrics points (30-day), 1 or more responders using Slack/phone/SMS.
- Paid plans: Start at $29/user/month, including one responder license and unlimited users, with bundles for telemetry and incident capabilities.
Teams ingesting 42 TB of data monthly can end up paying $20,550/month.
Tech Fit
Great for teams that prefer JavaScript logging + OTel tracing over full RUM—e.g., React/Next.js apps where you already capture Web Vitals via custom code and want to stitch browser logs/spans to backend services. Especially appealing if you want SQL-style investigations and the option to keep data in your own S3 while integrating incident response.
How to Choose the Right JavaScript Application Monitoring Tools
Prioritize OpenTelemetry-first instrumentation
Choose a platform that supports OpenTelemetry for both browser and Node.js out of the box. OTel-native tools let you instrument once and keep data portable across vendors or clouds, avoiding vendor lock-in and ensuring end-to-end consistency in your telemetry.
Demand SPA-accurate RUM and Core Web Vitals tracking
Modern React, Vue, and Angular apps rarely reload pages. Your monitoring tool must detect soft navigations, track route changes, and measure Core Web Vitals like INP and LCP from real user data. It should also pinpoint long tasks and third-party script delays, not just report generic page slowness.
Ensure end-to-end correlation with W3C Trace Context
Debugging is easier when you can trace a user’s click through fetch/XHR calls to backend spans and database queries. Tools that propagate traceparent headers across the stack give you full visibility, helping teams resolve issues at the actual root cause.
Evaluate privacy, data residency, and replay governance
JavaScript telemetry often contains sensitive data through errors, URLs, or session replays. Enterprises should select tools with PII masking, consent controls, and in-region data storage to meet GDPR, HIPAA, or DPDP compliance. Options like self-hosting or BYOC deployments are increasingly important for regulated industries.
Check source-map handling and error noise reduction
Readable stack traces depend on proper source-map pipelines to de-minify errors safely. Look for platforms that handle source-map uploads securely, group similar errors, and apply smart sampling so your developers see actionable issues instead of noisy, repetitive alerts.
Model cost at front-end scale
RUM beacons, JavaScript errors, and replay sessions can generate terabytes of data in high-traffic apps. The right tool offers transparent per-GB pricing, predictable retention policies, and cost controls to prevent budget overruns during traffic spikes. Flat or capped pricing models make long-term planning far easier.
Conclusion
JavaScript monitoring is tricky to get right. Teams wrestle with surprise bills (sessions, replays, and logs add up), noisy alerts, weak SPA handling for soft navigations, and tools that don’t tie a user’s click to the exact backend span. Add privacy, data-residency, and setup friction, and choosing a tool becomes risky and time-consuming.
CubeAPM solves these pains with an OpenTelemetry-first approach, accurate RUM and error tracking for modern frameworks, end-to-end trace correlation, and smart sampling; priced simply at $0.15/GB ingested with self-host/BYOC options for compliance.
Book a free demo with CubeAPM.
Disclaimer: The information in this article reflects the latest details available at the time of publication and may change as technologies and products evolve.
FAQs
1. Do I really need both Real User Monitoring (RUM) and Session Replay?
RUM quantifies what users experience (LCP/INP/CLS, route-change latency, error rates) while replay helps you see why a specific session went wrong. Many teams start with RUM and add replay for high-value funnels (checkout, signup). CubeAPM covers RUM and error tracking out of the box; you can layer replay selectively to control costs.
2. How much performance overhead do JS monitoring scripts add?
A well-built SDK is usually <50–100KB compressed and loads asynchronously. Overhead mainly comes from what you capture (replay, heavy logs, high-frequency events). Use sampling, exclude noisy routes, and defer non-critical beacons until load/idle. CubeAPM’s smart sampling keeps signal high while minimizing client overhead.
3. How do I forecast cost when vendors price by sessions vs. GB?
Convert your traffic into both units: estimate monthly sessions (RUM/replay pricing) and estimated payload per session (logs/errors/traces in MB → GB). Build two scenarios—normal and peak—and apply each vendor’s meters (sessions, replay minutes, GB ingest). CubeAPM simplifies this with a single $0.15/GB ingested rate.
4. What’s the safest way to handle source maps and PII in JS monitoring?
Upload source maps privately (never expose to the public web), tie them to releases, and rotate access tokens. For privacy, enable URL/query-param scrubbing, mask form fields, and turn on IP/user-ID hashing where possible. Choose tools that support in-region storage and BYOC/self-host if you have strict compliance needs—CubeAPM supports both.
5. How do I evaluate a tool in 7–10 days without derailing the sprint?
Instrument one high-traffic SPA route, enable RUM + JS errors, and trace one critical API. Define 6 checks: soft-nav detection, INP/LCP attribution, error grouping + de-minified stacks, trace propagation to backend, redaction/masking behavior, and a cost readout from real traffic. If a platform (like CubeAPM) passes these with minimal config, you’re set for broader rollout.


