Instatus stands out for its simple setup and clean status pages that make it easy for teams to communicate service availability and incidents clearly to users. But as organizations scale, high costs have pushed most to seek alternatives.
CubeAPM emerges as the best Instatus alternative, offering a complete observability suite with flat $0.15/GB pricing, an extensive integrations ecosystem(800+), and OTEL-native integrations. CubeAPM delivers real-time visibility across your systems while keeping costs predictable.
In this article, we’ll explore why teams look for Instatus alternatives, the criteria for choosing the right tool, and the best options available in 2025.
Top 7 Instatus Alternatives
- CubeAPM
- Amazon CloudWatch
- New Relic
- Coralogix
- Middleware
- Dynatrace
- Datadog
Why Look for Instatus Alternatives?
1. High Pricing as Usage Scales
Instatus is easy to start with, but costs can rise as teams need custom domains, private pages, or higher notification and subscriber limits. As requirements grow, this pricing can feel high compared to alternatives that offer similar features more affordably.
“Unfortunately, very overpriced, but for the features, some people will certainly spend on this…” (G2 Review)
2. Overwhelming Interface
While the interface is visually polished, managing incidents, monitors, and configurations can become less intuitive as setups expand. For teams handling multiple services, the dashboard may feel cluttered, making simpler alternatives more attractive.
“The interface is clunky for batch edits, creating many components, etc…”(G2 Review)
Criteria for Suggesting Instatus Alternatives
When choosing an alternative to Instatus, teams should evaluate solutions against the following criteria:
1. Breadth of Observability (MELT Support)
A modern alternative should provide full MELT coverage—Metrics, Events, Logs, and Traces—along with RUM and synthetic monitoring. This ensures end-to-end visibility into application performance and user experience.
2. OpenTelemetry (OTEL) Support
With OTEL emerging as the industry standard for instrumentation, the best alternatives must be OTEL-native and seamlessly integrate with Kubernetes, Prometheus, and existing APM agents. This avoids vendor lock-in and simplifies migration from legacy tools.
3. Cost Efficiency at Scale
As telemetry data grows into terabytes per month, pricing can spiral. Host-based and feature-tiered models (e.g., Datadog, New Relic) quickly become expensive. Alternatives like CubeAPM use flat per-GB pricing to deliver predictable costs at scale.
4. Integration Ecosystem
Alternatives should provide broad integrations across cloud, DevOps, and CI/CD pipelines, so teams don’t have to switch tools constantly.
Instatus Overview
Known For
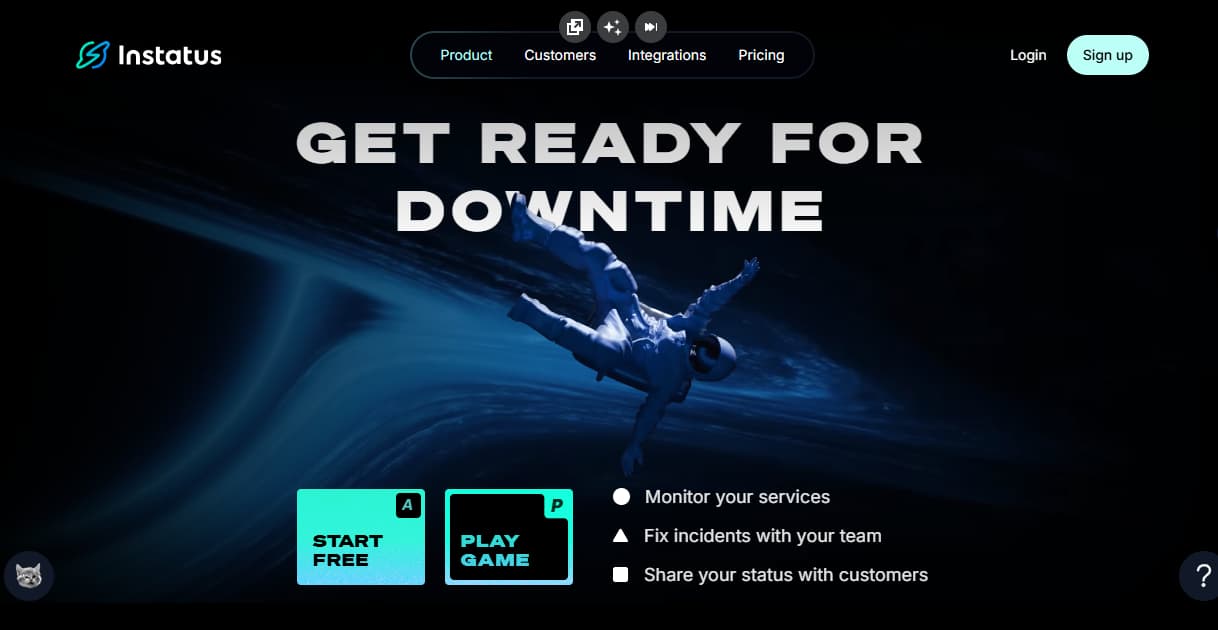
Instatus is best known as a lightweight status page tool that helps teams quickly communicate uptime, downtime, and incident updates with customers. It’s popular among startups and SaaS companies for its simplicity and affordability.
Standout Features
- Extremely fast setup (a working status page in minutes).
- Simple, branded status pages without technical overhead.
- Integrations with Slack, Opsgenie, PagerDuty, and email for incident notifications.
Key Features
- Public and private status pages for different stakeholders.
- Incident history and scheduled maintenance tracking.
- Webhook support for automation.
- Custom branding and custom domains.
- Team collaboration with role-based permissions.
Pros
- Clean, easy-to-use interface.
- Affordable pricing plans.
- Simple integration with popular incident management tools.
- Transparent communication builds customer trust.
Cons
- Overwhelming interface especially for new users
- Expensive as usage grows
Best For
Startups, SaaS platforms, and small to mid-sized teams looking for a simple, low-cost status page solution without the complexity of a full observability suite.
Pricing & Customer Reviews
- Starter: $0 includes 15 monitors, 2-minute checks, email alerts, and 5 team members.
- Pro: $15/month includes 50 monitors, 30-sec checks, email & SMS alerts.
- Business: $225/month includes 1,000 monitors, 30-sec checks, unlimited monitoring.
- G2 rating: 4.9/5, praised for simplicity and affordability.
Top 7 Instatus Alternatives
1. CubeAPM

Known For
Full-stack observability with MELT coverage (Metrics, Events, Logs, Traces) and OTEL-native compatibility. It’s designed for teams seeking cost-efficient, compliance-ready monitoring.
Key Features
- Distributed Tracing: Capture and analyze end-to-end request flows across microservices.
- Log Monitoring: Centralized logging with advanced query and retention options.
- Infrastructure Monitoring: Track system health and performance metrics at scale.
- Synthetic Monitoring: Proactively test critical endpoints and APIs.
- Real User Monitoring (RUM): Understand real-world user experiences.
- Error Tracking: Pinpoint application-level issues in real time.
Standout Features
- Smart Sampling: Retains high-value traces (errors, latency spikes) while reducing data costs by 60–80%.
- Compliance-Ready On-Prem Hosting: All telemetry data stays in the customer’s own cloud, meeting localization laws.
- Seamless Integrations: Fully compatible with Datadog, New Relic, Prometheus, Elastic, and OTEL agents.
- Transparent Pricing: Flat $0.15/GB ingestion + $0.01/GB transfer with no user license fees.
Pros
- 60–80% cheaper than Datadog and New Relic.
- 800+ integrations across cloud, infrastructure, and DevOps tools.
- Real-time support via Slack/WhatsApp with core engineers.
- Low-latency insights with no vendor lock-in.
Cons
- Not suited for teams looking for off-prem solutions
- Strictly an observability platform and does not support cloud security management.
Best For
Teams and enterprises needing scalable, OTEL-native observability with predictable pricing and compliance-first data control.
Pricing & Customer Reviews
- Pricing: Flat $0.15/GB ingestion.
- G2 Rating: 5/5
CubeAPM vs Instatus
Instatus focuses on uptime monitoring and status pages, helping teams communicate incidents and service availability. CubeAPM, in contrast, provides full-stack observability across logs, metrics, and traces for deeper operational visibility. For teams that need unified observability, CubeAPM is the better fit.
2. Amazon CloudWatch
Known For
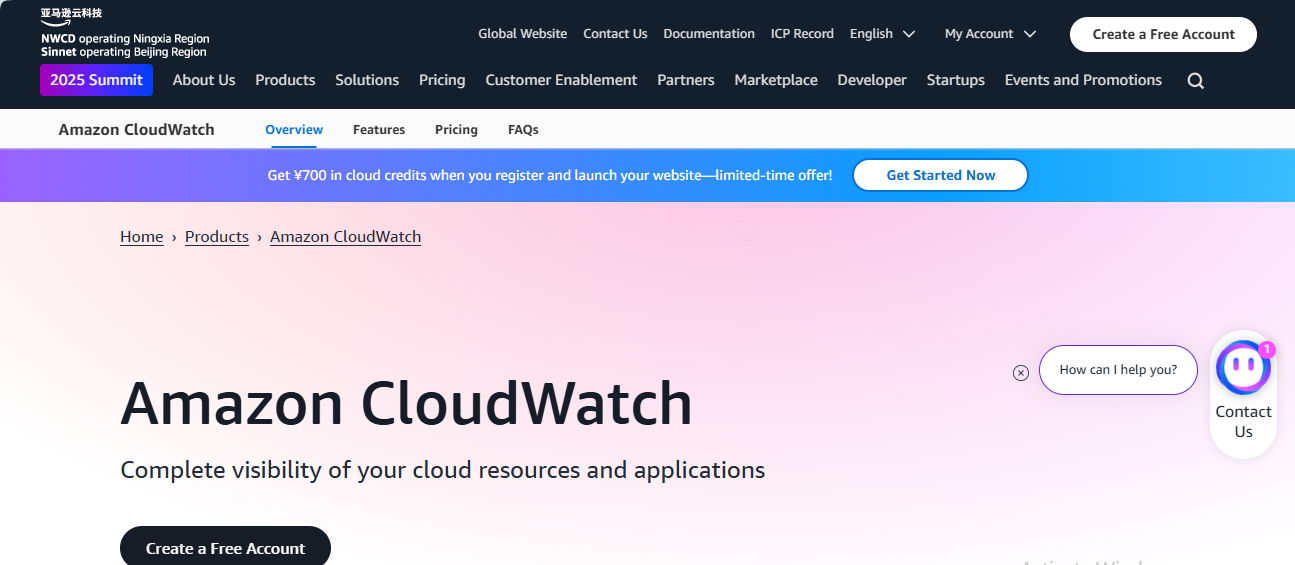
Amazon CloudWatch is popular for its native AWS monitoring and observability service, designed to track infrastructure, logs, and application performance within the AWS ecosystem.
Key Features
- Metrics Collection: Monitors AWS services, applications, and custom metrics.
- Logs Management: Centralized log storage, querying, and retention.
- Alarms & Dashboards: Set thresholds and visualize performance data in real time.
- EventBridge Integration: Automate responses to incidents and operational events.
- Application Insights: Detects anomalies in application performance automatically.
Standout Features
- Deep AWS Integration: Works seamlessly with EC2, Lambda, RDS, and other AWS services.
- Auto-Scaling & Automation: Tightly integrated with AWS Auto Scaling and operational workflows.
- Pay-as-You-Go Pricing: No upfront cost; charges are based on usage.
Pros
- Native to AWS, ensuring minimal setup for cloud-first teams.
- Strong ecosystem integration with all AWS services.
- Highly scalable and reliable within AWS infrastructure.
Cons
- Complex User Interface
- High Costs at Scale
- Steep Learning Curve
Best For
Organizations running primarily on AWS infrastructure that need integrated monitoring and logging without third-party tools.
Pricing & Customer Reviews
- Free: 5 GB Data, Basic Monitoring Metrics
- Metrics: $0.30/metric/month for the first 10,000 metrics
- Logs: $0.50/GB ingested
- Synthetics: Canary runs cost $0.0012/run
- G2 rating: 4.3/5, praised for native AWS integration and scalability, but users note complex pricing.
Amazon CloudWatch vs Instatus
Amazon CloudWatch provides deep monitoring for AWS infrastructure and applications, including metrics, logs, and alerts tightly integrated with the AWS ecosystem. Instatus, by comparison, is focused on uptime checks and status page communication. CloudWatch is better suited for teams needing internal cloud monitoring, while Instatus fits teams prioritizing external service status updates.
3. New Relic
Known For
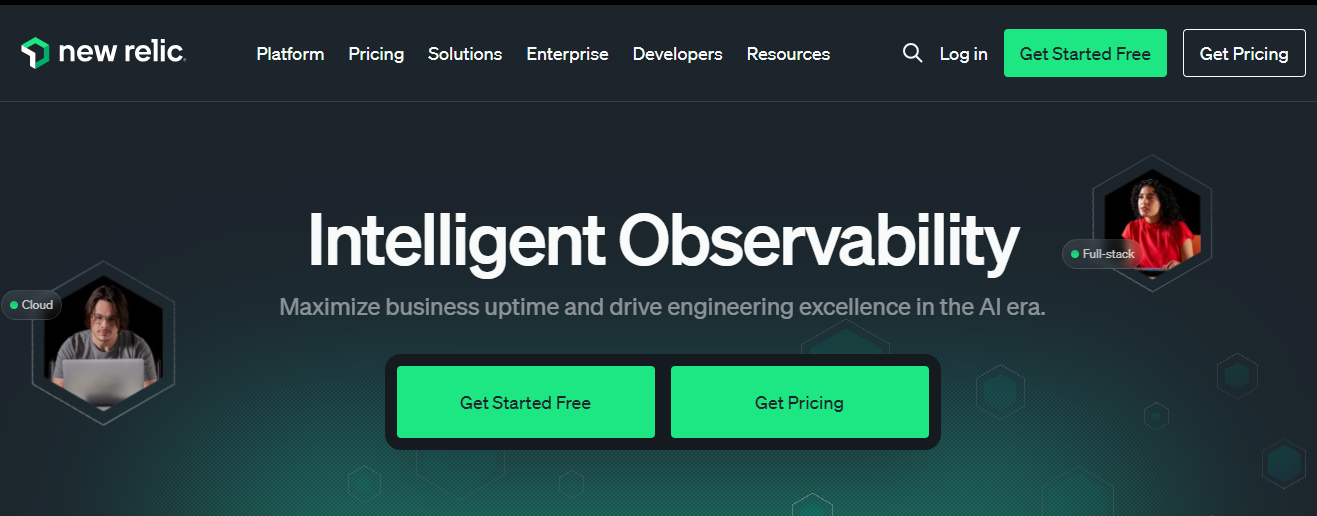
New Relic is a full-stack observability platform offering APM, infrastructure monitoring, logs, traces, and user experience insights for cloud-native applications.
Key Features
- Application Performance Monitoring (APM): Deep insights into application health and performance.
- Infrastructure Monitoring: Track server, container, and cloud resource utilization.
- Distributed Tracing: Visualize request flows across services.
- Logs in Context: Correlate logs with traces and metrics for faster troubleshooting.
- Real User Monitoring (RUM): Analyze end-user performance and experience.
Standout Features
- All-in-One Platform: Consolidates APM, infrastructure, logs, and RUM in a single UI.
- AI/ML-Powered Alerts: Detect anomalies and predict incidents.
- Wide Ecosystem: Strong integrations across cloud and DevOps pipelines.
Pros
- Rich feature set for enterprise observability.
- Mature ecosystem with pre-built dashboards.
- Flexible visualization and reporting.
Cons
- Expensive at scale, especially for teams ingesting terabytes of telemetry.
- Complex to configure and maintain for smaller teams.
- The learning curve is challenging
Best For
Enterprises needing comprehensive observability with advanced analytics, particularly those with large budgets and global teams.
Pricing & Customer Reviews
- Free Tier: 100GB/month ingested
- Pro plan: $0.40/GB ingested beyond the free 100GB limit
- Pro Plan: $349/user for full platform user
- G2 Rating: 4.4/5
New Relic vs Instatus
New Relic provides full-stack observability across applications, infrastructure, logs, and traces, giving teams deep visibility into system performance and reliability. Instatus focuses on uptime monitoring and status pages for communicating service health. New Relic is ideal for teams that need comprehensive monitoring and performance insights across complex environments.
4. Coralogix
Known For
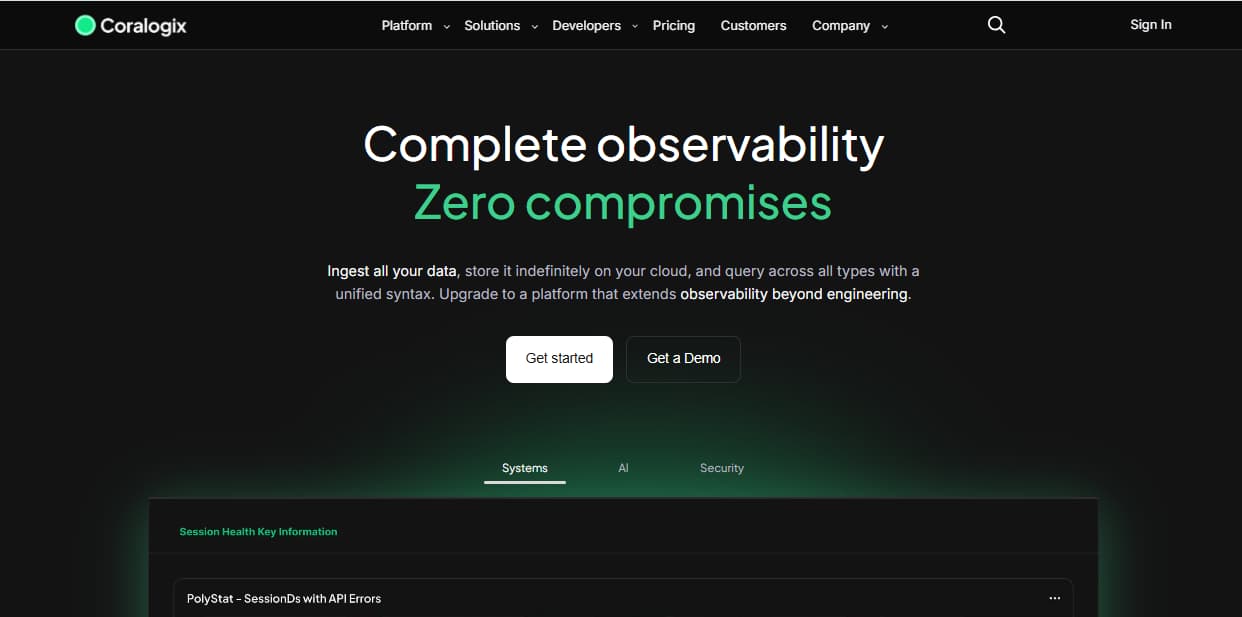
Coralogix is a log analytics and observability platform specializing in pipeline optimization, real-time dashboards, and cost control.
Key Features
- Log Analytics: Advanced querying, parsing, and alerting.
- Metrics & Traces: Supports monitoring across services and applications.
- Security Analytics: SIEM capabilities for threat detection.
- Data Tiering: Automatically classifies data into hot, warm, and archive tiers.
- Real-Time Dashboards: Visualize infrastructure and application health at scale.
Standout Features
- Log Lifecycle Management: Archived telemetry data is stored in the customer’s own cloud account, reducing storage costs.
- Pipeline Optimization: AI-powered parsing and enrichment to reduce noise.
- Compliance Support: Meets SOC2, GDPR, and other standards.
Pros
- Strong in log analytics and data pipeline efficiency.
- Flexible data tiering helps reduce costs.
- Good balance of observability + security use cases.
Cons
- Archived data still incurs public egress fees since data flows through Coralogix before archival.
- Users report a steep learning curve for beginners
- Overwhelming UI particularly for beginners
Best For
Organizations that prioritize log analytics and cost optimization, and want flexibility in retaining data in their own cloud.
Pricing & Customer Reviews
- Logs: $0.42 / GB
- Traces: $0.16 / GB
- Metrics: $0.05 / GB
- G2 rating: 4.6/5, praised for cost-saving data tiering and strong log analysis, but some users highlight egress costs and UI complexity.
Coralogix vs Instatus
Coralogix offers scalable log analytics, metrics, and observability tools that help teams analyze performance and troubleshoot issues with rich data insights. Instatus focuses on uptime monitoring and status pages for communicating service health. Coralogix is ideal for teams that need deep observability and log-driven insights across their systems.
5. Middleware
Known For
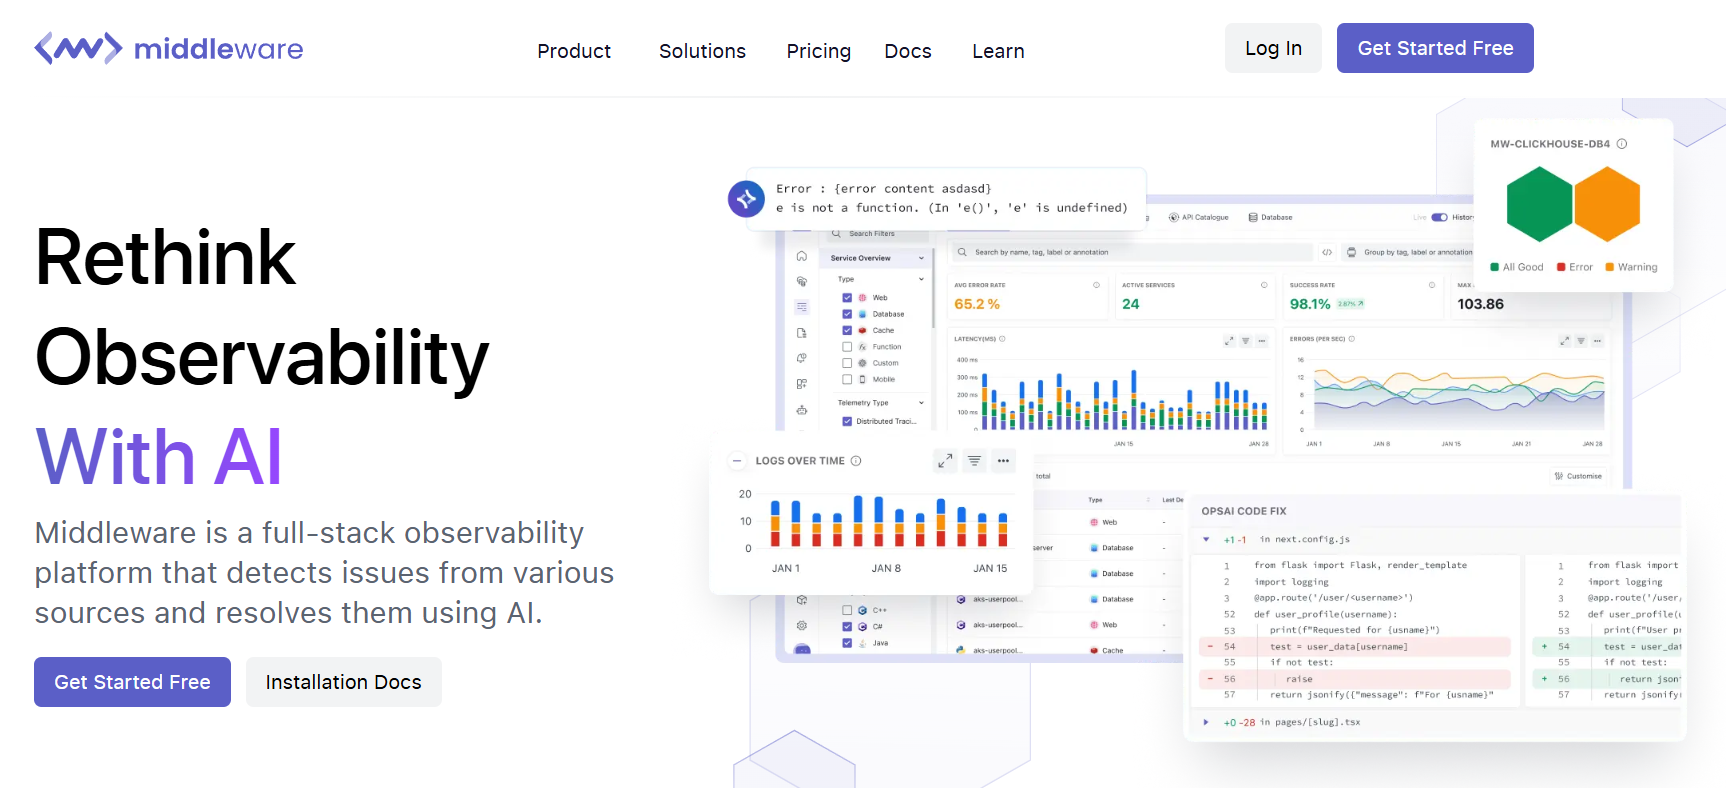
A modern observability and APM platform built for cloud-native teams, focusing on simplicity, performance visibility, and cost-effective monitoring.
Key Features
- Application Performance Monitoring (APM): Detect performance bottlenecks across services.
- Infrastructure Monitoring: Track CPU, memory, and resource health across servers and containers.
- Log Management: Collect, store, and search logs in real time.
- Alerts & Incident Management: Proactive alerting with integrations to Slack, PagerDuty, and Opsgenie.
- Synthetic Monitoring: Test critical endpoints and APIs to ensure uptime.
Standout Features
- All-in-One Observability: Combines APM, logs, metrics, and traces in a unified dashboard.
- Simple Onboarding: Lightweight setup for modern SaaS and cloud-native teams.
- Cost-Conscious Model: Transparent pricing designed for small and mid-sized teams.
Pros
- Easy to deploy and use compared to legacy tools.
- Unified monitoring without juggling multiple products.
- Integrates with modern CI/CD and DevOps pipelines.
Cons
- Intial learning curve is steep especially for new users
- Difficult configuration is a challenge
- Expensive as usage grows
Best for
Startups and mid-sized companies looking for affordable, all-in-one observability without the overhead of larger platforms.
Pricing & Customer Reviews
- Free: up to 100GB data, unlimited users, 14-day retention
- Pay as you go: $0.3 GB of metrics, logs, traces; 30-day retention
- Enterprise: Custom pricing
- G2 rating: 4.7/5, praised for ease of setup, intuitive interface, and strong customer support, though some reviewers cite UI complexity.
Middleware vs Instatus
Middleware is a full-stack observability platform that brings together metrics, logs, traces, and real-time monitoring to help teams understand performance and troubleshoot issues across their systems. Instatus focuses on uptime checks and status pages for communicating service availability. Middleware is ideal for teams that need deep visibility into application and infrastructure behavior rather than just uptime reporting.
6. Dynatrace
Known For
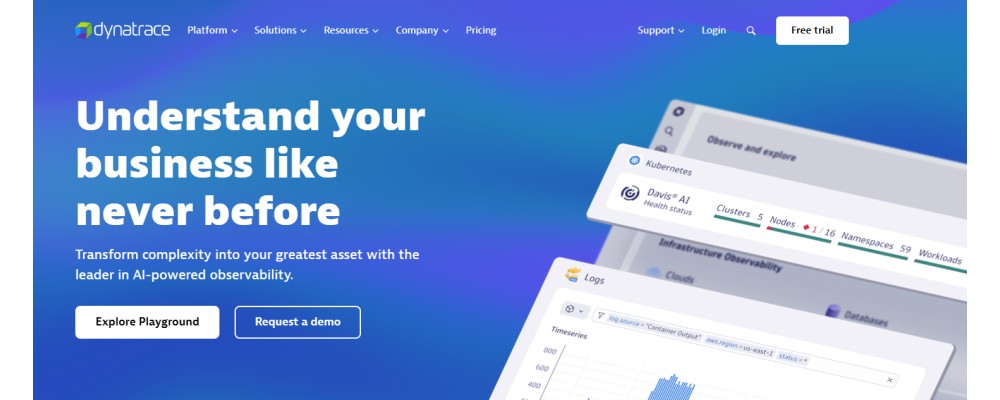
Dynatrace is an AI-powered enterprise observability platform offering full-stack monitoring, security, and automation for complex cloud and hybrid environments.
Key Features
- Application Performance Monitoring (APM): End-to-end performance visibility across microservices and applications.
- Infrastructure & Cloud Monitoring: Tracks servers, VMs, Kubernetes clusters, and multi-cloud environments.
- Distributed Tracing: Monitors dependencies and request flows across complex architectures.
- Davis AI Engine: Provides automated anomaly detection and root cause analysis.
- Security Monitoring: Runtime application self-protection (RASP) and vulnerability detection.
Standout Features
- AI-Powered Insights: Dynatrace’s Davis AI correlates billions of dependencies for real-time root cause detection.
- Wide Enterprise Coverage: Strong monitoring for hybrid, on-prem, and multi-cloud setups.
- Automation & Remediation: Tight integrations with CI/CD and self-healing workflows.
Pros
- Extremely comprehensive observability and automation.
- Enterprise-grade scalability for complex environments.
- Strong focus on security monitoring in addition to APM.
Cons
- High pricing: Licensing and ingestion costs add up quickly.
- Steep learning curve for new users.
- Complex setup and maintenance.
Best For
Large enterprises with hybrid or multi-cloud architectures, requiring AI-driven observability, automation, and security.
Pricing & Customer Reviews
- Infrastructure Monitoring: $29/month per host
- Full-Stack Monitoring: $58/month per 8 GiB host
- G2 rating: 4.5/5, praised for AI-powered automation and deep enterprise features, but criticized for cost and complexity.
Dynatrace vs Instatus
Dynatrace provides comprehensive observability across applications, infrastructure, and user experience with AI-driven insights and automated problem detection. Instatus focuses on uptime monitoring and status pages for communicating service availability. Dynatrace is ideal for teams that need deep performance analysis and proactive observability across complex environments.
7. Datadog
Known For
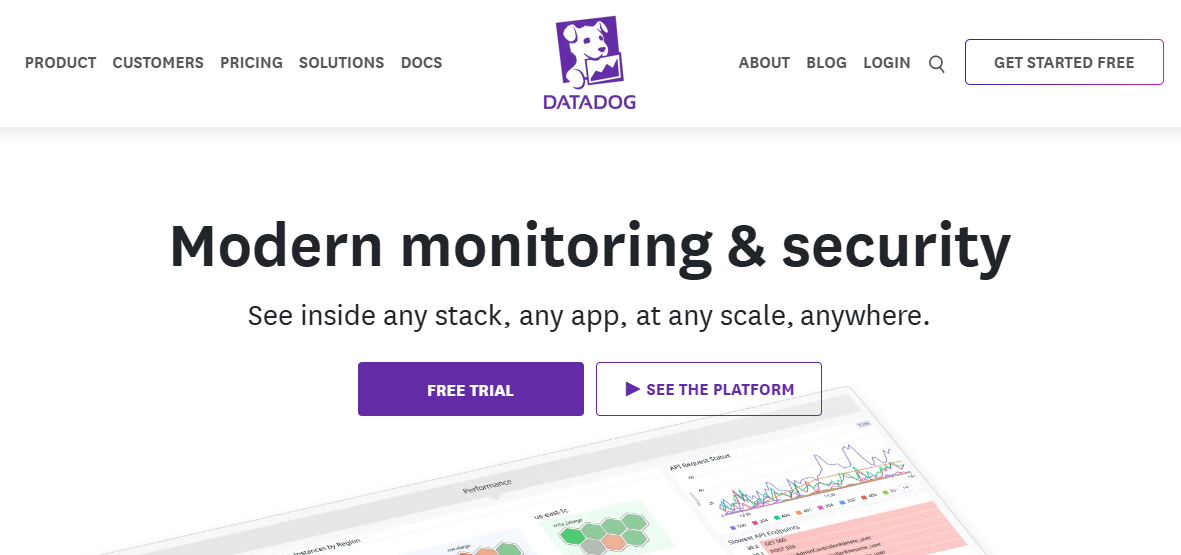
Datadog is a leading cloud-based observability and security platform, offering monitoring across infrastructure, applications, logs, and user experience.
Key Features
- Infrastructure Monitoring: Tracks hosts, containers, and cloud services.
- APM & Distributed Tracing: Visualizes application dependencies and request flows.
- Log Management: Collect, search, and analyze logs at scale.
- Real User Monitoring (RUM): Provides insights into frontend and end-user experiences.
- Synthetic Monitoring: Tests APIs and user journeys.
- Security Monitoring: Detects vulnerabilities and misconfigurations.
Standout Features
- Wide Ecosystem: 900+ integrations across cloud and DevOps stacks.
- Unified SaaS Platform: Single pane of glass for infra, APM, logs, RUM, and security.
- Scalability: Handles monitoring for thousands of hosts across enterprises.
Pros
- Comprehensive observability in one platform.
- Large ecosystem and marketplace of integrations.
- Mature enterprise adoption and community support.
Cons
- Complex and expensive pricing
- Hidden costs as usage grows
- Overwhelming UI for new users
Best For
Enterprises need broad observability across cloud-native and hybrid systems, with large budgets to handle unpredictable costs.
Pricing & Customer Reviews
- APM (Pro Plan): starts at $31/host/month
- Logs: $0.1/GB ingested/month
- Infrastructure starts at $15/host/month.
- G2 rating: 4.4/5, praised for rich feature set and integrations, but criticized for pricing complexity and support response times.
Datadog vs Instatus
Datadog delivers unified observability across applications, infrastructure, logs, and real-time metrics with rich dashboards and alerting. Instatus focuses on uptime monitoring and status pages for communicating service availability. Datadog is ideal for teams that need comprehensive monitoring and performance insights across their entire stack.
Conclusion
While Instatus is an excellent entry-level status page solution for startups and SaaS teams, the pricies can scale as usage grows. The alternatives we covered offer deeper monitoring capabilities, but they also come with trade-offs in cost, complexity, or compliance readiness.
Among them, CubeAPM stands out as the best Instatus alternative. With MELT coverage (Metrics, Events, Logs, Traces), OpenTelemetry-native support, flat-rate pricing at $0.15/GB, and on-prem compliance hosting, CubeAPM delivers the scalability and cost efficiency that both mid-sized companies and enterprises need. Unlike Instatus, it unifies customer communication with real observability, ensuring teams can not only update users but also detect, diagnose, and resolve issues faster.
For teams looking to evolve beyond simple status pages into true end-to-end observability without runaway costs, CubeAPM is the most practical and future-ready choice.
Disclaimer: The information in this article reflects the latest details available at the time of publication and may change as technologies and products evolve
FAQs
1. Why do teams outgrow Instatus?
Teams often outgrow Instatus because it’s limited to status pages and lacks APM, logs, traces, and compliance-ready hosting. This is where CubeAPM becomes a better fit, offering full-stack observability with predictable pricing.
2. What is the best alternative to Instatus for scaling SaaS companies?
Scaling SaaS companies need more than incident communication — they need root cause detection, tracing, and real-time monitoring. CubeAPM delivers all of this in one platform, making it a strong upgrade path.
3. Which Instatus alternative offers the best value for money?
Many status page tools are affordable, but costs spike when adding observability layers like APM and logs. CubeAPM solves this with flat $0.15/GB pricing, saving teams 60–80% compared to tools like Datadog or New Relic.
4. Are there Instatus alternatives that support OpenTelemetry?
Yes. OpenTelemetry has become the industry standard for instrumentation, but not all tools support it natively. CubeAPM is fully OTEL-compatible, ensuring seamless migration and avoiding vendor lock-in.
5. Can an Instatus alternative also improve incident resolution speed?
Yes. While Instatus only communicates outages, CubeAPM helps detect and diagnose issues in real time with tracing, logs, and error tracking. This means teams can resolve incidents faster instead of just reporting them.


