Amazon CloudWatch is tightly integrated with the AWS ecosystem, offering a unified monitoring experience across services like EC2, built-in dashboards, and alarm-based automation. Major issues such as metric latency, sluggish UI performance, and cost concerns are pushing individuals to seek alternative solutions.
CubeAPM is an excellent alternative to Amazon CloudWatch, offering over 800+ integrations and no egress fees. It covers full MELT (Metrics, Events, Logs, Traces), with smart sampling and seamless integration for distributed systems, RUM, synthetics, and infrastructure monitoring.
In this article, we’ll explore the top 7 Amazon CloudWatch alternatives in 2025. We’ll compare them across key criteria like OpenTelemetry support, and full MELT observability — so you can find the best fit for your team’s scale, budget, and compliance needs.
Top 8 Amazon CloudWatch Alternatives
- CubeAPM
- Datadog
- Dynatrace
- Coralogix
- Splunk Appdynamics
- New Relic
- Better Stack
- Sumo Logic
Why Look for Amazon CloudWatch Alternatives?
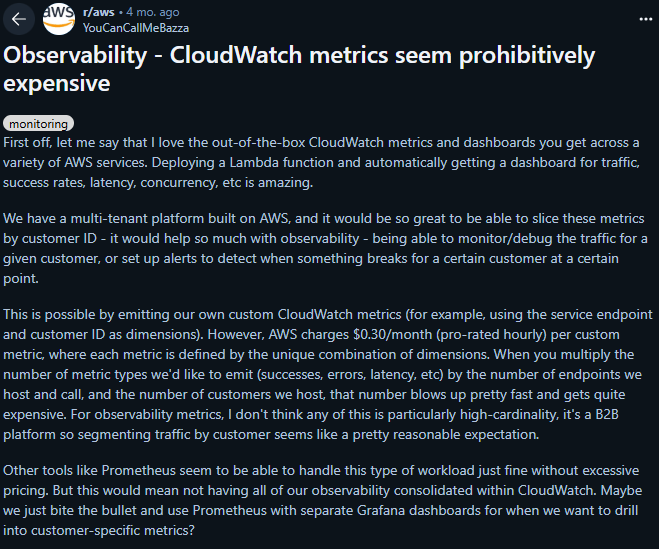
Image Source: Reddit
1. High and Unpredictable Costs at Scale
Amazon CloudWatch charges separately for ingestion, custom metrics, dashboards, API usage, and data storage. Costs grow rapidly as telemetry volumes increase — especially for high-frequency metrics or logs. Pricing complexity often results in unpredictable bills that are hard to optimize.
As one user notes:
“Cloudwatch is kinda expensive. That said, avoiding custom metrics might be a realistic option, depending on your solution (e.g. Deploying a diferent lambda per client)”(Reddit 2025)
2. Slow Performance
Amazon CloudWatch’s UI often feels sluggish and unresponsive, especially when loading dashboards with high-cardinality metrics or large log groups. Engineers report long render times, failed queries, and general friction during debugging workflows. These slowdowns not only hurt productivity but also force many teams to adopt third-party tools like Grafana for visualization. As a user notes:
“The graph feature … is very slow. It takes immense time to load basically due to the large data size.” — Verified G2 reviewer (G2)
3. Metric Latency & Troubleshooting Delays
Amazon CloudWatch doesn’t deliver metrics in real time, especially under high ingestion volumes. This delay can stretch incident detection by minutes and complicate autoscaling decisions. For fast-moving systems, these lags translate directly to longer MTTR and reduced reliability.
“Metric latency is the biggest pain point for me, for both scaling and troubleshooting.” — Reddit user (reddit)
4. Steep Learning Curve for Configuration
Configuring Amazon CloudWatch, especially for alarms, dashboards, and custom metrics, is often cited as complex, requiring a deep understanding of AWS infrastructure and query languages, which can be daunting for new users or non-technical teams. As a user notes:
“The CloudWatch console is the second best thing that I’ve used. It allows to monitor and alert about AWS services… The least helpful thing I came across is that it requires some learning to understand the data and interpret the logs, and other parameters.”(G2)
Criteria for Suggesting Amazon CloudWatch Alternatives
When evaluating CloudWatch alternatives, we considered tools that offer:
1. Native OpenTelemetry Support
Alternatives must support ingestion of OTEL-native telemetry across traces, metrics, and logs without needing translation or vendor-specific agents. This allows teams to avoid lock-in and ensure interoperability.
2. Full MELT Observability
The best alternatives offer Metrics, Events, Logs, and Traces (MELT) under one platform. Bonus if they also include RUM, synthetic monitoring, and error tracking for full visibility from infra to frontend.
3. Transparent and Predictable Pricing
CloudWatch’s pricing is fragmented and opaque. We prioritized platforms with clear per-GB or per-host pricing models that are easy to budget and scale. Real-world benchmarks showed savings of 60–80% for similar telemetry volumes when switching.
4. Smart Sampling
Tools with smart sampling retain only high-value telemetry based on latency, errors, or custom signals, reducing storage costs and improving visibility. CloudWatch’s lack of this feature results in noisy datasets.
5. Fast, Developer-Friendly UI and Alerting
We focused on platforms with faster performance, intuitive interfaces, and modern alerting (e.g., Slack-based, anomaly detection, or service maps) to reduce MTTR and improve engineering experience.
Amazon CloudWatch Overview
Known For
Amazon CloudWatch is primarily known as Amazon’s native monitoring and observability service for AWS infrastructure. It is widely used for tracking metrics, logs, alarms, and custom events across AWS services like EC2, Lambda, ECS, and RDS. CloudWatch is deeply integrated with the AWS ecosystem and serves as the default monitoring tool for most workloads deployed within it.
Standout Features
- Tight AWS Integration: Automatic telemetry collection from over 70 AWS services, with no additional configuration required.
- CloudWatch Alarms: Customizable thresholds and alarm-based automation tied to AWS services (e.g., auto-scaling).
- CloudWatch Logs Insights: SQL-like querying for log data with aggregation and filtering options.
- CloudWatch Contributor Insights: Detects high-impact contributors to performance issues (e.g., specific API calls, IPs).
- CloudWatch Application Signals (APM-lite): Lightweight APM with automatic span collection for some AWS-native services.
Key Features
- Metrics Collection: Collects standard and custom metrics across AWS services and applications.
- Log Aggregation & Analysis: Centralized log ingestion, with search and analysis capabilities via Log Insights.
- Dashboarding: Visual dashboards with custom graphs and widgets, linked to AWS data streams.
- Alarm System: Allows real-time alerting based on thresholds, anomaly detection, or composite conditions.
- EventBridge Integration: Seamlessly routes events and triggers automated workflows across AWS services.
Pros
- Native to AWS, no setup required for most services
- Highly reliable and horizontally scalable
- Granular access control using IAM
- Deep integration with AWS Lambda, EC2, EKS, RDS, and more
- Flexible alarm configuration and automation with EventBridge
Cons
- Complex User Interface
- High Costs at Scale: Custom metrics ($0.30/metric/month) and log ingestion ($0.50/GB)
- Steep Learning Curve: Configuring alarms, custom metrics, and OTEL integrations requires familiarity with AWS
- UI is slow, especially with large datasets
Best For
Cloud-native teams that are 100% committed to AWS and need basic monitoring and alerting without requiring deep APM, smart sampling, or cross-cloud observability. Best suited for DevOps teams already leveraging other AWS-native services.
Pricing & Customer ReviewsPricing:
- Logs ingestion: $0.50/GB
- Logs storage: $0.03/GB/month
- Metrics: $0.30/metric/month (first 10,000 metrics)
- RUM: ~$1 per 100,000 events (varies by region)
- Synthetics: $0.0012/run
- Application Signals (APM): Starts at $0.35/GB for the first 10TB
- G2 Score: 4.5/5
- Common praise: Tight AWS integration, reliability, scalability
- Common complaints: UI slowness, complex billing, slow performance
Top 8 Amazon CloudWatch Alternatives
1. CubeAPM

Known For
CubeAPM is a robust observability platform designed for enterprises, offering complete MELT coverage (Metrics, Events, Logs, Traces) with rapid data ingestion, compliance-friendly self-hosting, and a 60–80% reduction in total cost of ownership compared to traditional APM tools.
Key Features
- Intelligent Sampling: Context-driven sampling prioritizes high-value data (e.g., latency spikes, 5xx errors) while reducing noise, lowering ingestion volume, and costs.
- Real-Time Tracing & Metrics: Full distributed tracing paired with infrastructure and application metrics.
- Infrastructure Monitoring: Native support for AWS, Kubernetes, and Linux-based infrastructure metrics.
- Synthetic Monitoring & RUM: Emulates user interactions and tracks real-world frontend performance.
- Full OTEL and Prometheus Support: Ingests any telemetry data, avoiding vendor lock-in.
Standout Features
- Intelligent sampling ensures a high signal-to-noise ratio and efficient storage.
- On-premises hosting complies with data residency regulations and eliminates cloud egress fees.
- Unlimited user seats with flat, usage-based pricing—no per-user fees like New Relic or Datadog.
- Seamless migration from Datadog, New Relic, or Uptrace in under an hour.
- High-resolution dashboards with customizable MELT views and anomaly alerts.
- Zero cloud egress costs
Pros
- Up to 80% cost savings compared to Datadog, New Relic, and others.
- Intelligent sampling optimizes data retention and storage efficiency.
- Comprehensive MELT coverage, including logs, metrics, RUM, synthetics, and error tracking.
- Direct Slack/WhatsApp support from core engineers with rapid response times.
- Built for scalable, self-hosted observability.
Cons
- Not ideal for teams seeking cloud-only solutions.
- Focused solely on observability, lacking cloud security management features.
Best For
- Engineering teams prioritizing cost efficiency and telemetry control.
- Startups and mid-sized companies scaling quickly while managing budgets.
Pricing & Customer Reviews
- Pricing: Ingestion-based pricing at $0.15/GB.
- Rating: 4.7/5 (based on pilot programs, Slack feedback, and demos).
CubeAPM vs. Amazon CloudWatch
CubeAPM delivers full-stack, OpenTelemetry-native observability — including logs, metrics, traces, infrastructure, RUM, and synthetics — in a single, streamlined platform. Unlike Amazon CloudWatch, which charges separately for ingestion, storage, dashboards, and RUM, CubeAPM offers predictable pricing with no hidden fees. For teams seeking deep visibility, real-time performance, and transparent billing beyond the AWS ecosystem, CubeAPM is the clear choice.
2. Datadog
Known For
Cloud-native, all-in-one observability platform with extensive integrations across the DevOps ecosystem. Datadog is a leading SaaS observability solution, offering infrastructure monitoring, APM, log analytics, and security monitoring within a unified control plane, widely adopted for its robust feature set.
Key Features
- Infrastructure Monitoring: Agent-based metrics for hosts and containers with pre-built dashboards.
- Application Performance Monitoring (APM): Distributed tracing across services, databases, and APIs.
- Log Management: Centralized log collection with Live Tail and search functionality.
- Security Monitoring: Real-time detection of vulnerabilities and compliance issues.
- Synthetic Monitoring & RUM: Simulates user journeys and monitors real frontend performance.
- Custom Dashboards & Alerting: Advanced visualization with threshold, anomaly, and composite alerts.
Standout Features
- Over 900 integrations with tools like AWS, Kubernetes, Jenkins, and GitHub.
- Watchdog AI engine automatically detects anomalies and trends.
- Unified platform for logs, infrastructure, APM, RUM, and security in one interface.
- High scalability for large, multi-region deployments with real-time metrics.
Pros
- Feature-rich and mature across all observability domains.
- Strong support for multi-cloud and containerized environments.
- User-friendly dashboards, AI-driven alerts, and comprehensive documentation.
- Seamless integration with modern CI/CD pipelines.
Cons
- Costly at scale due to fragmented pricing for ingestion, hosts, events, and features.
- Steep learning curve required to utilize Datadog features
- Complex setup and integration process
Best For
- Enterprises needing a comprehensive DevOps observability solution, particularly in cloud-native ecosystems.
- Teams with substantial budgets prioritizing ready-to-use integrations and dashboards.
Pricing & Customer Reviews
- APM (Pro Plan): starts at $31/host/month
- Logs: $0.1/GB ingested/month
- Infrastructure starts at $15/host/month.
- G2 Review Rating: 4.4/5.
- Users commend Datadog’s extensive features and integrations but criticize its complex pricing, overages, and vendor lock-in. Performance slowdowns at high volumes are also noted.
Datadog vs. Amazon CloudWatch
Amazon CloudWatch is ideal for teams heavily invested in AWS, offering native metrics, logs, alarms, and dashboards with minimal setup, but it becomes limited for cross-cloud visibility and deeper APM needs. Datadog, on the other hand, delivers richer full-stack observability, advanced dashboards, and broader integrations across multi-cloud and hybrid environments, though it typically comes at a higher cost. CloudWatch is simpler and AWS-focused, while Datadog is more powerful and versatile for complex, distributed systems.
3. Dynatrace
Known For
AI-powered, full-stack observability and automation for large-scale enterprise environments. Dynatrace is a premium observability platform renowned for its AI-driven insights (Davis engine), automatic discovery, and deep code-level diagnostics, popular among enterprises with complex hybrid cloud setups.
Key Features
- Davis AI Engine: Automatically correlates metrics, traces, and logs to identify and predict anomalies.
- Full-Stack Monitoring: Unified visibility from infrastructure to user experience, including synthetics, RUM, and logs.
- Automatic Dependency Mapping: Discovers services, APIs, databases, and their relationships automatically.
- Log Management & Indexing: Context-aware log ingestion with dynamic sampling and indexing.
- Cloud-Native Support: Robust support for Kubernetes, serverless, and multi-cloud environments.
- Code-Level Tracing & Insights: Detailed execution path and bottleneck analysis for JVM, .NET, Node.js, and more.
Standout Features
- Zero manual configuration with fully automated instrumentation and discovery.
- AI-driven root cause analysis, reducing mean time to resolution (MTTR).
- Business KPI monitoring integrated into observability workflows.
- Application Security Module for vulnerability detection.
Pros
- Scalable for enterprise-grade environments with strong automation.
- Highly detailed tracing and performance diagnostics.
- Real-time anomaly detection with minimal tuning.
- Seamless support for hybrid cloud and distributed tracing.
Cons
- Steep learning curve
- Expensive and challenging, especially for smaller teams and businesses
- The UI feels overwhelming for most users
- High cost, especially when operations scale
Best For
- Large enterprises and Fortune 500 companies needing automated observability at scale.
- Teams seeking predictive diagnostics beyond basic monitoring.
Pricing & Customer Reviews
- Infrastructure Monitoring: $29/month per host
- Full-Stack Monitoring: $58/month per 8 GiB host
- G2 Review Rating: 4.4/5.
- Users praise the automation and Davis AI but highlight pricing opacity, a steep learning curve, and rigid agent-based instrumentation as drawbacks.
Dynatrace vs. Amazon CloudWatch
Dynatrace delivers deep, automated full-stack observability with AI-driven root-cause analysis across hybrid and multicloud environments, while Amazon CloudWatch is mainly a native AWS monitoring tool focused on basic metrics, logs, and alarms. Amazon CloudWatch is simpler and AWS-centric, whereas Dynatrace offers far richer APM visibility but at a higher cost.
4. Coralogix
Known For
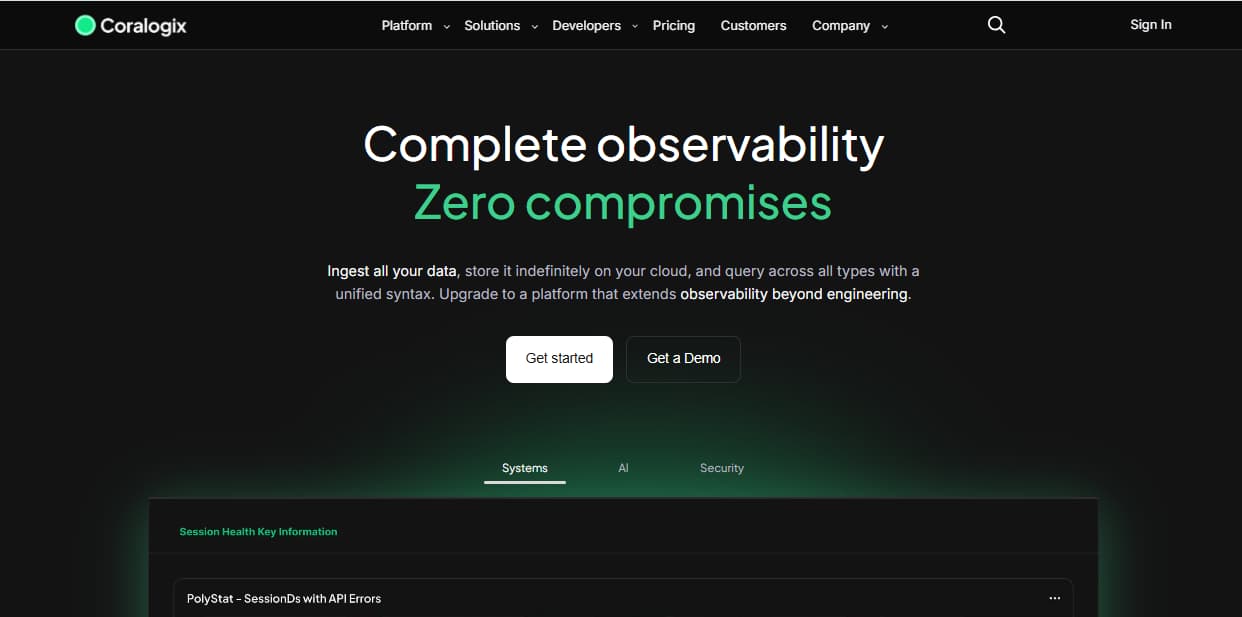
Full-stack observability with real-time stream processing and customizable data routing. Coralogix is a contemporary observability platform emphasizing log analytics and cost optimization. Its proprietary Streama™ architecture enables real-time parsing and routing of logs, metrics, and traces before storage, making it a top choice for teams prioritizing control over data ingestion.
Key Features
- Streama™ Architecture: Processes telemetry in real time, allowing routing decisions before indexing to reduce costs.
- Log Management: Scalable log ingestion with flexible parsing, tagging, and pipeline customization.
- Metrics & Traces: Supports metrics and distributed tracing through OpenTelemetry integration.
- Dynamic Data Routing: Filters data to archive, monitor, or discard based on rules, minimizing storage expenses.
- Built-in Dashboards & Alerting: Pre-configured views for ELK, Kubernetes, and serverless environments.
- Compliance & Archival: Stores archived data in the customer’s cloud account (e.g., S3, GCS).
Standout Features
- Unique routing logic significantly lowers ingestion costs.
- Archived data stored in the customer’s cloud, reducing long-term storage expenses.
- Real-time log tailing, full-text search, and correlation for rapid investigations.
- Certifications for ISO, GDPR, SOC 2, and other compliance standards.
Pros
- Ideal for log-intensive environments like Kubernetes or CI/CD pipelines.
- Advanced customization for log pipelines and filtering.
- Robust OpenTelemetry support for traces and metrics.
- Cost-efficient through real-time filtering and dynamic routing.
Cons
- Users report a steep learning curve for beginners
- Overwhelming UI particularly for beginners
- Archived telemetry incurs egress charges from Coralogix before reaching the customer’s archive
Best For
- Teams handling high log volumes and needing precise control over storage.
- Organizations prioritizing compliance and cost-effective log retention.
Pricing & Customer Reviews
- Logs: $0.42 / GB
- Traces: $0.16 / GB
- Metrics: $0.05 / GB
- G2 Review Rating: 4.6/5.
- Customers praise the streaming-first architecture and cost flexibility but note a steep learning curve, and overwhelming UI for beginners.
Coralogix vs. AWS CloudWatch
5. Splunk AppDynamics
Known For
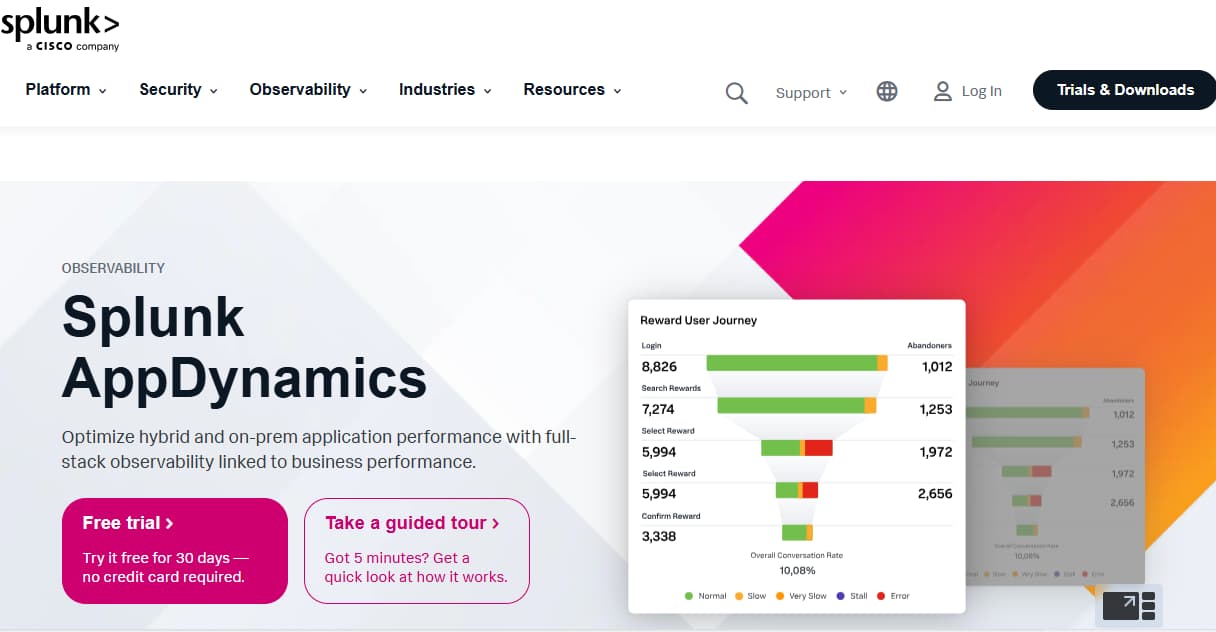
Splunk AppDynamics is an enterprise-grade APM with in-depth application diagnostics and business transaction monitoring. Integrated into Splunk’s observability suite after Cisco’s AppDynamics acquisition, Splunk AppDynamics targets large organizations needing detailed performance insights tied to business KPIs.
Key Features
- Business Transaction Monitoring: Tracks complete transaction flows across services and infrastructure.
- Application Performance Management (APM): Provides detailed performance metrics and root-cause diagnostics for application components.
- Infrastructure Visibility: Links application performance to underlying server, container, and cloud metrics.
- Custom Dashboards & Health Rules: Alerts based on business outcomes, user experience, and SLAs.
- Synthetic Monitoring: Proactively identifies performance bottlenecks by simulating user interactions.
- Code-Level Diagnostics: Visualizes code traces and method-level insights for Java, .NET, PHP, and Node.js.
Standout Features
- Strong application-to-business KPI mapping, aligning IT and business goals.
- Tag-based smart alerting and SLA tracking integrated into the UI.
- Deep diagnostics for monoliths and legacy architectures.
- Enhanced by Splunk’s observability stack for broader log and infrastructure visibility.
Pros
- Ideal for transaction-heavy applications like e-commerce or financial platforms.
- Highly granular performance insights at method, class, and tier levels.
- Business-focused alerting with SLA and KPI correlation.
- Leverages Splunk’s ecosystem for advanced logging and SIEM.
Cons
- Complex setup and configuration, especially for custom instrumentation.
- High costs for full-stack deployment, including APM, infrastructure, and synthetics.
- UI feels overwhelming especially for beginners
Best For
- Large enterprises with Java/.NET applications needing business-centric APM.
- Teams using Splunk for logs or SIEM, seeking a unified ecosystem.
Pricing & Customer Reviews
- AppDynamics APM: starts at $33/month/CPU core
- Infra Monitoring: starts at $6/month/CPU core
- G2 Review Rating: 4.3/5.
Splunk AppDynamics vs. Amazon CloudWatch
Splunk AppDynamics is a full-stack application performance monitoring and observability platform that provides deep insights into application performance, root-cause analysis, user experience, and business impact across hybrid environments, while AWS CloudWatch is AWS’s native monitoring service focused on collecting and visualizing metrics, logs, events, and alarms primarily for AWS resources. AppDynamics delivers richer APM and cross-environment analysis, whereas CloudWatch is simpler and tightly integrated within the AWS ecosystem.
6. New Relic
Known For
A usage-based, comprehensive observability platform covering APM, infrastructure monitoring, logs, RUM, synthetics, and mobile telemetry. New Relic is recognized for its unified Telemetry Data Platform (TDP) and NRQL-powered dashboards, offering end-to-end observability.
Key Features
- Full MELT Observability: Supports metrics, events, logs, traces, RUM, synthetics, and error tracking in a single UI.
- Telemetry Data Platform (TDP): Centralized ingestion and query engine for OTEL, Prometheus, and custom agents.
- Dashboards & NRQL Analytics: Real-time querying and flexible dashboards using New Relic Query Language (NRQL).
- RUM, Synthetics, and Mobile Monitoring: Detailed browser, mobile performance, and uptime monitoring.
- Integrations & Auto-Instrumentation: Auto-instrumentation for multiple languages and platforms, with AWS, Azure, and Kubernetes support.
Standout Features
- Telemetry Data Lake for unified storage and querying of logs, metrics, and traces.
- Rich NRQL-powered dashboards for deep telemetry analytics.
- Comprehensive MELT support in a single suite, though some features require New Relic agents.
Pros
- End-to-end observability with a unified interface.
- Flexible ingestion of OpenTelemetry and Prometheus data.
- Strong frontend (RUM) and mobile observability.
- Easy onboarding with auto-instrumentation for many languages.
- Mature alerting, SLOs, and anomaly detection.
Cons
- Users find the pricing complex and expensive
- The learning curve is challenging
- Complex initial setup
Best For
- Mid-to-large DevOps teams seeking quick setup, rich dashboards, and all-in-one observability, comfortable with cloud-only, usage-based pricing.
Pricing & Customer Reviews
- Free Tier: 100GB/month ingested
- Pro plan: $0.40/GB ingested beyond the free 100GB limit
- Pro Plan: $349/user for full platform user
- G2 Rating: 4.4/5.
New Relic vs. Amazon CloudWatch
New Relic is a full-stack observability platform that offers deep application performance monitoring (APM), distributed tracing, real-user monitoring, advanced analytics, and support for multi-cloud and hybrid environments. AWS CloudWatch is AWS’s native monitoring service focused on collecting metrics, logs, events, alarms, and basic dashboards primarily for AWS resources. New Relic provides broader, richer observability across applications and environments, while CloudWatch is simpler and tightly integrated with AWS infrastructure.
7. Better Stack

Known For
Log and uptime monitoring with intuitive dashboards and developer-friendly UX. BetterStack (formerly Better Uptime) integrates log monitoring, incident alerting, and uptime checks with sleek, modern dashboards, ideal for developers needing lightweight observability with minimal setup.
Key Features
- Uptime Monitoring: HTTP, ping, port, and SSL checks with on-call schedules and status pages.
- Log Management: Logging platform with SQL-like search, alerting, and retention controls.
- Incident Management: On-call scheduling, incident tracking, and escalation workflows.
- Team Collaboration: Integrations with Slack, MS Teams, and email for rapid alert routing.
- Custom Dashboards: Modern UI with Markdown support and status reporting.
- Developer Experience: Quick onboarding with YAML config and Git-based alert workflows.
Standout Features
- Exceptionally clean UI, perfect for startups and indie teams.
- Combines uptime monitoring and log management in one product.
- Free plan with generous limits for basic monitoring.
- Status pages, incident logs, and alerts for public communication.
Pros
- User-friendly with no steep learning curve.
- Ideal for frontend, APIs, and external service uptime monitoring.
- Fast log search with real-time alerting.
- Simple, elegant dashboards for public or internal status pages.
Cons
- Steep learning curve especially for understanding SQL for log aggregation
- Users highlight missing features such as outgoing webhooks
- Expensive especially for small teams and startups
Best For
- Solo developers, startups, and small teams needing basic monitoring and logs.
- Teams seeking a better alternative to Pingdom or basic uptime checkers.
Pricing & Customer Reviews
- Free tier: Includes 10 monitors, 1 static page, 3 GB logs (3-day), 2B metrics points (30-day), 1 or more responders using Slack/phone/SMS.
- Paid plans: Start at $29/user/month, including one responder license and unlimited users, with bundles for telemetry and incident capabilities.
- G2 Review Rating: 4.6/5.
- Developers praise the UX and simplicity but note the lack of deep APM or observability features.
Better Stack vs. Amazon CloudWatch
BetterStack is a simple, unified SaaS observability and incident management tool that focuses on uptime monitoring, logs, alerting, and on-call workflows with an easy setup and clean UI, while AWS CloudWatch is AWS’s native monitoring service for collecting metrics, logs, events, dashboards, and alarms across AWS resources. CloudWatch is tightly integrated with AWS and useful for infrastructure monitoring, whereas BetterStack excels at straightforward uptime/incident/log insights and alerting outside or alongside AWS.
8. Sumo Logic

Known For
Cloud-native log analytics with integrated security, metrics, and monitoring for enterprise DevSecOps. Sumo Logic is a SaaS-based observability and SIEM platform providing unified visibility across logs, metrics, and security analytics, widely used by enterprises needing compliance-ready cloud observability for AWS, GCP, and Azure.
Key Features
- Log Management & Analytics: Robust search and correlation engine for real-time log ingestion and visualization.
- Metrics Monitoring: Tracks system and application-level metrics with custom dashboards and alerts.
- Cloud-Native Integrations: Deep support for Kubernetes, AWS, Azure, GCP, and serverless environments.
- Security Analytics (SIEM): Includes threat detection, compliance audits, and incident response.
- Dashboards & Alerting: Pre-built content packs, alerts, and customizable dashboards.
- Machine Learning Insights: Identifies anomalies, outliers, and trends using predictive models.
Standout Features
- Comprehensive platform for observability and security, ideal for DevSecOps.
- SOC 2, GDPR, HIPAA compliance readiness.
- Query-based log search and visualization, comparable to Splunk and ELK.
- Real-time correlation across telemetry and security events.
Pros
- Strong log analysis and compliance tools.
- Scalable for large, multi-cloud environments.
- Integrated security and observability workflows.
- Extensive pre-built dashboards for common services.
Cons
- Expensive, tiered pricing, especially for long-term retention and high ingestion.
- No native OpenTelemetry pipeline, limiting OTEL flexibility.
- Limited tracing support, requiring significant setup for full APM.
- SaaS-only, raising data residency concerns with no self-hosting option.
Best For
- Enterprises with strong security and compliance needs.
- Teams committed to SaaS infrastructure and log-centric workflows.
Pricing & Customer Reviews
- $3.14 per TB scanned.
- G2 Review Rating: 4.2/5.
- Customers appreciate the security integrations and scalable log management but cite high costs, rigid plans, and limited tracing as reasons to explore alternatives.
Sumo Logic vs. Amazon CloudWatch
Sumo Logic is a cloud-native analytics and observability platform that provides stronger log search, pattern detection, multi-cloud visibility, and richer dashboards, while AWS CloudWatch is AWS’s native monitoring tool focused on collecting metrics, logs, events, and alarms primarily for AWS resources. CloudWatch is tightly integrated with AWS and works well for basic infrastructure monitoring, but Sumo Logic offers deeper log analytics, broader integrations, and better cross-environment troubleshooting capabilities.
Conclusion: Choosing the Right Amazon CloudWatch Alternative
As engineering teams scale and adopt modern DevOps practices, many are finding that Amazon CloudWatch’s steep learning curve, limited UX, and AWS-only architecture no longer meet their evolving observability needs.
Why CubeAPM Leads the Pack
Among all CloudWatch alternatives, CubeAPM stands out with its OpenTelemetry-native architecture, full MELT stack coverage (metrics, logs, traces, synthetics, RUM), and intelligent sampling that significantly reduces cost and noise. With transparent, per-GB pricing, no per-user or retention fees, and support for on-premise deployments, CubeAPM is purpose-built for teams that demand speed, compliance, and complete observability without vendor lock-in.
Whether you’re outgrowing CloudWatch’s limitations or looking to consolidate your toolchain under a modern observability platform, CubeAPM delivers the performance, clarity, and savings your team needs — all in one place.
Disclaimer: The information in this article reflects the latest details available at the time of publication and may change as technologies and products evolve
FAQs
1. What are the best alternatives to Amazon CloudWatch for full-stack observability?
Leading alternatives include CubeAPM, Datadog, New Relic, Dynatrace, Sumo Logic, SigNoz, and Coralogix. Among them, CubeAPM offers a complete MELT stack (metrics, events, logs, traces), native OpenTelemetry support, and a simple per-GB pricing model — making it ideal for teams seeking deep visibility without the complexity of AWS billing.
2. Why do companies switch from Amazon CloudWatch to other observability tools?
Teams often move away from CloudWatch due to sluggish dashboards, metric latency, lack of smart sampling, and unpredictable pricing. Other tools offer faster troubleshooting, better data correlation, and support for self-hosting or hybrid environments. CubeAPM, for example, solves many of these pain points with blazing-fast UIs, full OTEL support, and transparent billing.
3. Is CubeAPM more cost-effective than Amazon CloudWatch?
Yes. Amazon CloudWatch charges separately for log ingestion, storage, metrics, RUM, and more — leading to unpredictable monthly bills. CubeAPM offers flat per-GB pricing with no added fees for users, retention, or dashboard usage. For teams ingesting high volumes of telemetry, CubeAPM can reduce costs by 60–80% compared to CloudWatch.
4. Does Amazon CloudWatch support OpenTelemetry natively?
Partially. While AWS offers OpenTelemetry agents, CloudWatch does not provide full native OTEL support — meaning semantic context is often lost, and dashboard correlation is limited. Tools like CubeAPM are built around OpenTelemetry, preserving span context, attributes, and enabling vendor-neutral instrumentation.
5. Can Amazon CloudWatch be used for real user monitoring (RUM) and synthetic monitoring?
Only partially. CloudWatch offers RUM and synthetic monitoring through separate paid services (CloudWatch RUM and Synthetics), and pricing scales with usage. In contrast, platforms like CubeAPM bundle RUM and synthetics with no additional charges, offering a more integrated and cost-efficient solution for end-user experience monitoring.


