Highlight.io is a full-stack observability platform that brings together session replay, error monitoring, logs, and traces, allowing teams to correlate real user behavior with backend performance issues. However, teams encounter operational overhead on the self-hosted option and high costs as usage and data volumes scale.
CubeAPM is the best alternative to Highlight.io, providing unified full-stack observability across logs, metrics, and traces with a simpler operational model and predictable usage-based pricing. It is designed to scale cleanly as data volumes grow, without increasing management overhead or cost complexity.
In this article, we’ll explore the top 7 alternatives to Highlight.io, evaluating each based on key features, pricing, pros and cons, and use cases.
Top 7 Highlight.io Alternatives
- CubeAPM
- Dynatrace
- Coralogix
- DataDog
- New Relic
- Amazon CloudWatch
- Solarwinds
Why Look for Highlight.io Alternatives?
Although Highlight.io is a strong tool for frontend-backend observability correlation, several common limitations are pushing teams to evaluate alternatives:
1. High Cost When Data Volumes Grow
High cost is a major issue, especially in high-traffic environments. The prices can be high, which poses a significant challenge for startups and businesses operating on a tight budget.
2. Operational Overhead At Scale
As usage grows, teams may face increased operational effort in managing data ingestion, retention, and performance tuning—especially when running self-hosted components or handling high volumes of sessions, logs, and traces. This can result in additional maintenance overhead compared to more managed observability platforms.
Criteria for Suggesting Highlight.io Alternatives
To ensure teams find the right observability tool for their needs, we’ve evaluated alternatives to Highlight.io based on the following nine criteria:
1. Native OpenTelemetry (OTEL) Support
OpenTelemetry is now the industry standard for telemetry data collection. Tools that offer native OTEL support make it easier for teams to avoid vendor lock-in and standardize instrumentation across languages and services. A strong alternative to Highlight.io must allow seamless ingestion of OTEL-based traces, metrics, and logs, ideally with prebuilt exporters, minimal translation overhead, and full semantic support.
2. Full MELT Stack Coverage (Metrics, Events, Logs, Traces)
Modern observability goes beyond just tracing or error monitoring—it requires unified visibility across the entire MELT stack. A proper alternative should provide end-to-end coverage across application metrics, distributed traces, infrastructure logs, and event-based alerts. This unified view helps teams reduce MTTR, correlate incidents faster, and avoid context switching between disconnected tools.
3. Flexible Deployment Models (SaaS + Self-hosted)
Teams operating in regulated industries or with strict data residency requirements need deployment flexibility. A strong Highlight.io alternative should support both managed SaaS and self-hosted/on-premises options—including air-gapped or private cloud setups. This allows enterprises to stay compliant with HIPAA, GDPR, or SOC 2 while retaining control over sensitive telemetry data.
4. Advanced Alerting & Automation (SLOs, Routing, Deduplication)
Highlight.io’s alerting capabilities are basic and not suited for complex NOC or on-call workflows. An ideal alternative should support SLO-based alerting, noise suppression, deduplication, and routing by ownership or severity. Additionally, it should offer integrations with tools like PagerDuty, Opsgenie, and Slack to power real-time incident workflows and reduce alert fatigue.
Highlight.io Overview
Known For
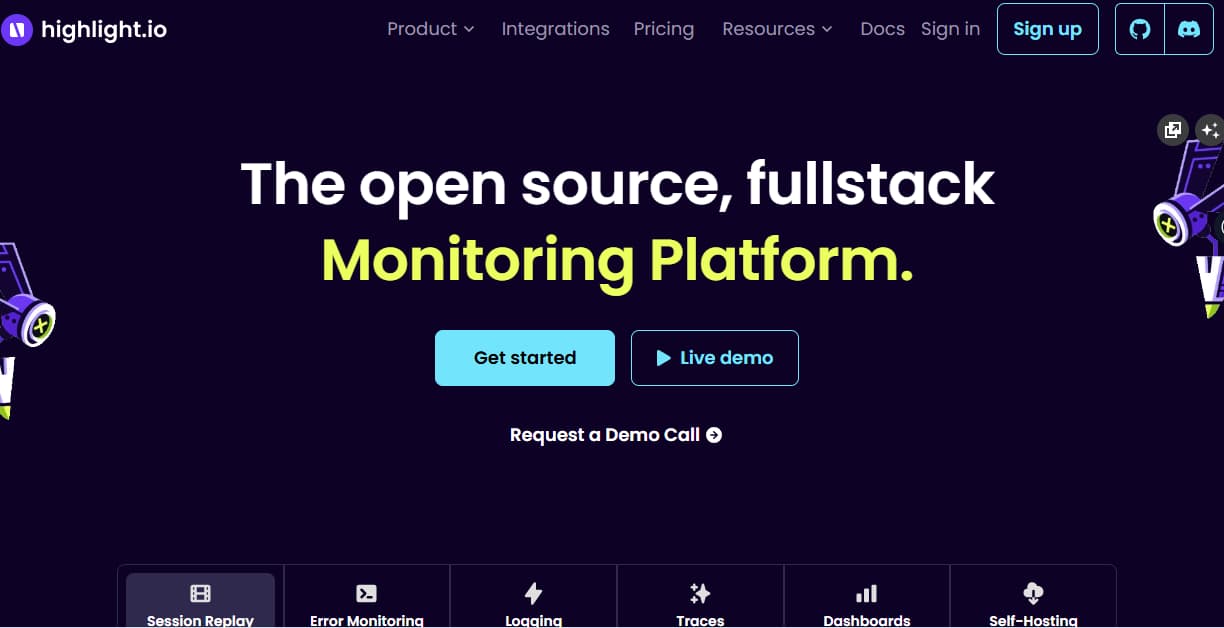
Highlight.io is primarily known for providing developers with a full-stack observability experience by connecting frontend session replays with backend traces and logs. It is widely adopted by modern web teams looking to understand user behavior, capture frontend performance issues, and trace backend bottlenecks—all from a single timeline. Highlight.io’s tight integration with OpenTelemetry makes it especially appealing for teams seeking an open-source and developer-friendly alternative to tools like LogRocket, Sentry, and DataDog.
Standout Features
- Session Replay with Contextual DevTools: Highlight.io records user sessions and overlays browser DevTools information, including network requests, console logs, and state changes—providing rich context for debugging.
- End-to-End Tracing with OTEL: With built-in support for OpenTelemetry, Highlight.io allows teams to trace requests across microservices and correlate them with frontend interactions.
- Real-Time Event Timeline: Combines RUM, logs, and traces into a unified chronological view to accelerate root cause analysis during incidents.
Key Features
- Real User Monitoring (RUM): Measures frontend performance metrics like Time to First Byte, LCP, and interaction delay across actual user sessions.
- Error Monitoring (Frontend & Backend): Captures JavaScript exceptions, API errors, and server-side faults with full stack traces and contextual metadata.
- Log Ingestion:
Collects logs from browser and server environments, correlating them with trace IDs and session data. - Distributed Tracing: Native OpenTelemetry support enables visibility across backend services with span visualizations and custom attributes.
- Self-Hosting Support: Provides installation options via Docker Compose or Kubernetes for teams needing control over data storage and compliance.
Pros
- Seamless correlation between frontend replays, logs, and backend traces
- Intuitive interface built for developers and product engineers
- OpenTelemetry-native instrumentation for backend tracing
- Self-hosted deployment available under open-source licensing
- Integrated browser DevTools context within session replays
Cons
- Steep learning curve
- High costs as operations scale
- UI can be overwhelming for beginners
Best For
Highlight.io is well-suited for frontend-focused teams, startups, and solo developers building SPAs or modern web applications with React, Vue, or Next.js. It’s ideal for teams that prioritize visual debugging and need a quick, unified view of client-side and server-side behavior without adopting a complex enterprise observability stack.
Pricing & Customer Reviews
- Free Plan: Includes up to 500 monthly sessions and 1,000 errors per month
- Pay-as-you-go: $50/month
- Business: $800/month
- Enterprise: Custom-based
- Highlight.io is rated 4.5/5 on G2
- Users appreciate its clean UI and seamless frontend-backend observability. Some reviewers note a steep learning curve.
Top 7 Highlight.io Alternatives
1. CubeAPM

Known For
CubeAPM is a comprehensive, OpenTelemetry-native APM platform built with a focus on cost efficiency, trace sampling intelligence, compliance support, and ultra-fast ingestion. It caters to engineering teams seeking full-stack observability with predictable pricing and deployment control—without locking into inflexible architectures or vendor fees.
Key Features
- Full MELT Stack Support: Native support for metrics, events, logs, and traces—plus RUM, synthetics, and error tracking—integrated into a single dashboard.
- Smart Sampling: Automatically prioritizes high-value traces using contextual logic, unlike platforms that store everything or rely on basic filters.
- Deployment Control: Self-host in your own cloud or on-prem to meet GDPR, HIPAA, or India’s DPDP requirements—no telemetry leaves your infrastructure.
- Fast Setup & Agent Compatibility: Supports existing agents from Datadog, OTEL, Prometheus, and New Relic—allowing for rapid migration with minimal rework.
Standout Features
- $0.15/GB flat-rate pricing
- Wide integration ecosystem, 800 + integrations
- AI-driven Smart Sampling for trace optimization
- Direct Slack support with engineering
- Prebuilt dashboards for AWS, Kubernetes, Lambda, RDS, and more
- SaaS and on-premise hosting options
Pros
- Native OTEL with full-stack visibility
- Large integration ecosystem, +900 integrations
- No cloud egress costs
- Predictable pricing model with no hidden charges
- 2–4x faster telemetry ingestion
- Ideal for compliance-sensitive workloads
- Auto-instrumentation for cloud-native tech
Cons
- Not suited for teams looking for off-prem solutions
- Strictly an observability platform and does not support cloud security management
Best For
Startups, growing engineering teams, and cost-conscious enterprises needing observability without overpaying or losing control over data residency.
Pricing & Customer Feedback:
Pricing: $0.15/GB data ingestion (flat, no per-user/host fees)
Rating: 4.7/5 (based on pilots, user feedback, and Slack community insights)
Praise for: Developer-first UI, transparent cost model, effective sampling
Criticism: Smaller ecosystem and plugin library compared to Datadog
CubeAPM vs Highlight.io
CubeAPM and Highlight.io both provide full-stack observability across logs, metrics, and traces, but they differ in how they approach scale and operations. Highlight.io emphasizes session replay–driven debugging and developer workflows, while CubeAPM focuses on unified observability with a simpler operational model and predictable usage-based pricing as data volumes grow. For teams looking to scale observability without increasing management overhead or cost complexity, CubeAPM is the better choice.
2. Dynatrace
Known For
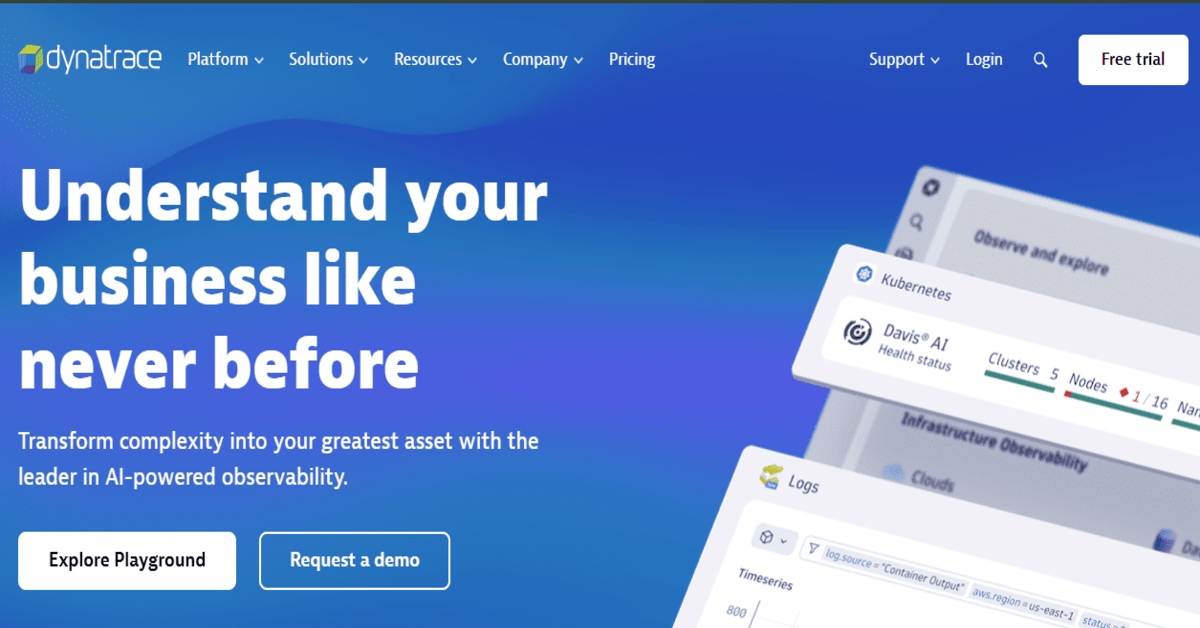
Dynatrace is an enterprise-grade observability and security platform combining infrastructure monitoring, APM, and AI-driven analytics. Its standout Davis AI engine automates anomaly detection and root cause analysis, making it a preferred choice for large-scale microservices and multi-cloud workloads.
Key Features
- Davis AI Engine: Anomaly detection and automated correlation across layers to reduce alert noise and surface root causes.
- OneAgent Deployment: Auto-discovers containers, services, and serverless workloads with a single agent—minimizing setup overhead.
- Integrated Security Monitoring: Offers runtime application protection (RASP) and vulnerability detection alongside observability.
- Cloud-native Automation: Deep integration with AWS, Azure, and Kubernetes for autoscaling and intelligent workload placement.
Standout Features
- 100% transaction capture (no sampling)
- Unified view of user experience, app health, and infrastructure
- Auto-instrumentation across services
- AI-generated baselines for performance
Pros
- Highly scalable and enterprise-ready
- No trace sampling; full fidelity
- Deep AI/ML-powered insights
- Comprehensive coverage across the tech stack
Cons
- High cost and pricing complexity
- Steep learning curve
- Overwhelming UI hindering usability
Best For
Large-scale enterprises running multi-cloud, high-volume workloads that require strong automation, end-to-end visibility, and security compliance.
Pricing & Customer Feedback
- Infrastructure Monitoring: $29/mo/host
- Full-Stack Monitoring: $58/mo/8 GiB host
- Rating: 4.8/5 on G2
- Praise for: AI features, full visibility, cloud-native integrations
- Criticism: Cost, complexity, vendor lock-in
Dynatrace vs Highlight.io
Dynatrace and Highlight.io address observability at different levels. Dynatrace is an enterprise-grade platform offering deep application and infrastructure monitoring with automated analysis across complex environments, while Highlight.io focuses on full-stack observability with strong session replay and error correlation. Highlight.io suits user-centric debugging, whereas Dynatrace is better suited for large-scale, automated observability needs.
3. Coralogix
Known For
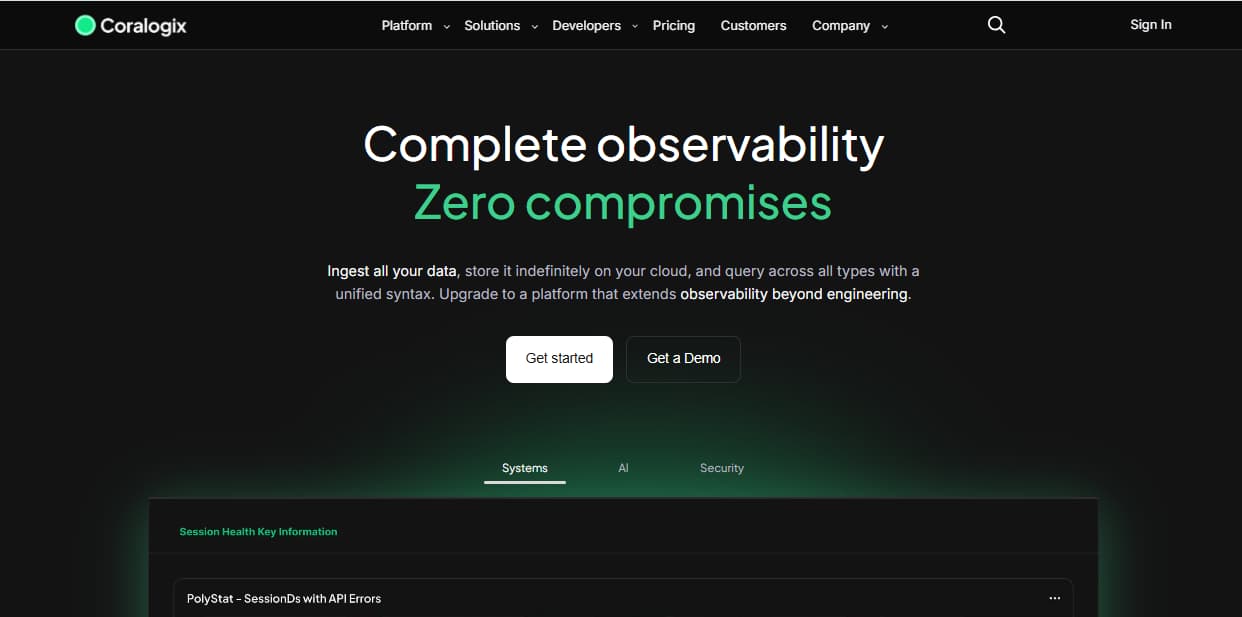
Coralogix is a full-stack observability platform designed for high-scale telemetry ingestion with cost control at its core. It emphasizes stream-based processing and modular indexing to help DevSecOps teams manage large volumes of logs without overpaying for storage or retention. Its pipeline architecture makes it ideal for teams that need granular control over what to store, what to archive, and what to query in real time.
Key Features
- Streama™ Architecture: Enables ingestion of logs without indexing everything. Teams can query on the fly while keeping most data in cheap cold storage (e.g., S3).
- Customer-Controlled Archiving: Telemetry is archived in your own S3 bucket, reducing long-term retention costs. However, data briefly flows through Coralogix’s systems, raising compliance flags for some teams.
- Advanced Log Routing and Parsing: Offers pipeline-level control to parse, enrich, and direct data to different destinations based on rules—helping reduce costs during volume spikes.
- OpenTelemetry Support: Supports OTEL-based ingestion, though manual configuration is often required to achieve context propagation across metrics, logs, and traces.
Standout Features
- Smart ingestion pipelines for indexing cost optimization
- Cold storage via S3 with delayed query support
- Modular dashboards for infrastructure and applications
- SOC 2, HIPAA, and GDPR compliance options
Pros
- Powerful ingestion cost control via log routing
- Strong for archival use cases and long-term audit retention
- Suitable for teams managing terabytes of daily telemetry
- Compliance-aware deployment options
Cons
- Users find the learning curve steep for beginners
- Initial configuration is complex and time consuming
- Overwhelming UI that hinders usability
Best For
Enterprises managing high log volumes, dealing with long retention policies, or requiring pipeline-level control over telemetry storage and access.
Pricing & Customer Feedback
- Logs: $0.42/GB
- Traces: $0.16/GB
- Metrics: $0.05/GB
- AI: $1.5/1M tokens
- Rating: 4.6/5 on G2
- Praise for: Flexible log pipelines, Streama™ architecture, cost efficiency.
- Criticism: Complicated MELT unification, steep learning curve, and overwhelming UI.
Coralogix vs Highlight.io
Coralogix and Highlight.io approach observability differently. Coralogix is a scalable observability platform designed for centralised telemetry processing and alerting across distributed systems, while Highlight.io focuses on full-stack observability with session replay and error correlation for web applications. Coralogix excels at full-stack monitoring of distributed systems and alerting at scale, whereas Highlight.io provides richer context for debugging user-facing errors.
4. Datadog
Known For
Datadog is a cloud-native SaaS observability platform that unifies infrastructure monitoring, APM, logs, RUM, synthetics, and security analytics into a single control plane. It’s widely adopted by DevOps and SRE teams for its rich features, deep integrations, and ability to monitor large, distributed environments.
Key Features
- Infrastructure Monitoring: Collects metrics from hosts, containers, and cloud services.
- Distributed Tracing (APM): Tracks requests across microservices, APIs, and databases.
- Log Management: Centralized log collection with powerful filtering and search.
- Security Monitoring: Detects threats and policy violations in real-time.
- RUM & Synthetics: Measures frontend performance and simulates user journeys.
- Custom Alerting: Includes threshold-based, anomaly, and composite alerts.
Standout Features
- 900+ integrations (AWS, GCP, Docker, Jenkins, etc.)
- Watchdog AI for automated anomaly detection
- Unified platform for MELT + security telemetry
- Enterprise-grade scale and reliability
Pros
- Full-stack observability with strong cloud-native support
- Excellent dashboarding, alerting, and automation
- Prebuilt integrations accelerate setup
Cons
- High cost at scale with per-GB, per-user, per-host billing
- Costs also increase with the addition of features and data retention
- The UI complexity is challenging, making navigation difficult
Best For
Enterprise teams operating complex, multi-cloud environments with the budget to support premium observability tooling.
Pricing & Customer Feedback
- APM (Pro Plan): $35/host/month
- Infra (Pro Plan): $15/host/month
- Ingested Logs: $0.10 per ingested or scanned GB per month
- G2 Rating: 4.4 / 5
- Praised for its power; criticized for unpredictable billing and high cost
Datadog vs Highlight.io
Datadog is a comprehensive cloud-based observability platform that covers infrastructure monitoring, APM, logs, metrics, traces, real user monitoring, and security signals across a wide range of environments. Highlight.io provides full-stack observability with a strong focus on session replay and error correlation for web applications. While Highlight.io excels at user-centric debugging, Datadog offers broader end-to-end visibility across complex and large-scale systems.
5. New Relic
Known For
New Relic is a mature, full-stack observability platform with strong support across the MELT stack—metrics, events, logs, and traces. Known for its all-in-one interface, powerful agents, and usage-based pricing, it is widely adopted by SRE and DevOps teams looking for quick instrumentation and broad language coverage.
Key Features
- Unified MELT Telemetry via New Relic One: Centralizes telemetry across apps, infra, and user experiences with real-time dashboards, code-level tracing, and anomaly detection.
- Auto Instrumentation Agents: Built-in support for Java, Node.js, Python, Ruby, and other major languages makes onboarding fast for most environments.
- Visual Service Maps & Tracing: Helps visualize distributed systems and uncover latency issues across services with dependency maps.
- OpenTelemetry Ingestion Support: OTEL traces can be ingested, but with limited out-of-the-box support—most workflows still lean on proprietary agents.
- Head-based Sampling: Uses static sampling percentages (e.g. 1–5%), which can miss rare edge-case traces unless manually tuned.
Standout Features
- Comprehensive MELT integration in one dashboard
- Prebuilt alerts, anomaly detection, and SRE workflows
- Real-time insights and code-level diagnostics
- Integrates with major cloud platforms and CI/CD tools
Pros
- Fast onboarding and auto-instrumentation
- Broad support for infrastructure and application monitoring
- Clean, user-friendly UI
- Solid ecosystem and documentation
Cons
- Usage-based billing becomes expensive at scale
- No support for self-hosting or air-gapped deployments
- Steep learning curve for advanced features
Best For
Mid-sized to large organizations needing fast time-to-value, broad agent support, and a SaaS-first observability platform.
Pricing & Customer Feedback
- Free tier: 100GB/month ingested
- Pro Plan: $0.40/GB ingested beyond the 100GB/month free limit
- Pro Plan: $349/month for full platform user
- Rating: 4.4/5 on G2
- Praise for: Rich UI, fast onboarding, out-of-the-box value
- Criticism: Pricing unpredictability, limited sampling logic, and SaaS-only model
New Relic vs Highlight.io
New Relic and Highlight.io serve different observability focuses. New Relic is a full observability platform that provides application performance monitoring, infrastructure metrics, logs, traces, and dashboards across diverse environments. Highlight.io focuses on full-stack observability with session replay and error correlation to help debug user-facing issues. While Highlight.io provides rich context for frontend errors, New Relic delivers broader visibility across application performance and underlying infrastructure.
6. Amazon CloudWatch
Known For
Amazon CloudWatch is AWS’s native observability service used to monitor logs, metrics, alarms, and events across cloud resources like EC2, Lambda, ECS, and RDS. It is the default choice for most teams operating inside AWS, with seamless integrations and automation hooks designed specifically for cloud-native environments.
Key Features
- Metrics Collection: Gathers system and application metrics from over 70 AWS services, with support for custom metrics and namespace-based organization.
- Log Aggregation & Analysis: Centralized ingestion of application and infrastructure logs, with SQL-like querying and filtering using Logs Insights.
- Dashboarding: Visualizes telemetry through customizable dashboards using widgets, time-series graphs, and grouped metrics.
- Alarming & Notifications: Configurable alarms based on thresholds, anomaly detection, or composite metrics that integrate with SNS, Lambda, and auto-scaling policies.
- EventBridge Integration: Sends real-time events to AWS EventBridge for routing, automation, or triggering workflows across the AWS ecosystem.
- Optional RUM & Synthetics: Provides Real User Monitoring and synthetic canary testing for frontend availability and experience metrics (billed separately).
Standout Features
- Tight AWS Integration: Built-in support for telemetry from services like EC2, S3, DynamoDB, and Lambda, with no extra setup.
- Contributor Insights: Helps detect top contributors to latency spikes or error rates, such as a noisy IP or misbehaving API endpoint.
- Application Signals (APM-lite): Offers lightweight distributed tracing for some AWS-native services (e.g., Lambda, API Gateway).
- IAM-Based Access Controls: Uses AWS Identity and Access Management for fine-grained, role-based data access.
- Event-Driven Automation: Connects metrics and logs with infrastructure actions via CloudWatch alarms and EventBridge.
Pros
- Seamless native monitoring for AWS services
- Highly scalable with strong SLAs
- IAM support for granular user/data access
- Event-driven automation capabilities
- Requires no agents for many AWS-native resources
Cons
- The UI is complex and overwhelming to beginners
- High Costs at Scale
- Steep Learning Curve: Configuring alarms, custom metrics, and OTEL integrations requires familiarity with AWS
Best For
Teams deeply embedded in AWS infrastructure who require basic telemetry, alerting, and automation, but don’t need full-stack tracing, frontend replay, or OpenTelemetry-first workflows.
Pricing & Customer Feedback
- Logs Ingestion: $0.50/GB
- Logs Storage: $0.03/GB/month
- Custom Metrics: $0.30/metric/month (first 10,000)
- Application Signals (APM-lite): Starts at $0.35/GB for first 10TB
- RUM: ~$1 per 100,000 events
- Synthetics: $0.0012/run
- G2 Rating: 4.5 / 5
- Praised For: Reliability, deep AWS integrations, automation hooks
- Criticized For: Billing complexity, sluggish UI, and limited front-end or full-stack visibility
Amazon CloudWatch vs Highlight.io
Amazon CloudWatch and Highlight.io focus on different observability needs. CloudWatch is a cloud-native monitoring and observability service for AWS resources, capturing metrics, logs, events, and alarms across infrastructure and applications. Highlight.io provides full-stack observability for web applications with an emphasis on session replay and error correlation to aid debugging. While Highlight.io offers rich context for frontend errors and user behavior, CloudWatch delivers deep, scalable monitoring within AWS environments.
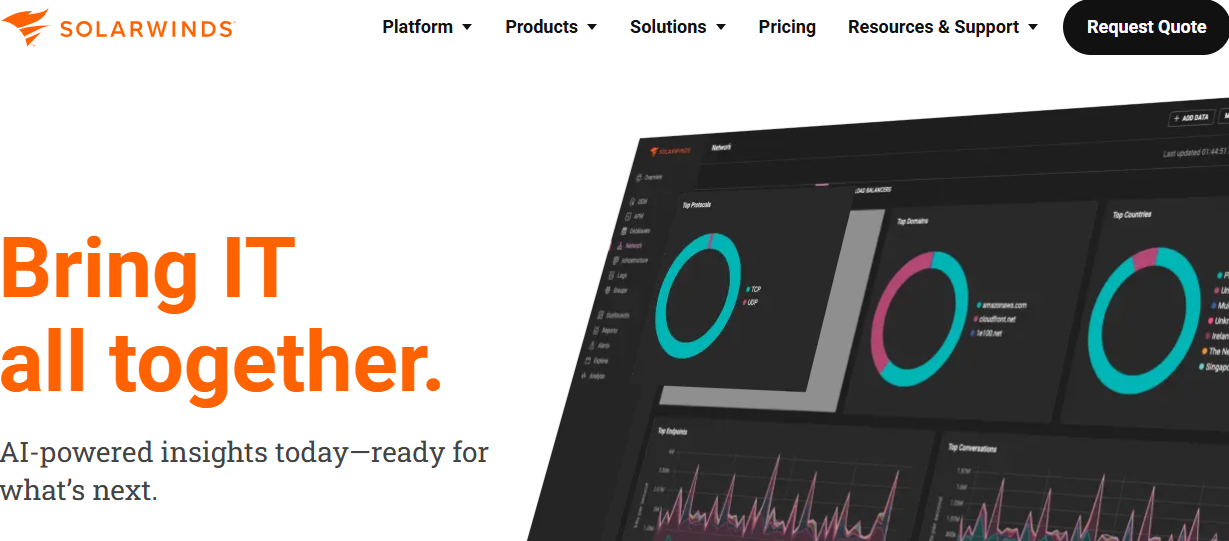
7. SolarWinds
Known For
SolarWinds is a long-standing vendor in IT monitoring and infrastructure management, recognized for its deep capabilities in network performance, server health, and database diagnostics. It’s widely used by enterprises, government agencies, and regulated industries for monitoring traditional environments through tools like Network Performance Monitor (NPM), Server & Application Monitor (SAM), and the broader SolarWinds Observability suite. Its strength lies in on-premise and hybrid infrastructure visibility, backed by decades of enterprise IT adoption.
Key Features
- Infrastructure & Network Monitoring: Products like NPM and SAM provide detailed insight into server uptime, hardware metrics, bandwidth usage, and SNMP-based network visibility.
- Database Performance Analyzer (DPA): Specialized database monitoring for Oracle, MSSQL, and MySQL with visual query plans, wait-time analysis, and historical performance tracking.
- IT Service Management (ITSM): Includes built-in helpdesk workflows, ticket routing, SLA monitoring, and technician workload tracking through its Service Desk product.
- Incident Management & Alerting: Offers centralized alert rules, role-based notifications, and integrations with tools like Microsoft Teams and Slack for real-time escalation.
- Self-Hosted Deployment: Full on-premise install options for organizations requiring air-gapped, compliance-ready setups—appealing to sectors with strict data sovereignty mandates.
Standout Features
- Modular Suite of Tools: Covers everything from monitoring and service desk to incident response and database health.
- Network-Centric Capabilities: Mature SNMP monitoring, NetFlow traffic analysis, and network topology mapping.
- Hybrid Visibility: Designed to monitor both cloud and legacy infrastructure in mixed environments.
- Custom Dashboards & Reporting: Allows threshold-based alerts, baseline comparisons, and detailed usage reporting.
- ITSM + Observability Integration: Brings asset tracking and incident workflows under the same umbrella.
Pros
- Strong visibility into traditional IT infrastructure and hybrid networks
- Wide toolset covering monitoring, ITSM, databases, and ticketing
- On-premise deployment options for compliance and data control
- Mature SNMP and NetFlow tools for detailed network analytics
Cons
- Pricing is modular and adds up quickly with more nodes, databases, or users
- High operational complexity due to fragmented tooling and interfaces
- User interface is dated and often criticized for being unintuitive
Best For
Enterprises with large-scale, on-premise infrastructure, especially in regulated industries. Ideal for teams focused on asset discovery, infrastructure health, and service desk workflows rather than unified, modern observability stacks.
Pricing & Customer Feedback
- Monitoring: $6/node/month
- Database Monitoring: $117/database/month
- ITSM: $39/technician/month
- Incident Response: $9/user/month
- Startup Estimate: ~$4,000/month for 40 nodes, 5 DBs
- Mid-size Estimate: ~$8,000/month for 150 nodes, 25 DBs, 20 techs
- G2 Rating: 4.4 / 5
- Praised for: Feature breadth, legacy infra visibility
- Criticized for: Poor UI, weak OTEL integration, high cost, slow support
SolarWinds vs Highlight.io
SolarWinds offers a suite of IT management and monitoring tools focused on infrastructure performance, network monitoring, and systems health across on-premises and hybrid environments. Highlight.io provides full-stack observability with session replay and error correlation to help debug user-facing issues. While Highlight.io excels at linking user experience to application errors, SolarWinds delivers broader infrastructure and network monitoring capabilities suited to traditional IT operations.
Conclusion: Choosing the Right Highlight.io Alternative
As observability needs evolve, engineering teams are in search of platforms that deliver deeper telemetry coverage, smarter data control, and enterprise-grade readiness. While Highlight.io provides valuable session replays and trace correlation for full-stack debugging, its limitations—such as basic sampling, lack of SLO-based alerting, limited enterprise support, and SaaS-first deployment—can become blockers for growing teams.
CubeAPM emerges as a compelling alternative, combining OpenTelemetry-native ingestion, Smart Sampling, and flat $0.15/GB pricing with support for self-hosting and compliance-first deployments. For teams that need to scale cost-effectively without losing signal quality or control over their data, CubeAPM provides both performance and predictability.
Other tools like Dynatrace, New Relic, and Splunk AppDynamics cater to enterprise workloads, while platforms like Coralogix offer granular log routing and cost control. The right choice ultimately depends on your use case—whether it’s frontend observability, backend scale, compliance, or cost-efficiency.
Disclaimer: The information in this article reflects the latest details available at the time of publication and may change as technologies and products evolve.
FAQs
1. What are the main limitations of Highlight.io?
Highlight.io lacks tail-based or intelligent sampling, offers limited SLO alerting, and provides community-based support without SLAs. It also has weaker native support for cloud-native infrastructure monitoring and no built-in anomaly detection.
2. Is there a more cost-efficient alternative to Highlight.io?
Yes, CubeAPM offers a flat $0.15/GB ingestion rate with no per-user fees and Smart Sampling to reduce unnecessary trace volume, making it significantly more cost-efficient—especially for growing teams and startups.
3. Which Highlight.io alternative supports self-hosting?
Tools like CubeAPM, Coralogix, and Splunk AppDynamics offer self-hosting or hybrid deployment options, enabling better control over data locality, compliance, and infrastructure.
4. Does any alternative to Highlight.io support OpenTelemetry better?
Yes, CubeAPM and Dynatrace provide full OpenTelemetry-native support. CubeAPM is built entirely around OTEL standards, allowing seamless ingestion of traces, logs, metrics, and events without vendor lock-in.
5. What’s the best Highlight.io alternative for frontend + backend observability?
For unified frontend and backend observability, CubeAPM offers RUM, traces, logs, metrics, and synthetics—all in one platform. While Highlight.io focuses heavily on session replay, CubeAPM scales better for production use cases while maintaining cost and compliance flexibility.


