Using an eBPF‑based approach to provide real‑time insights with minimal overhead, groundcover has built a reputation as a modern observability and APM platform tailored for Kubernetes-first environments. According to the CNCF Survey, 80% of organizations have deployed Kubernetes in production, with another 13% actively testing it as of early 2025.
However, some users find groundcover’s dashboard to be difficult to navigate, fewer integrations supported, poor customer support, and pricing tied to host or node counts can feel costly at scale. CubeAPM is the best groundcover alternative with cost-effcient ingestion-based pricing of $0.15/GB, its full MELT observability, smart sampling to cut telemetry volume, and pure self-hosting on BYOD or on-premises.
In this article, we’ll explore the top groundcover alternatives to help you find the best observability platform for your needs.
Top 7 groundcover alternatives
- CubeAPM
- Datadog
- Dynatrace
- New Relic
- Grafana Cloud
- Elastic Observability
- Splunk Observability Cloud
Why are people looking for groundcover alternatives?
UX and Dashboard Issues
Reviewers on G2 point out that Groundcover’s UX and dashboard experience can feel restrictive, especially when working with complex views. Users mention limited dashboard customization, such as non-resizable panels and less flexible layouts, which reduces control during deep analysis. Navigation within dashboards is also described as less intuitive, particularly when drilling into logs or metrics.
Poor Customer Support
Some reviewers also cite inconsistent or slow customer support, reporting delayed responses or difficulty getting timely help on issues. Also, some users compliant about its documentation’s clarity. This has led a few users to explore alternatives with more responsive and structured support.
Fewer Integration Support
Groundcover’s official documentation shows support for a relatively small set of integrations, mainly centered around standard telemetry pipelines like OpenTelemetry, Prometheus remote-write, and common agents such as Fluentd or Fluent Bit. While this covers core logs, metrics, and traces, the platform offers fewer native, out-of-the-box integrations with third-party tools and cloud services compared to larger observability ecosystems.
Criteria for selecting the best groundcover alternatives
OpenTelemetry-first with full MELT
Match or exceed groundcover’s baseline: native OTEL for traces/logs/metrics, automatic K8s enrichment, and complete MELT (metrics, events, logs, traces). This preserves your instrumentation and avoids lock-in during migration. Confirm OTLP/HTTP and OTLP/gRPC paths and enrichment behavior.
Deployment flexibility that fits your controls
Shortlist vendors that offer SaaS, BYOC, and self-hosted/air-gapped footprints, with clear boundaries of who runs what and where data lives. Ask for accurate TCO (what you host vs. the vendor) and diagrams. groundcover’s materials are a good benchmark for the questions to ask.
Pricing that remains predictable under your growth pattern
Pressure-test both per-host and per-GB against your real node patterns and data hygiene. Node-based models help when telemetry surges, but node counts are stable; per-GB helps when nodes surge; however, you can govern data with pipelines/sampling. Always run a side-by-side estimate like the 150-node/10 TB example above.
Tunable, transparent sampling
Insist on fine-grained controls: incident-aware force sampling, priority sampling, rate-limits by service/path, and easy “no-drop” rules for error transactions. Validate how overrides behave and how quickly config changes propagate during an incident. (groundcover documents rate-limiting mechanics; look for parity or better.)
Minimal operational friction on agents/sensors
Check CPU/memory overhead, kernel/version support, and the need to run a DaemonSet/agent on every node. If you run strict PSPs or old distros, opt for providers that cover fallbacks. groundcover’s kernel and coverage requirements are a useful checklist when vetting others.
Mature UX for team workflows
Evaluate dashboards, ad-hoc query ergonomics, alerting/SLOs, and deep-linking across logs-traces-metrics. Take note of any navigation quirks in your POC and confirm versioning and RBAC for dashboards. Use public feedback as prompts for what to test.
Support SLAs and escalation you can live with
Map vendor plan tiers (business-hours vs. 24×7×365, dedicated channels) to your on-call reality. Confirm ticket severity mapping, response/restore targets, and named-engineer options. groundcover’s public support tiers are a good template for questions to standardize across your shortlist.
Security & compliance proof
Ask for a trust center, recent audit reports (SOC 2 Type II/ISO 27001), data-flow diagrams, key management details, and BYOK options. Validate identity integrations (SSO, SCIM) and audit logging across tenants and regions. (Use groundcover’s deployment options and identity references as a baseline for your RFP.)
groundcover Overview
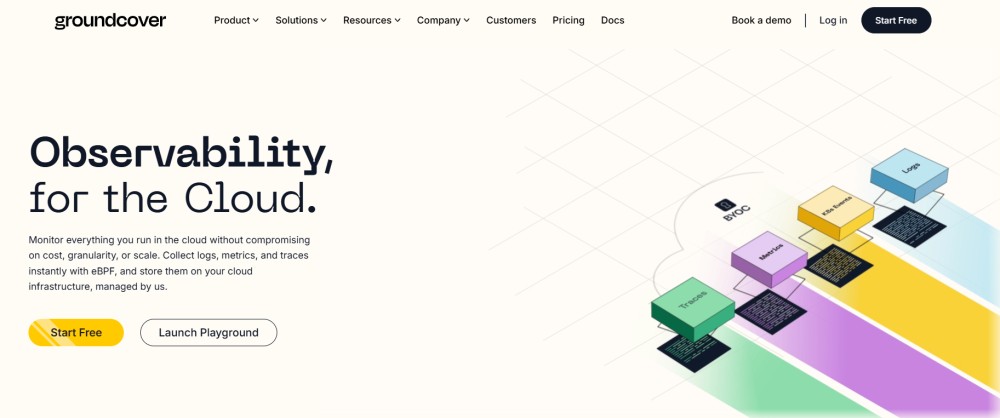
A Kubernetes-first observability and APM platform that combines an eBPF sensor with OpenTelemetry (OTEL) ingestion to deliver real-time MELT (metrics, events, logs, traces) visibility, plus RUM, synthetic checks, and infrastructure monitoring. It’s available in flexible footprints (in-cloud, BYOC, on-prem, and fully air-gapped) so teams can keep telemetry inside their own environment for privacy and cost control.
Known for
Kubernetes and cloud-native observability with minimal instrumentation overhead, fast time-to-value, and predictable, node-based pricing that’s decoupled from data volume.
Standout Features
- eBPF sensor: Kernel-level collection via a lightweight DaemonSet on every node, providing deep network and application visibility with low overhead.
- BYOC / on-prem/air-gapped: Multiple deployment models that keep all telemetry and storage inside your cloud or datacenter for data-residency and compliance needs.
- Native OTEL ingestion: First-class OTLP (HTTP/gRPC) support for traces, logs, and metrics with automatic Kubernetes metadata enrichment.
- Prometheus support: for scraping data and storing it, and querying data via PromQL. You also get to access Grafana-friendly dashboards.
- RUM that stays in-house: Front-end monitoring and session insights designed to keep user data inside your own environment under BYOC/on-prem.
- Spikes-proof pricing logic: Costs based on average monitored nodes rather than telemetry volume to avoid data-spike surprises.
Key Features
- Full MELT coverage: Metrics, logs, traces, and Kubernetes events with built-in correlation, dashboards, monitors, and alerting.
- Deployment options: groundcover supports self-managed, on-prem, cloud, and air-gapped environments to give you flexibility of choosing the deployment model.
- Sampling & rate controls: Global rate limits and incident-aware overrides to preserve fidelity during outages while controlling baseline volume.
- Pipelines & parsing: Log pipelines (OTTL-style processing), enrichment, and cross-linking between logs, traces, and K8s objects for faster RCA.
- Integrations: OTEL, Prometheus, major clouds (AWS/GCP/Azure), Slack/PagerDuty/Jira, and CI/CD tools used across modern DevOps stacks.
- Security & privacy posture: Data stored in your environment with SSO options, private access, and object-storage offloading for long-term retention.
Pros
- Kubernetes-first design with very fast setup and minimal code instrumentation
- Data stays in your environment (BYOC/on-prem/air-gapped) for privacy and residency
- Node-based pricing avoids telemetry-volume surprises and is simple to forecast
- Excellent learning, dashboards, and K8 correlation
Cons
- Being K8-centric, it may need an extra workaround for mixed VM or legacy estates
- Sensor needs governance for privileged DaemonSet rollouts
- Some workflow/navigation quirks reported when scaling dashboarding across teams
- Sampling and rate-limit tuning needed to balance incident fidelity vs baseline cost
Best for
Teams running production Kubernetes who want end-to-end MELT, RUM, and infrastructure visibility with minimal instrumentation; organizations prioritizing data residency and compliance via BYOC/on-prem/air-gapped; platform groups standardizing on OTEL + Prometheus and seeking predictable, node-based costs.
groundcover Pricing & Customer Reviews
- Pricing: Free (self-managed); Team: $20/host/month (self-managed, up to 100 hosts); Enterprise: $30/host/month (BYOC); on-prem: $50/host/month
- G2 rating: 4.8/5 (26 reviews)
- Praised for: ease of setup and use, keeping data local (BYOC/on-prem), responsive support, effective correlation across logs, traces, metrics
- Criticized for: UX/navigation issues, poor customer support
Top 7 groundcover alternatives
1. CubeAPM
Known for
CubeAPM is OpenTelemetry-native and comes with full-stack observability (MELT + RUM + synthetics + error tracking). It’s also known for its context-based smart sampling and faster migration from incumbents. You get flexible deployment options with self-hosting or BYOC that keep data in your cloud or on-premises systems. It’s built for high-throughput, modern teams looking for predictable costs, compliance support, and no vendor lock-ins.
Standout Features
- Smart sampling: Context-aware/tail-based sampling that preserves error- and latency-heavy traces while trimming noise for major cost reductions.
- Self-hosting: Run entirely in your VPC or on-prem to meet data-residency and compliance requirements.
- Fast migration tooling: Compatibility with OpenTelemetry, Prometheus, and common agent formats to switch without code rewrites.
- Engineer-led support: Real-time Slack/WhatsApp access to core engineers for rapid triage and incident assistance.
Key Features
- Full MELT coverage: Distributed tracing, logs, metrics, events, plus RUM, synthetics, and error tracking in one UI.
- OTEL-first ingestion: Drop-in OTLP (HTTP/gRPC) with automatic service/Kubernetes enrichment and zero vendor lock-in.
- Infrastructure & serverless visibility: Hosts, containers, Kubernetes, databases, and cloud services correlated directly with traces and logs.
- Precision alerts & SLOs: Anomaly/noise suppression and rich, context-filled alerts routed to Slack, PagerDuty, email, and more.
- Scalable storage & search: Designed for unlimited retention with fast queries and efficient indexing for large data sets.
- 800+ integrations: Connectors across clouds, data stores, CI/CD, and collaboration tools; OTEL/Prometheus-ready from day one.
Pros
- OTEL-native ingestion and quick time-to-value
- Self-hosting as well as BYOC options to meet data residency rules
- Smart sampling reduces cost while preserving critical insights
- Correlated MELT + RUM/synthetics/error tracking in one place
Cons of CubeAPM
- Not suited for teams looking for off-prem solutions
- Strictly an observability platform, no cloud security management
Best for
Engineering and platform teams standardizing on OpenTelemetry who need end-to-end MELT with RUM/synthetics, strict data-control options (BYOC/on-prem/air-gapped), and aggressive cost efficiency via smart sampling—without vendor lock-in.
CubeAPM Pricing & Customer Reviews
- Pricing: $0.15/GB, nothing extra
- G2 Rating: 4.7/5
- Praised for: cost efficiency via smart sampling, self-hosting/BYOC flexibility, fast migration from Datadog/New Relic, hands-on, engineer-led support
CubeAPM vs groundcover
Both target cloud-native teams and deliver full MELT, but CubeAPM extends beyond Kubernetes with deeper OTEL-first ingestion, integrated RUM/synthetics/error tracking, and self-hosting/BYOC that keeps every byte in your environment. Choose CubeAPM when predictable, data-efficient scale, and strict data-residency controls matter most.
2. Datadog
Known for
A large, mature SaaS observability platform that unifies infrastructure, APM, logs, RUM, synthetics, error tracking, security, and more—backed by hundreds of integrations and strong enterprise governance. Datadog emphasizes “all telemetry in context,” with APM correlating traces, logs, metrics, and frontend data to speed up root-cause analysis.
Standout Features
- All-in-one SaaS suite: One platform spanning infra, APM, logs, security, digital experience, service management, and AI.
- AI triage: Using Watchdog or Bits AI, the tool automatically finds anomalies and root causes to reduce MTTR.
- Deep RUM + Session Replay: Full visibility into every user session with pixel-accurate replays correlated to backend traces.
- Logging without Limits™: Decouples log ingestion from indexing so teams can control retention and query costs.
Key Features
- Infrastructure monitoring: High-resolution metrics, dashboards, and alerting across hybrid and multi-cloud environments.
- Modern APM: Code-level distributed tracing, service maps, change tracking, and flexible ingestion/sampling controls.
- Log management: Centralize, transform, archive, and explore logs alongside metrics and traces.
- Real User Monitoring (web & mobile): Track Core Web Vitals, behavior, and errors, then pivot directly to traces and logs.
- Synthetics: You can run texts for API, web browser, and mobile devices to validate endpoints and workflows.
- Error tracking: Auto-group similar errors into actionable issues across services for faster debugging.
Pros
- Very broad product surface and integrations
- Mature dashboards, docs, and global support footprint
- Strong RUM, synthetics, and correlation across telemetry
- AI-assisted anomaly detection and RCA baked into workflows
Cons
- Pricing complexity with multiple billing axes such as hosts, containers, indexed spans/logs, RUM sessions, and test runs
- SaaS-only residency with no BYOC/on-prem mode
- Learning curve across many modules and features
Best for
Enterprises and fast-growing teams that want a single hosted observability suite with deep features across infrastructure, application, and digital experience monitoring—and who can actively manage usage-based billing and governance as environments scale.
Datadog Pricing & Customer Reviews
- Pricing: Infrastructure: $15/host/month (annual), APM: $31/APM host/month (annual), log ingest: $0.10/GB with indexing priced per million events (retention tiers), RUM: $0.15 per 1,000 sessions
- G2 rating: 4.4/5
- Praised for: many features and integrations, impressive dashboards, and AI-based insights
- Criticized for: pricing complexity at scale
Datadog vs groundcover
Datadog offers wider product breadth (RUM, synthetics, security, service management, AI) with a polished SaaS experience, but costs span many meters and require tight governance. groundcover stays Kubernetes-first with node-based pricing and BYOC/on-prem options for strict data residency, appealing when predictable per-node spend and full control over where telemetry lives are top priorities.
3. New Relic
Known for
A unified, usage-based SaaS observability platform with deep APM roots that correlates traces, logs, metrics, and frontend telemetry in one place. Popular for opinionated workflows (service maps, Transactions/Entity views, Errors Inbox) that reduce context switching. Broad coverage spans APM, logs, infra/Kubernetes, RUM/mobile, synthetics, alerting, and dashboards.
Standout Features
- Transaction 360 & distributed tracing: End-to-end visualization of service paths to reveal latency and dependency bottlenecks fast.
- Errors Inbox: Consolidates and de-duplicates errors across services and clients into actionable issue groups.
- RUM & Mobile RUM: Core Web Vitals, session/crash analytics, and replay tied back to backend traces.
- All-in infrastructure monitoring: Correlates host, container, and Kubernetes health with application performance in real time.
Key Features
- APM: Code-level visibility, service maps, anomaly detection, and change tracking to speed MTTR.
- Log management: Ingest, transform, query, and correlate logs alongside traces and metrics for full context.
- Real User Monitoring: Web and mobile experience monitoring linked directly to backend services.
- Synthetic monitoring: Proactive API and browser tests to validate critical flows and SLAs.
- Network & infra views: Flow and infra signals remove silos during triage.
- Platform & free tier: Single UI for telemetry with a generous free tier to get started.
Pros
- Broad, mature product surface across APM, logs, infra, RUM, synthetics
- Strong correlation of telemetry and polished troubleshooting workflows
- Large integration and documentation footprint
- Flexible usage-based model that can start small
Cons
- Bills can rise with ingest and user counts at scale
- Learning curve
- SaaS-only; no self-hosting
Best for
Product and platform teams that want a single hosted observability plane with strong APM/RUM fundamentals, robust dashboards and alerting, and usage-based pricing that can start small—so long as they’re comfortable governing ingest and user tiers as they scale.
New Relic Pricing & Customer Reviews
- Pricing: 100 GB/month free data ingest, then $0.40/GB beyond free; user-based pricing starts at $49/user/month
- G2 rating: 4.4/5
- Praised for: APM depth, dashboards & correlations, easy start with free tier, broad integrations
- Criticized for: pricing at higher ingest/user counts
New Relic vs groundcover
New Relic provides a broad hosted suite across APM, logs, infra, RUM, and synthetics with strong correlation and NRQL-driven analysis. groundcover is Kubernetes-first with eBPF capture, predictable node-based pricing, and BYOC/on-prem options. Choose New Relic for wide SaaS breadth and mature workflows, or groundcover when per-node predictability and strict data-residency control are the deciding factors.
4. Dynatrace
Known for
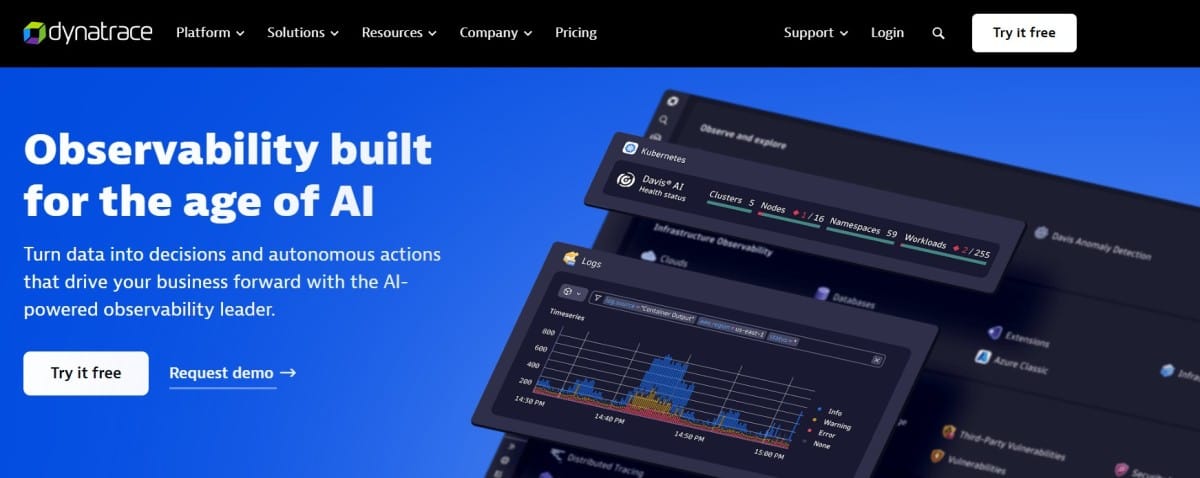
Dynatrce is an enterprise-grade observability solution that offers an advanced AI – Davis® AI to perform causal, predictive, and generative analytics. Its OneAgent offers full-stack instrumentation and you get application, infrastructure, logs, digital experience, and AIOps on one platform.
Standout Features
- Davis® AI: correlates events to one problem, finds the root cause of an issue quickly, and helps in efficient preventive operations.
- OneAgent automation: A single agent discovers and instruments hosts, containers, services, and user experience with minimal manual setup.
- Smartscape topology: Automatic dependency mapping and service-flow visualization to understand blast radius and impact.
- Grail™ log analytics: A lakehouse-style analytics layer and DQL that converges historical and real-time analysis for queries at scale.
Key Features
- Application observability: Distributed tracing, code-level insights, service maps, change tracking, SLOs, and Davis-driven anomaly detection.
- Infrastructure observability: High-resolution metrics and alerting across hybrid and multi-cloud, containers, and data centers.
- Log management & analytics: Ingest, store, and analyze logs with Grail/DQL alongside traces and metrics for unified triage.
- Digital experience monitoring: Web/mobile RUM with Core Web Vitals and Session Replay linked to backend traces.
- AIOps & automation: Problem correlation, anomaly detection, forecasting, and cost monitors to manage Dynatrace Platform Subscription spend.
- Deployment options: SaaS and Dynatrace Managed (on-prem) for customers with strict residency, with most new Grail-based capabilities available in SaaS.
Pros
- Powerful AI-assisted triage and root-cause analysis
- Automatic full-stack instrumentation and smart topology mapping
- Scales to very large hybrid/multi-cloud estates
- Mature governance, RBAC, and enterprise controls
Cons
- Expensive for smaller teams
- Learning curve due to depth and automation
Best for
Large enterprises and platform teams running complex hybrid or multi-cloud estates that want automated root-cause analysis, strong topology awareness, and a single platform for applications, infrastructure, logs, and digital experience, especially where AI-assisted prevention and governance at scale are priorities.
Dynatrace Pricing & Customer Reviews
- Pricing: Full-Stack Monitoring at $0.08 per hour for an 8 GiB host
- G2 rating: 4.5/5 (1300+ reviews)
- Praised for: Precise AI and RCA, automatic issue discovery plus instrumentation, enterprise governance
- Criticized for: high cost, learning curve
Dynatrace vs groundcover
Dynatrace brings AI-driven RCA (Davis), automated discovery (OneAgent), and deep cross-domain coverage with SaaS-first innovation, while groundcover is Kubernetes-first with eBPF collection and predictable per-node pricing plus BYOC/on-prem data control.
Choose Dynatrace for large, heterogeneous estates that need AI-assisted scale. Choose groundcover when K8s-centric teams want node-based pricing and strict in-environment data residency.
5. Grafana Cloud

Known for
An OTel-friendly platform that’s built on the LGTM+ stack – Loki, Grafana, Tempo, Mimir, and Pyroscope. It pairs OSS DNA with a managed SaaS, strong Kubernetes monitoring, and pragmatic cost controls (Adaptive Metrics/Logs).
Standout Features
- Open & composable stack: Managed backends for metrics (Mimir), logs (Loki), traces (Tempo), and profiles (Pyroscope), with Grafana at the center.
- OTEL-first ingestion: Native support for OpenTelemetry; Grafana Alloy distribution streamlines pipelines alongside Prometheus.
- Kubernetes Monitoring solution: Opinionated, drill-down dashboards from cluster to pod with curated metrics and cost views.
- Built-in cost levers: Adaptive Metrics and Adaptive Logs to curb cardinality and noisy ingest without losing signal.
Key Features
- APM: service inventory and maps, anomaly detection, RED metrics, etc., with native support for OTEL and Prometheus.
- Metrics at scale: Fully managed Prometheus/Mimir with long retention options and cardinality controls.
- Log management: Loki-powered aggregation, Explore views, LogQL, and a cost management hub with exports to your object storage.
- Distributed tracing: Tempo backend with OTLP ingest and seamless jumps between traces, logs, and metrics.
- Frontend & synthetics: RUM (Frontend Observability) and k6-powered Synthetic Monitoring for API/browser tests.
- IRM add-ons: On-call, incident response, and SLO management integrated into the same UI.
Pros
- Open standards and OTEL-first pipelines
- Strong Kubernetes monitoring out of the box
- Flexibility with OSS backends plus managed SaaS
- Transparent, granular pricing with a generous free tier
- Mature dashboards and integrations
Cons
- Complex setup
- Learning curves for PromQL/LogQL and pipeline design
Best for
Teams that want a vendor-neutral, OTEL-native stack with the comfort of a managed service, especially Kubernetes-heavy platforms that value curated dashboards, real-time correlation across MELT, and fine-grained cost controls without abandoning open components.
Grafana Cloud Pricing & Customer Reviews
- Pricing: Pro plan starts with a $19/month; Enterprise: $25,000/year
- G2 rating: 4.5/5 (≈135 reviews)
- Praised for: OSS alignment and flexibility, K8s visibility, powerful dashboards, and clear usage-based pricing
- Criticized for: learning curve
Grafana Cloud vs groundcover
Grafana Cloud emphasizes an open, composable, OTEL-native approach with managed Mimir/Loki/Tempo/Pyroscope and rich K8s dashboards; groundcover is Kubernetes-first with eBPF capture and predictable node-based pricing plus BYOC/on-prem options.
Choose Grafana Cloud if you want OSS building blocks delivered as SaaS with granular meters. Pick groundcover when per-node predictability and strong in-environment data control are the deciding factors.
6. Elastic Observability
Known for
Elastic Observability is an open, OTel-native observability platform that unifies logs, metrics, traces, APM, infrastructure, RUM/synthetics, profiling, and AIOps—powered by Elastic’s Search AI Platform. It’s available as Elastic Cloud (including Serverless) or self-managed, with strong analytics, long-term retention options, and ML-driven insights.
Standout Features
- OTel-native APM & ingestion: Stream OpenTelemetry traces, metrics, and logs without proprietary lock-ins, including Elastic Distributions of OpenTelemetry.
- Search-powered analytics: Investigate at a petabyte scale using Discover, dashboards, ES|QL, and ML anomaly detection.
- Digital experience monitoring: Real User Monitoring, synthetics, and uptime tied back to back-end traces.
- LLM observability: Track prompts, latency, errors, token usage, and costs across major LLM services.
Key Features
- Application performance monitoring: Distributed tracing, service maps, code-level diagnostics, head/tail sampling, and AI-assisted investigations.
- Log monitoring & analytics: Categorization, pattern analysis, anomaly detection, and fast search at high cardinality.
- Infra: Monitors your hosts, cloud containers and services, K8s, etc., and supports 400+ integrations and many dashboards.
- Digital experience: Web/mobile RUM, synthetic journeys, and uptime checks with SLO-aware alerting.
- AIOps & AI Assistant: Always-on anomaly detection, correlation, forecasting, and a natural-language assistant for triage.
- Flexible deployment: Elastic Cloud (including serverless) or self-managed with tiered, searchable storage for long retention.
Pros
- Strong OTel alignment and open ecosystem
- Fast, search-centric workflows for logs and traces
- Broad MELT plus RUM and synthetics in one platform
- Choice of serverless SaaS or self-managed deployments
Cons
- Learning curve for Kibana/ES|QL and pipeline design
- Complex setups
- Costly premium support (5-15% of billing)
Best for
Teams that want open, standards-based observability with powerful search and ML, the option to run fully in Elastic Cloud (including Serverless) or self-manage, and deep coverage from APM and logs to RUM, synthetics, profiling, and AIOps—especially where long-term retention and analytics at scale are priorities.
Elastic Observability Pricing & Customer Reviews
- Pricing: Cloud hosted: starts at $99/month; Serverless: $0.09/GB ingested (egress and retention cost extra); self-hosting: custom pricing
- G2 rating: 4.2/5
- Praised for: powerful log search, broad integrations, end-to-end visibility, scales to large data volumes
- Criticized for: costy at high scale, setup complexity
Elastic Observability vs groundcover
Elastic offers wider modality breadth (APM/logs/metrics plus RUM, synthetics, profiling, and LLM) with open OTel pipelines and the choice of serverless SaaS or self-managed deployments. groundcover is Kubernetes-first with eBPF capture and predictable node-based pricing plus BYOC/on-prem control.
Choose Elastic when search-powered analytics and flexible deployment/retention matter most. Choose groundcover when K8s-centric teams want per-node predictability and strict in-environment data control.
7. Splunk Observability Cloud
Known for
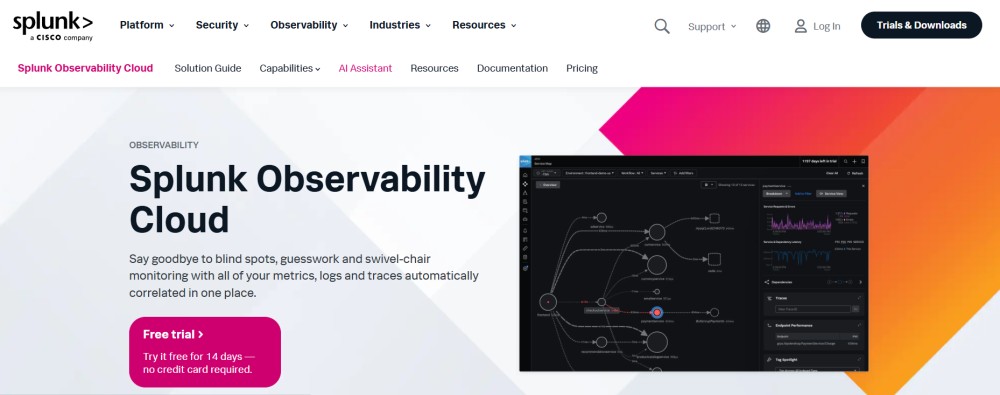
Splunk Observability Cloud is a real-time, SaaS observability suite that correlates metrics, logs, traces, RUM, and synthetics in one place to accelerate root-cause analysis. Notable for NoSample full-fidelity traces, AlwaysOn continuous code profiling, and OpenTelemetry-based ingestion across cloud and Kubernetes estates.
Standout Features
- NoSample tracing: lets you store 100% of your traces and analyze them to investigate issues accurately without any repro steps.
- AlwaysOn code profiling: Continuous CPU/memory profiling for Java, .NET, and Node.js to pinpoint hot paths.
- Streaming analytics: Second-level alerting on high-cardinality metrics for faster detection and MTTR.
- Unified UX: You can easily jump between APM, Infra, Logs, RUM, and Synthetics with the tool’s clear user interface.
Key Features
- APM: Its APM includes distributed tracing, AI-based troubleshooting, service maps, and business Workflows.
- Infra Monitoring: Monitor your infra easily with this tool’s cloud-scale metrics, Network Explorer, and Kubernetes Navigator.
- Log Observer Connect: Splunk offers this feature for quick, no-code log monitoring that connects with troubleshooting.
- RUM: Splunk offers real user monitoring for web and mobile with Core Web Vitals (CWB) and trace correlation.
- Synthetic Monitoring: API, uptime, and browser tests with Lighthouse metrics and private locations.
- OpenTelemetry ingestion: Standardized collection via the Splunk distribution of the OTel Collector and supported SDKs.
Pros
- Full-fidelity traces and continuous profiling
- Real-time streaming metrics and fast, high-cardinality alerting
- Strong, unified workflows across APM, infra, logs, RUM, and synthetics
- Mature enterprise posture and scale
Cons
- Pricing high at larger host counts
- Setup and detector tuning can be complex for newcomers
Best for
Enterprises and fast-growing platform teams that need second-level detection, full-fidelity tracing, and integrated workflows across applications, infrastructure, logs, and digital experience, especially in large Kubernetes and multi-cloud environments where high-cardinality data and speed to insight matter.
Splunk Observability Cloud Pricing & Customer Reviews
- Pricing: Infrastructure starts at $15/host/month (annual); APM & Infra at $60/host/month (annual); End-to-End at $75/host/month (annual); RUM at $14 per 10,000 sessions; Synthetic Monitoring at $1 per 10,000 uptime requests
- G2 rating: 4.3/5
- Praised for: full-fidelity traces, real-time analytics, integrated troubleshooting, enterprise scale
- Criticized for: High pricing, setup complexity
Splunk Observability Cloud vs groundcover
Splunk emphasizes real-time analytics and full-fidelity tracing across a broad SaaS suite, while groundcover is Kubernetes-first with eBPF collection and predictable node-based pricing plus BYOC/on-prem options. Choose Splunk when you want second-level detection and unified MELT workflows at enterprise scale. Choose groundcover when per-node predictability and strict in-environment data control are the priority.
Conclusion
While groundcover excels at Kubernetes-first observability with self-hosting/BYOC/on-prem hosting, users face isues with its dashboard and navigation, fewer integration support, poor customer support, and high pricing at scale.
CubeAPM is the most robust alternative to groundcover with its OpenTelemetry-first observability, cost-efficiency at just $0.15/GB, smart sampling to optimize costs, responsive customer supprt, and self-hosting via on-prem and BYOC.
Book a free demo with CubeAPM to explore the platform.
Disclaimer: The information in this article reflects the latest details available at the time of publication and may change as technologies and products evolve.
FAQs
1. Does groundcover support OpenTelemetry and full MELT?
Yes. groundcover ingests OTEL data and provides full MELT coverage (metrics, events, logs, traces) with eBPF-based K8s visibility, plus RUM and synthetics. It is Kubernetes-first by design.
2. What deployment options does groundcover offer vs. alternatives?
groundcover supports self-managed, BYOC, and on-prem modes. Several alternatives are SaaS-only, while CubeAPM also offers self-hosting/BYOC for strict data residency.
3. How does groundcover pricing compare with CubeAPM?
groundcover is node-based (e.g., $20 per host/month); costs rise with average node count. CubeAPM is data-metered at a simple pricing of $0.15/GB; for data-heavy but spiky node patterns.
4. Will we need to re-instrument to leave groundcover?
If you already emit OTEL, usually not. Dual-write via the OTEL Collector during a short POC, validate dashboards/alerts, then cut over without code changes.
5. What should a fair 30-day POC include?
Mirror the same OTEL pipelines, replay a known incident, track MTTR and query latency, and compare monthly cost-to-signal (including retention). Validate RBAC/SSO and on-call workflows.


