Elasticsearch powers critical workloads across search, logging, and analytics — indexing billions of documents and serving real-time queries at scale. Yet, as clusters grow, visibility into node health, query latency, shard balance, and JVM performance becomes essential.
CubeAPM delivers deep, OpenTelemetry-native observability for Elasticsearch. It automatically tracks cluster metrics, slow queries, thread pool saturation, garbage collection, and index latency — correlating them with logs and traces for complete visibility. With smart sampling and $0.15/GB predictable pricing, CubeAPM helps teams monitor Elasticsearch clusters of any size without spiraling costs.
In this guide, we’ll explore how modern observability platforms approach Elasticsearch monitoring, the core features that matter most, and how pricing and scalability differ across solutions.
Top Elasticsearch Monitoring Tools
- CubeAPM
- New Relic
- Datadog
- Dynatrace
- Sumo Logic
- Coralogix
- Grafana Cloud
- Better Stack
What is Elasticsearch Monitoring
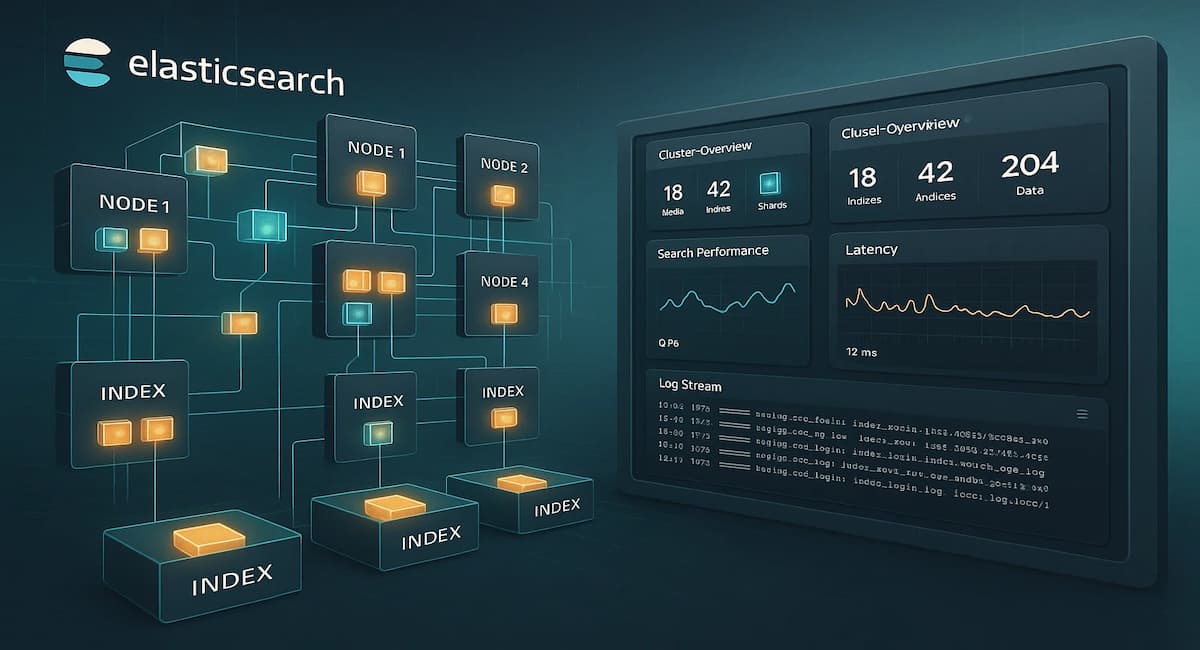
Elasticsearch monitoring is the process of tracking the health, performance, and resource utilization of Elasticsearch clusters to ensure search and indexing workloads run efficiently. It involves collecting and correlating metrics, logs, and traces from all layers of the system — including nodes, indices, shards, queries, and ingestion pipelines.
A robust Elasticsearch monitoring setup typically tracks:
- Cluster and node health: uptime, master elections, JVM heap usage, garbage collection, CPU, and memory.
- Index and shard activity: shard rebalancing, document count, refresh and merge latency, and disk utilization.
- Query and ingestion performance: search latency, indexing throughput, rejected bulk requests, and thread pool saturation.
- Storage and infrastructure metrics: disk pressure, file descriptors, and I/O wait times across nodes.
These signals help teams detect slow queries, prevent data loss during shard relocations, and optimize cluster scaling. When combined with application-level tracing and log correlation, Elasticsearch monitoring provides full observability into how data moves through pipelines and how efficiently search requests are served.
Ultimately, effective monitoring not only improves query speed and cluster stability but also helps control infrastructure costs by identifying inefficient indexing, hot nodes, and over-replication before they impact production.
Example: How CubeAPM Handles Elasticsearch Monitoring
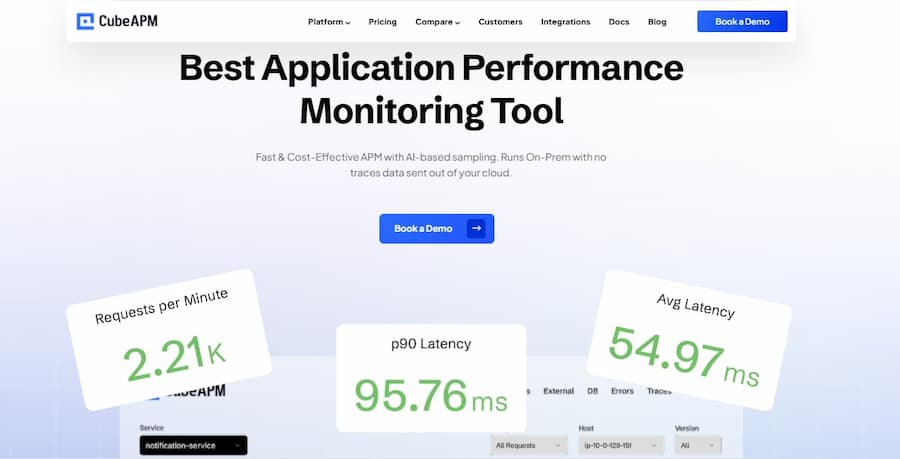
CubeAPM provides end-to-end visibility into Elasticsearch clusters through its OpenTelemetry-native architecture that collects metrics, logs, and traces in real time. It automatically detects Elasticsearch services, captures detailed cluster statistics, and visualizes performance bottlenecks across nodes, shards, and indices within unified dashboards.
The platform’s infrastructure monitoring supports Elasticsearch out of the box, tracking system-level metrics such as CPU, memory, and disk I/O, along with Elasticsearch-specific indicators like indexing latency, query throughput, heap usage, and garbage collection time. Using environment variables or configuration files, teams can easily adjust retention settings, sampling rules, and alert thresholds for production environments.
CubeAPM’s smart sampling engine optimizes data ingestion by retaining high-value traces and dropping redundant ones, keeping telemetry costs predictable at $0.15/GB. It also supports anomaly-based alerting for critical Elasticsearch metrics — such as rejected bulk requests, slow queries, or cluster state changes — ensuring early issue detection before they impact performance.
By combining deep metric visibility, flexible configuration, and transparent pricing, CubeAPM enables SRE and DevOps teams to maintain fast, stable, and cost-efficient Elasticsearch clusters without operational overhead.
Why Teams Choose Different Elasticsearch Monitoring Tools
1. Depth of Elasticsearch-Specific Telemetry
Teams often evaluate tools based on how deeply they capture Elasticsearch internals — including node state, shard allocation, index latency, and query execution metrics. The best platforms expose shard rebalancing, merge operations, cache hit ratios, and garbage collection patterns, giving SREs and developers clear visibility into the root cause of latency or ingestion issues.
2. Correlation Across Logs, Metrics, and Traces
Modern observability depends on connecting Elasticsearch performance to upstream services. Tools that unify logs, metrics, and APM traces help pinpoint issues like API slowdowns caused by search latency or overloaded ingestion pipelines. This correlation dramatically reduces mean time to resolution (MTTR) and helps validate fixes.
3. Scalability and Data Retention
As Elasticsearch clusters grow, so does telemetry volume. Teams choose monitoring solutions that can scale horizontally, support multi-cluster visibility, and allow flexible data retention. Sampling, compression, and tiered storage become essential to keep observability cost-effective over time.
4. Deployment Flexibility
Organizations differ in how they deploy monitoring: some prefer fully managed SaaS for ease of setup, while others require self-hosted or BYOC (bring your own cloud) options for compliance and data sovereignty. Flexibility to run in Kubernetes or hybrid environments is often a deciding factor.
5. Pricing Transparency and Cost Predictability
Because Elasticsearch generates large amounts of telemetry data, pricing models matter. Tools with per-host or per-feature billing can scale unpredictably, while usage-based models that charge per GB of ingestion are easier to estimate. Transparent pricing helps teams plan monitoring budgets accurately.
6. Integration with OpenTelemetry and Ecosystem Tools
Many teams are standardizing on OpenTelemetry for vendor-neutral instrumentation. Monitoring tools that natively ingest OTEL data — including logs, metrics, and traces — allow seamless integration with Elasticsearch exporters, Beats agents, or custom OTEL pipelines.
7. AI-Driven Alerting and Anomaly Detection
With hundreds of metrics emitted per node, static thresholds can’t catch every issue. AI-assisted tools that automatically detect anomalies in indexing latency, search errors, or resource usage reduce noise and highlight real performance regressions.
Top 8 Elasticsearch Monitoring Tools
1. CubeAPM
Known For
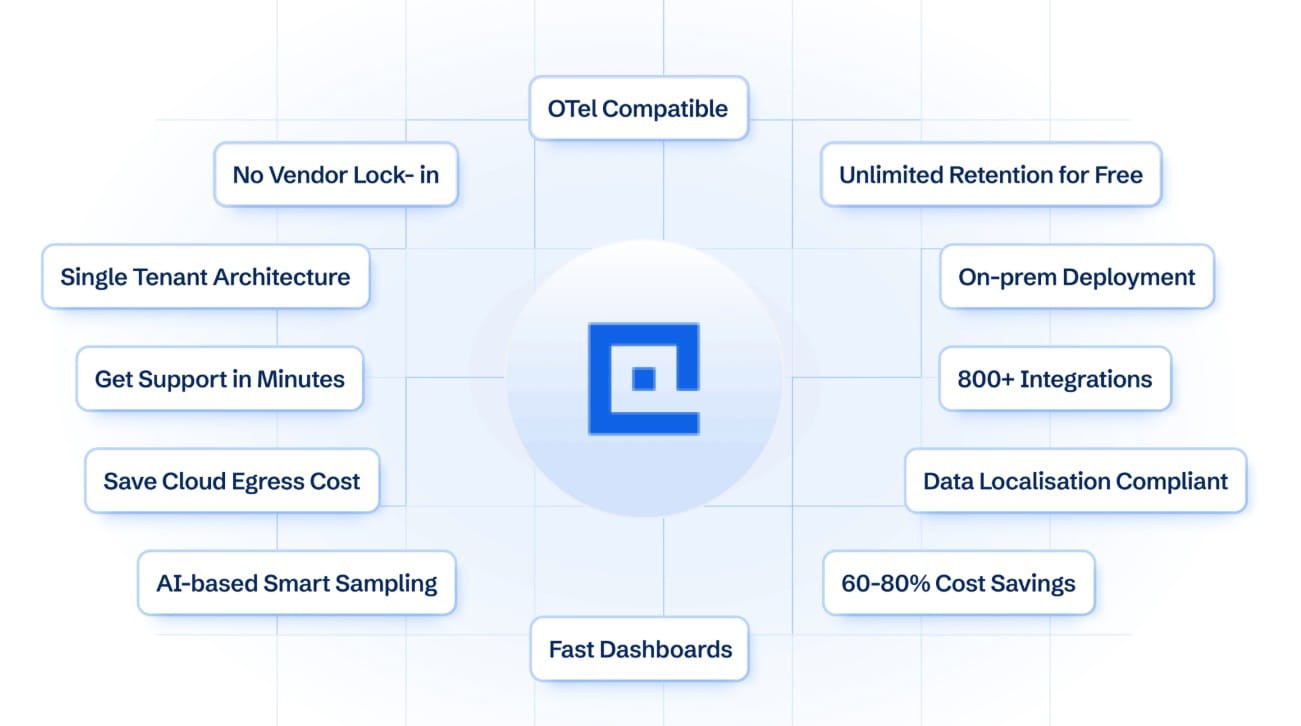
CubeAPM is known for its OpenTelemetry-native observability platform that delivers unified visibility across metrics, logs, traces, and events (MELT). It’s purpose-built for engineering and SRE teams that manage complex distributed systems like Elasticsearch, Kubernetes, and cloud-native workloads.
Elasticsearch Monitoring Features
- Monitors cluster and node health metrics.
- Tracks indexing and query latency in real time.
- Detects thread pool saturation and bulk rejections.
- Visualizes shard distribution and rebalancing.
- Captures JVM heap usage and GC activity.
- Correlates Elasticsearch logs, traces, and metrics.
- Supports anomaly alerts for slow queries or node issues.
- Includes prebuilt dashboards for Elasticsearch performance.
Key Features
- OpenTelemetry-native ingestion for logs, metrics, and traces.
- Unified dashboards for application, database, and infrastructure monitoring.
- Smart sampling to control data volume and cost.
- Flexible self-host or BYOC deployment models.
- 800+ integrations across cloud and container ecosystems.
Pros
- Deep Elasticsearch visibility with correlated MELT data.
- Fully transparent pricing and predictable scaling.
- Lightweight setup with OTEL-native support.
- Strong multi-cluster and multi-cloud compatibility.
Cons
- Not suited for teams looking for off-prem solutions
- Strictly an observability platform and does not support cloud security management
Pricing
CubeAPM offers transparent ingestion-based pricing at $0.15/GB, with an estimated infra cost of ~$0.02/GB for self-hosted setups.
CubeAPM Elasticsearch Monitoring Pricing at Scale
*All pricing comparisons are calculated using standardized Small/Medium/Large team profiles defined in our internal benchmarking sheet, based on fixed log, metrics, trace, and retention assumptions. Actual pricing may vary by usage, region, and plan structure. Please confirm current pricing with each vendor.
For a mid-sized SaaS company ingesting 45TB(~45,000) total monthly data ingestion and 45,000TB of observability data outcharged by the cloud provider, the total cost will be about ~$7200/month.
Tech Fit
CubeAPM is ideal for DevOps, SRE, and observability teams managing distributed Elasticsearch clusters across hybrid or multi-cloud environments. It suits organizations seeking deep telemetry correlation, OpenTelemetry compliance, and cost-efficient scale monitoring without vendor lock-in. Its flexibility makes it equally fit for startups scaling rapidly or enterprises modernizing legacy monitoring pipelines.
2. New Relic
Known For
New Relic is known for its full-stack observability platform that brings together APM, logs, metrics, and infrastructure monitoring under a single user interface. It’s widely adopted among enterprises for its detailed application-level telemetry, strong data visualization capabilities, and integration with hundreds of services — including Elasticsearch. Its usage-based model provides flexibility but can quickly become expensive for high-volume ingest workloads.
Elasticsearch Monitoring Features
- Collects Elasticsearch performance data through native integrations and OpenTelemetry agents.
- Tracks query throughput, latency, and failed requests.
- Monitors cluster and node resource usage (CPU, memory, heap).
- Visualizes indexing performance and bulk request trends.
- Correlates Elasticsearch metrics with APM traces for root-cause analysis.
- Generates alerts for slow queries, rejected requests, and node failures.
- Supports dashboards for cluster health, node roles, and shard status.
- Integrates logs for search and indexing pipelines.
Key Features
- Unified observability for applications, infrastructure, and databases.
- OpenTelemetry compatibility for vendor-neutral instrumentation.
- Real-time alerting with anomaly detection and ML-based baselines.
- Rich dashboards with query-driven visualizations (NRQL).
- Centralized log management and distributed tracing.
Pros
- Mature observability platform with broad ecosystem support.
- Easy integration with Elastic Stack and cloud environments.
- Powerful analytics and visualization engine.
- Strong AI-based anomaly detection.
Cons
- Usage-based pricing can rise quickly with large telemetry volumes.
- Advanced dashboards require learning NRQL (New Relic Query Language).
Pricing
- Free tier with 100 GB/month of ingest data.
- Paid plans use ingestion-based pricing at $0.40/GB beyond the 100GB/month
- Data plus ingest $0.60/GB of ingest data
New Relic Elasticsearch Monitoring Pricing at Scale
A mid-sized SaaS company ingesting 45TB (~45,000 GB) of telemetry data per month and with 10 full users, the cost would come around ~$25,990/month.
Tech Fit
New Relic is best suited for enterprise DevOps teams that need unified APM, infrastructure, and Elasticsearch monitoring under one platform. It fits well for organizations emphasizing visual analytics, anomaly detection, and advanced dashboards, but less so for those requiring predictable pricing or on-premise deployment flexibility.
3. Datadog
Known For
Datadog is known for being an all-in-one observability platform that combines infrastructure monitoring, APM, log management, and security analytics under a single interface. It’s a popular choice for organizations running large-scale, cloud-native Elasticsearch clusters that require real-time insights, anomaly detection, and automated correlation across services.
Elasticsearch Monitoring Features
- Native Elasticsearch integration for collecting cluster, node, and index metrics.
- Monitors query throughput, latency, and rejected operations.
- Tracks JVM heap usage, GC time, and thread pool utilization.
- Visualizes shard allocation, index size, and cache hit ratios.
- Supports anomaly detection for ingestion spikes and search delays.
- Provides dashboards for cluster health, node load, and request errors.
- Sends proactive alerts for node failures and disk saturation.
- Correlates Elasticsearch performance with application traces.
Key Features
- Unified observability across logs, metrics, traces, and security events.
- AI-powered anomaly detection and Watchdog insights.
- Prebuilt dashboards for Elasticsearch and related integrations.
- Centralized log ingestion, search, and retention management.
- Custom dashboards and widgets for query performance visualization.
Pros
- Deep integration ecosystem and out-of-the-box Elasticsearch dashboards.
- Excellent real-time correlation between infrastructure and APM data.
- Strong alerting and anomaly-detection capabilities.
- Highly scalable SaaS architecture.
Cons
- Complex, modular pricing structure.
- Steep learning curve for new users.
- Costs can grow rapidly with log and trace ingestion.
Pricing
- APM (Pro Plan): $35/host/month
- Infra (Pro Plan): $15/host/month
- Ingested Logs: $0.10 per ingested or scanned GB per month
Datadog Elasticsearch Monitoring Pricing at Scale
For a mid-sized SaaS company running 125 APM hosts, 40 profiled hosts, and 100 profiled container hosts, with approximately 500 million indexed spans, 200 infrastructure hosts, 1.5 million container hours, and 300,000 custom metrics—while ingesting about 10 TB (≈10,000 GB) of logs per month with 3,500 indexed logs—the total monthly observability cost would be approximately $27,475.
Tech Fit
Datadog is best suited for mid-to-large enterprises with complex cloud-native environments that prioritize real-time analytics, automated detection, and seamless integrations.
4. Dynatrace
Known For
Dynatrace is known for its AI-powered observability platform that automates root-cause analysis across infrastructure, applications, and user experience. Its Davis AI engine continuously analyzes billions of dependencies, making it a strong choice for teams that need automated insights and anomaly detection.
Elasticsearch Monitoring Features
- Monitors Elasticsearch cluster and node health automatically via OneAgent.
- Tracks indexing throughput, query latency, and ingestion failures.
- Detects JVM and heap pressure, GC duration, and CPU saturation.
- Visualizes shard balance, node roles, and disk utilization trends.
- Correlates Elasticsearch performance with connected applications and APIs.
- Provides auto-baselined anomaly detection using Davis AI.
- Supports dashboards for cluster health and search response times.
- Sends alerts for node failures, thread pool rejections, or high latency.
Key Features
- AI-driven root-cause detection (Davis AI engine).
- Full-stack monitoring with automated dependency mapping.
- Unified observability across logs, metrics, and traces.
- End-to-end visibility for Kubernetes, VMs, and cloud services.
- Automated baselining for Elasticsearch performance metrics.
Pros
- Powerful AI-assisted analysis for Elasticsearch environments.
- Zero-configuration OneAgent simplifies deployment.
- Excellent visualization and performance correlation.
- Enterprise-grade scalability and automation.
Cons
- Expensive options at scale.
- Overwhelming UI for beginners.
- Complex licensing model with several tiers and add-ons.
Pricing
- Infrastructure Monitoring: $29 / mo per host
- Full-Stack Monitoring: $58 / mo per 8 GiB host
Dynatrace Elasticsearch Monitoring Pricing at Scale
For a midsized SaaS company running 125 APM hosts and 200 infrastructure hosts, ingesting approximately 10 TB (≈10,000 GB) of logs per month, tracking 300,000 custom metrics, consuming 1.5 million container hours, and generating around 45,000 GB of observability data egress (billed by the cloud provider), the total monthly cost would be approximately $21,850.
Tech Fit
Dynatrace is ideal for large enterprises and complex environments where AI-driven insights and automation outweigh cost considerations. It fits organizations running mission-critical Elasticsearch clusters that require continuous anomaly detection, automatic baselining, and full-stack visibility across distributed systems.
5. Sumo Logic

Known For
Sumo Logic is known for its cloud-native log analytics and observability platform that provides real-time monitoring across applications, infrastructure, and security layers. Built for scalability and continuous intelligence, it integrates seamlessly with Elasticsearch to help teams analyze search performance, query latency, and ingestion behavior.
Elasticsearch Monitoring Features
- Collects Elasticsearch logs and metrics via native integrations.
- Monitors search latency, indexing throughput, and node resource usage.
- Detects ingestion spikes, shard imbalances, and node failures.
- Visualizes cluster health and index activity over time.
- Supports anomaly alerts for rejected requests or slow queries.
- Provides query-based dashboards for Elasticsearch performance.
- Correlates logs from multiple clusters for unified visibility.
- Integrates with OpenTelemetry and cloud-native environments.
Key Features
- Cloud-native platform with log, metric, and trace ingestion.
- Real-time analytics for anomaly and trend detection.
- Advanced query language for filtering and correlation.
- Centralized dashboards for Kubernetes, Elasticsearch, and APIs.
- Built-in security and compliance monitoring features.
Pros
- Simple SaaS setup with strong Elasticsearch integrations.
- Scalable log analytics for large environments.
- Good visualization and query capabilities.
- Compliance-ready with SOC 2 Type II and HIPAA certifications.
Cons
- Ingestion-based pricing can grow rapidly at scale.
- Query language can be steep for new users.
Pricing
- Starts around $3.30–$4.50 per TB scanned
- Additional costs for metrics, tracing, and long-term retention
Sumo Logic Elasticsearch Monitoring Pricing at Scale
For a midsized SaaS ingesting 45TB(~45,000GB) of logs per month and 45,000GB of observability data out(charged by cloud provider), the cost would come around ~$16,065/month.
Tech Fit
Sumo Logic is best suited for enterprises running managed Elasticsearch clusters or hybrid environments that need powerful log correlation, compliance readiness, and minimal infrastructure overhead. It’s ideal for teams prioritizing analytics depth and security visibility, though less suited for cost-sensitive or self-hosted observability strategies.
6. Coralogix
Known For
Coralogix is known for its real-time log analytics and full-stack observability platform designed to reduce log storage costs while maintaining deep visibility. It’s popular among engineering teams using Elasticsearch or ELK-based pipelines, as it provides high ingestion efficiency, built-in security compliance, and advanced ML-based insights. Coralogix is particularly focused on optimizing telemetry cost through its Log Lifecycle Management, which routes data between hot, warm, and cold tiers automatically.
Elasticsearch Monitoring Features
- Collects logs, metrics, and traces from Elasticsearch clusters.
- Monitors query latency, indexing rate, and node resource usage.
- Tracks ingestion volumes and cluster load trends.
- Visualizes shard performance and cache efficiency.
- Supports alerts for slow queries, errors, and rejected operations.
- Uses ML to detect anomalies in indexing or search patterns.
- Correlates Elasticsearch events with upstream application traces.
- Provides retention and cost optimization policies for log data.
Key Features
- Log Lifecycle Management for automated tiered storage.
- Full MELT observability with real-time insights.
- ML-powered alerting and pattern-based anomaly detection.
- Prebuilt dashboards for Elasticsearch, Kubernetes, and APIs.
- Compliance-ready architecture (SOC 2, HIPAA, GDPR).
Pros
- Advanced cost optimization for large-scale log workloads.
- Excellent performance for real-time log querying.
- Powerful correlation across metrics, logs, and traces.
- Secure, compliance-ready observability stack.
Cons
- Steep learning curve
- Overwhelming UI that makes navigation a challenge
Pricing
- Logs: $0.42/GB
- Traces: $0.16/GB
- Metrics: $0.05/GB
- AI: $1.5 per 1M tokens
Coralogix Elasticsearch Monitoring Pricing at Scale
For a midsized SaaS company ingesting 25,000 GB of telemetry from APM hosts, 10,000 GB from infrastructure hosts, and 10,000 GB from log sources—along with approximately 45,000 GB of observability data egress billed by the cloud provider—the total monthly cost would be around $13,200.
Tech Fit
Coralogix is ideal for teams running Elasticsearch-heavy pipelines that prioritize cost-efficient log retention, real-time insights, and ML-powered monitoring. It fits DevOps, SRE, and security teams seeking an alternative to expensive ELK or SaaS observability tools.
7. Grafana Cloud
Known For
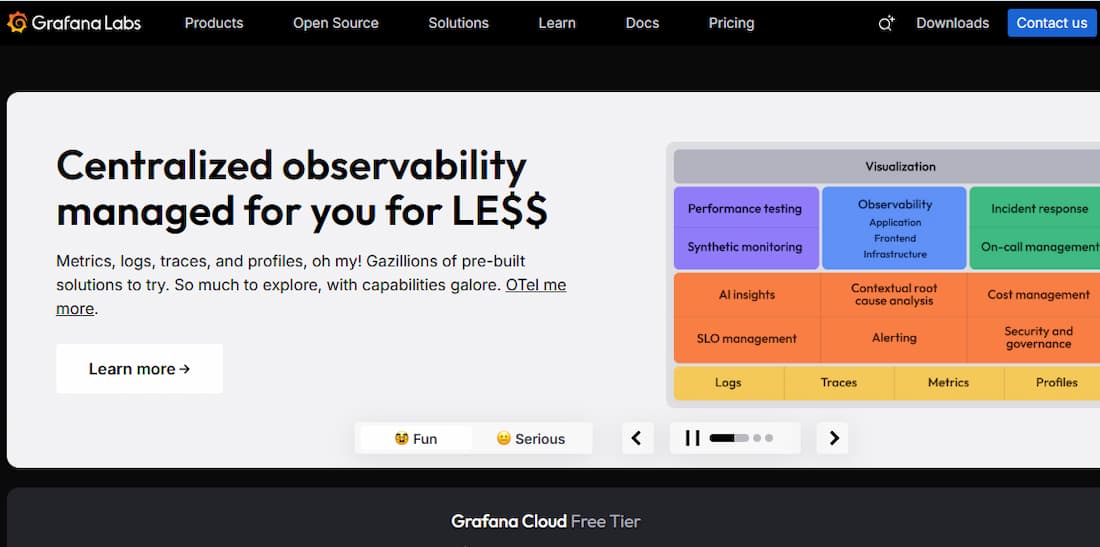
Grafana Cloud is known for its open-source-based observability platform that integrates metrics, logs, and traces through Prometheus, Loki, and Tempo. It’s widely used by DevOps teams who want flexibility, open standards, and strong visualization without full vendor lock-in. Grafana’s native support for Elasticsearch as a data source makes it a preferred choice for teams already running ELK or OpenTelemetry pipelines but seeking advanced dashboards and cost-efficient monitoring at scale.
Elasticsearch Monitoring Features
- Connects directly to Elasticsearch as a native data source.
- Visualizes cluster and node health metrics in Grafana dashboards.
- Tracks query latency, indexing performance, and heap utilization.
- Displays shard and index-level performance statistics.
- Supports alerting on Elasticsearch metrics via Prometheus or Alertmanager.
- Correlates logs and traces from Loki and Tempo with Elasticsearch queries.
- Allows customized dashboards using Elasticsearch queries (Lucene or DSL).
- Integrates with OpenTelemetry collectors for unified ingestion.
Key Features
- Unified observability with metrics (Prometheus), logs (Loki), and traces (Tempo).
- Rich visualization and dashboard customization capabilities.
- Supports over 100+ data sources including Elasticsearch.
- Scalable SaaS and self-hosted Grafana Enterprise options.
- Built-in alerting and anomaly detection for time-series data.
Pros
- Highly flexible, open-source foundation with no lock-in.
- Native Elasticsearch visualization and dashboarding.
- Strong community support and plugin ecosystem.
- Cost-effective monitoring compared to premium SaaS tools.
Cons
- Requires integration setup for full log and trace visibility.
- Limited AI/ML-driven analysis out of the box.
- Query performance depends on the connected data source.
Pricing
- Logs: $0.50 / GB
- Traces: $0.30 / GB
- Metrics: $0.10 per 10K active series
- Pro Plan: $299 / month for 3 users
- Enterprise Tier: Custom pricing for large-scale ingestion and advanced features
Grafana Cloud Elasticsearch Monitoring Pricing at Scale
For a mid-sized company running 125 APM hosts and 200 infrastructure hosts, ingesting approximately 10 TB (≈10,000 GB) of logs per month, and generating around 45,000 GB of observability data egress billed by the cloud provider, the total monthly cost would be approximately $11,875.
Tech Fit
Grafana Cloud is best for DevOps and observability teams that want flexibility, open-source compatibility, and granular control over dashboards and alerting. It’s ideal for hybrid and multi-cloud environments where teams already rely on Prometheus, Loki, or Elasticsearch for telemetry.
8. Better Stack
Known For
Better Stack is known for its modern log management and incident response platform that combines observability, collaboration, and uptime monitoring in a single suite. It’s built around Better Stack Logs (formerly Logtail) and Better Uptime, making it a strong choice for teams that need visibility into Elasticsearch clusters alongside fast alerting and visualization. Its SQL-based querying and real-time dashboards offer a simpler, more intuitive experience compared to traditional ELK setups.
Elasticsearch Monitoring Features
- Collects Elasticsearch logs, metrics, and errors via native integrations.
- Monitors cluster and node performance, indexing rates, and slow queries.
- Tracks heap usage, GC duration, and ingestion failures.
- Correlates Elasticsearch logs with application events and traces.
- Visualizes cluster status and node health in real-time dashboards.
- Supports alerting on query latency, failed searches, and rejected requests.
- Enables retention-based log filtering and structured querying via SQL.
- Integrates with Grafana, Slack, and PagerDuty for seamless alert workflows.
Key Features
- Centralized log management and structured querying.
- Built-in incident management and uptime monitoring.
- Real-time log streaming with powerful search and filters.
- Secure data storage with access control and encryption.
- Visual dashboards and anomaly alerts for Elasticsearch clusters.
Pros
- Clean, intuitive interface with SQL-based log querying.
- Combines observability with uptime and incident response.
- Fast setup and minimal learning curve.
- Affordable plans for small and mid-sized teams.
Cons
- Expensive when scaling operations.
- Users report missing features like outgoing webhooks that limit usability.
- Steep learning curve.
- Complex initial setup and configuration.
Pricing
- Logs & Traces: $0.15 / GB ingested
- Extended Retention: $0.60 / GB per month
- Metrics: $7.50 / GB for additional data points
Better Stack Elasticsearch Monitoring Pricing at Scale
For a mid-sized SaaS company operating 125 APM hosts, ingesting approximately 25 TB (≈25,000 GB) of APM telemetry, 10 TB (≈10,000 GB) of logs, and 10 TB (≈10,000 GB) of infrastructure data—along with around 45,000 GB of observability data egress billed by the cloud provider—the total monthly cost would be approximately $20,550.
Tech Fit
Better Stack is best suited for startups and mid-sized DevOps teams that need fast log visibility, integrated uptime monitoring, and lightweight Elasticsearch observability in a single SaaS platform. It fits teams focused on operational simplicity and collaboration rather than deep APM or full-stack telemetry, offering a balance between usability, performance, and affordability.
Conclusion
Monitoring Elasticsearch isn’t just about uptime — it’s about understanding query performance, indexing efficiency, and cluster health in real time. The right observability platform helps teams catch latency issues, optimize resources, and maintain fast, stable search experiences.
While each tool brings unique strengths, CubeAPM offers the best balance of visibility, cost predictability, and flexibility. Its OpenTelemetry-native architecture, prebuilt Elasticsearch dashboards, and $0.15/GB pricing make it a powerful yet affordable choice for modern DevOps and SRE teams.
For organizations managing Elasticsearch at scale, adopting a transparent and scalable observability platform like CubeAPM ensures consistent performance, faster troubleshooting, and long-term reliability.
Disclaimer: The information in this article reflects the latest details available at the time of publication and may change as technologies and products evolve.
FAQs
1. What are Elasticsearch monitoring tools?
Elasticsearch monitoring tools help track the performance and health of Elasticsearch clusters by collecting metrics like indexing rate, query latency, shard status, and JVM usage. They provide dashboards, alerts, and insights to detect bottlenecks and maintain stable search performance.
2. Why is monitoring Elasticsearch important?
Monitoring Elasticsearch ensures clusters remain healthy, responsive, and balanced. It helps detect slow queries, memory pressure, and node failures early — preventing outages and improving the reliability of search and analytics applications.
3. How does CubeAPM monitor Elasticsearch?
CubeAPM offers OpenTelemetry-native monitoring with prebuilt dashboards for Elasticsearch clusters. It tracks heap usage, query latency, thread pool activity, and indexing performance while correlating logs, metrics, and traces for faster troubleshooting — all with transparent $0.15/GB pricing.
4. What key metrics should I monitor in Elasticsearch?
Focus on cluster health, node uptime, query latency, indexing throughput, heap utilization, garbage collection, and shard rebalancing. These metrics reveal performance trends and help teams scale Elasticsearch efficiently.
5. Which is the best tool for Elasticsearch monitoring?
Tools like Datadog, New Relic, and Dynatrace offer advanced features, but CubeAPM stands out for its cost efficiency, deep telemetry correlation, and OpenTelemetry-native design — making it ideal for teams seeking affordable, enterprise-grade Elasticsearch observability.


