Cron job monitoring tools help teams ensure scheduled tasks, like database backups, billing jobs, and PHP scripts, run reliably. With downtime costing businesses over $14,000 per minute as of 2025, failures or delays in cron jobs can create serious operational and financial risks.
The challenge lies in choosing the right solution. Many cron job monitoring tools have hidden costs, noisy or delayed alerts, limited retention, and steep learning curves, leaving teams frustrated when failures are discovered too late. PHP developers especially struggle with visibility into script runtimes, memory leaks, or failed processes.
CubeAPM is the best Cron job monitoring tool provider, offering smart sampling, PHP-FPM monitoring, full-stack tracing, and unlimited retention, helping teams catch failures in real time while keeping costs predictable. In this article, we’ll review the top cron job monitoring tools, their pricing, features, and best use cases.
Top 9 Cron Job Monitoring Tools
- CubeAPM
- Datadog
- New Relic
- Dynatrace
- Cronitor
- Healthchecks.io
- Better Stack (Better Uptime)
- Sentry (Cron Monitoring)
- Dead Man’s Snitch
What is a Cron Job Monitoring Tool?
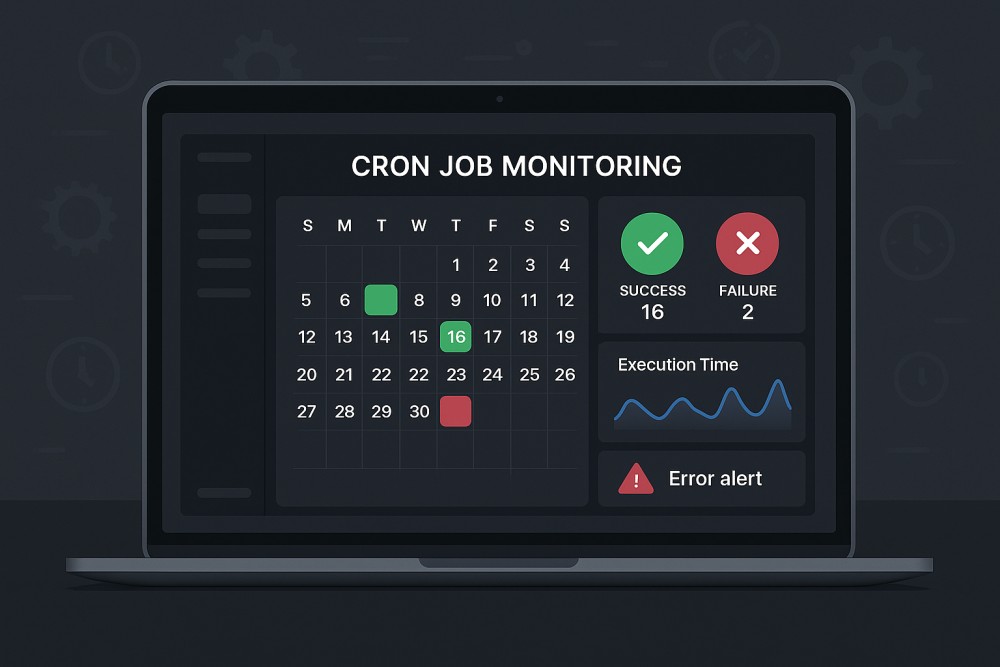
A cron job monitoring tool is a platform that tracks and validates the execution of scheduled tasks—such as backups, batch jobs, billing runs, or API syncs to ensure they run on time and complete successfully. Instead of relying on manual log checks, these tools provide automated alerts, historical execution data, and deep visibility into failures or anomalies.
For modern businesses, the importance of cron job monitoring is clear: downtime or missed jobs can lead to financial loss, compliance violations, and frustrated customers. Advanced monitoring tools reduce these risks by making job health visible and actionable. Key benefits include:
- Automated validation: Ensures every scheduled task runs on time and finishes without silent failures
- Real-time alerts: Notifies engineers instantly via Slack, email, or PagerDuty when a job fails or exceeds runtime thresholds
- Root-cause analysis: Correlates Cron job failures with logs, traces, and infrastructure metrics for faster resolution
- Cost efficiency: Prevents resource wastage and reduces MTTR with intelligent sampling and retention policies
- Compliance readiness: Maintains a historical record of scheduled jobs, useful for audits and SLA reporting
Example: Monitoring PHP Database Cleanup Cron job with CubeAPM
A PHP-based e-commerce platform uses CubeAPM to monitor its nightly cron job for database cleanup. When the job encounters a memory leak or a slow query, CubeAPM instantly triggers an alert via Slack. Engineers can drill down into correlated PHP-FPM metrics, trace the failing query, and identify whether the root cause lies in application logic or infrastructure. This proactive visibility ensures the issue is fixed before customers experience degraded performance the next morning.
Why Teams Choose Different Cron Job Monitoring Tools
Cost Predictability at Scale
Cron jobs often run in bursts—end-of-day reports, end-of-month billing, or nightly data syncs. With tools that charge per host, per run, or per GB ingested, costs can spike unpredictably. Users on G2 and Reddit frequently cite surprise bills from vendors like Datadog, where pricing combines hosts, custom metrics, and retention charges. This pushes teams to look for flatter, volume-based models that stay predictable even when cron loads grow.
Cron-Aware Scheduling Semantics
Unlike generic monitors, cron monitoring must understand scheduling nuances. Daylight Saving Time (DST) shifts can trigger duplicate or skipped runs, while clock drift can cause jobs to miss their execution windows. Teams want tools that evaluate jobs against SLA windows (e.g., “should have run by 02:15 local time”) and catch missed runs immediately, not hours later. (Reddit r/devops)
Noise Control & On-Time Notifications
One of the most common complaints is alert fatigue, tools that spam engineers with redundant failure alerts, or worse, only alert after an entire batch fails. Cron job monitoring solutions that support heartbeat checks, “missed run by X minutes” alerts, and runtime anomaly detection give teams cleaner signals and faster responses.
Fit-for-Purpose UX for Cron
Teams don’t just want logs—they want a visual timeline of job histories, SLA tracking, and captured stdout/stderr for debugging. Tools like Cronitor and Healthchecks.io have gained traction because they treat cron as a first-class object, making it easy to verify past runs, durations, and outcomes at a glance. This UX focus is a deciding factor when teams switch vendors.
OpenTelemetry-First Pipelines
More teams want cron telemetry (job start, runtime, errors) to flow through OpenTelemetry for consistency with the rest of their observability stack. Tools that are OTel-first allow teams to avoid vendor lock-in and send data without being penalized as “custom metrics.” This is especially important in environments mixing Kubernetes Cron jobs, serverless functions, and classic crontabs.
Strong Cross-Signal Correlation
When a 2 AM backup job fails, engineers don’t just need an error alert—they need to see the failing trace, correlated logs, and host metrics from that specific run. Modern Cron job monitoring tools with cross-signal correlation reduce mean time to resolution (MTTR) by tying job health directly to system performance and error data.
Bonus: Scale & Security Considerations
Enterprises often run thousands of scheduled jobs across Linux servers, Kubernetes Cron jobs, Jenkins, or Rundeck. They also face security risks—attackers have been known to persist by modifying crontab entries. Advanced teams, therefore, evaluate whether a monitoring tool can unify visibility across schedulers and track unauthorized cron changes as part of their audit trails.
Top 9 Cron Job Monitoring Tools
1. CubeAPM
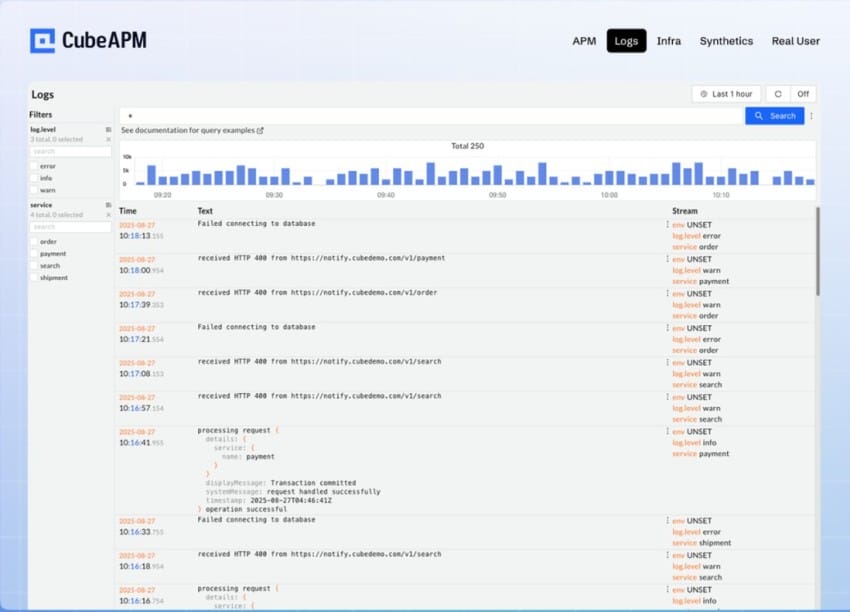
Overview
CubeAPM is known for unifying Cron job health with full-stack observability, tying a single run’s status to its logs, traces, and infrastructure metrics, so teams can see what ran, how long it took, and why it failed in one place. Its OpenTelemetry-first design, Kubernetes awareness, and lightweight heartbeats make it a strong pick for engineering teams that want cron-specific visibility without juggling multiple tools.
Key Advantage
End-to-end correlation for a single cron run, jump from a “missed/late/failed” alert straight into the exact trace, logs, and host or container metrics for that execution window.
Key Features
- Cron-aware monitors & SLAs: Detect late, missed, or duplicate runs with schedule windows and grace periods.
- Heartbeat check-ins: Simple start/finish pings for crontab, systemd timers, Kubernetes Cron jobs, or CI schedulers.
- Runtime baselines: Track p95/p99 durations, over-run/under-run alerts, and capture stdout/stderr for fast triage.
- OTel-native correlation: Preserve trace ↔ log ↔ metric links per run for quicker root-cause analysis.
- Kubernetes Cron jobs visibility: Surface job completions, failures, and pod-level signals alongside service health.
Pros
- Unified view of run status, performance, and errors
- OpenTelemetry-first pipeline that avoids lock-in
- Works across Linux cron, systemd, Kubernetes, and CI schedulers
- Responsive alerting with “missed-run by X minutes” and anomaly detection
- Designed to keep ingestion overhead low for bursty EOD/EOM windows
Cons
- Not ideal for teams that only want a hosted-only, off-prem SaaS with no BYOC/on-prem option
- Focuses on observability and does not include cloud security posture management
CubeAPM Pricing at Scale
CubeAPM uses a transparent pricing model of $0.15 per GB ingested. For a mid-sized business generating 45 TB (~45,000 GB) of data per month, the monthly cost would be ~$7,200/month.
Tech Fit
Great fit for PHP (including PHP-FPM) as well as Node.js, Python, Java, Go, and Ruby; supports Linux crontab and systemd timers, Kubernetes Cron jobs, and CI/CD schedulers. Plays well with OpenTelemetry, Prometheus scrapes, and common log collectors, making it easy to bring cron telemetry into the same pipeline as the rest of your stack.
*All pricing comparisons are calculated using standardized Small/Medium/Large team profiles defined in our internal benchmarking sheet, based on fixed log, metrics, trace, and retention assumptions. Actual pricing may vary by usage, region, and plan structure. Please confirm current pricing with each vendor.
2. Datadog
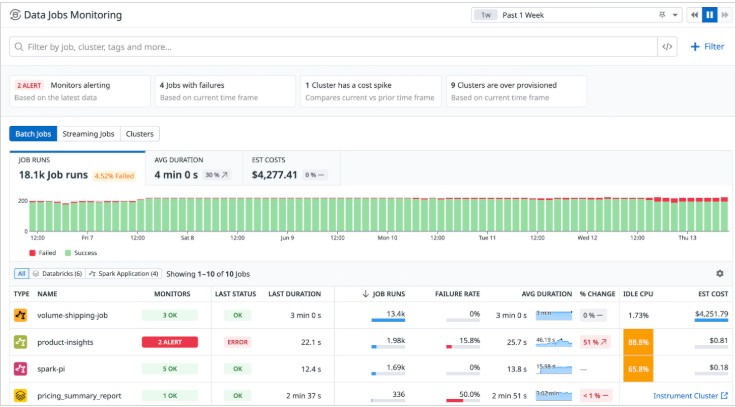
Overview
Datadog is a well-established observability platform that many enterprises adapt for Cron job monitoring. By combining synthetic API tests (used as cron heartbeats), log and trace ingestion, and built-in security rules for cron changes, Datadog provides a versatile approach to tracking scheduled jobs. Its wide ecosystem and integrations make it attractive to large teams already standardizing on Datadog, though its pricing model is often a challenge when cron workloads scale.
Key Advantage
Datadog’s biggest strength is flexibility: it supports multiple approaches to cron monitoring—heartbeat checks with Synthetics, missed-run alerts via log ingestion, and security rules for unauthorized cron file changes—all within the same platform.
Key Features
- Cron change detection: Security rules alert on suspicious cron file creations or modifications.
- Cron service hygiene: Prebuilt detections for monitoring and securing cron/crond usage on Linux hosts.
- Synthetic API monitors: Use scheduled tests as job “check-ins” to confirm jobs ran on time.
- Data Jobs Monitoring: Native support for scheduled pipelines (e.g., Spark, Airflow, EMR, Dataproc).
- Log and APM correlation: Combine stdout/stderr logs, traces, and infra metrics for end-to-end job visibility.
Pros
- Enterprise-grade breadth across APM, logs, synthetics, and security
- Flexible cron monitoring patterns for different environments
- Mature dashboards and notification integrations
- Strong adoption in Kubernetes and data engineering pipelines
Cons
- SaaS-only platform; no self-hosting
- Could be costly for smaller teams
Datadog Pricing at Scale
Datadog charges differently for different capabilities. APM starts at $31/month; infra starts at $15/month; logs start at $0.10/GB, and so on. For a mid-sized business ingesting around 45 TB (~45,000 GB) of data per month, the cost would come around $27,475/month.
Tech Fit
Datadog is best suited for large, polyglot environments already invested in its ecosystem. It supports Linux crontab and systemd timers (via log/APM ingestion), Kubernetes Cron jobs (via k8s integrations), and modern data job schedulers like Spark and Airflow. It’s a fit if you want cron job monitoring tightly woven into a broader enterprise observability and security stack.
3. New Relic
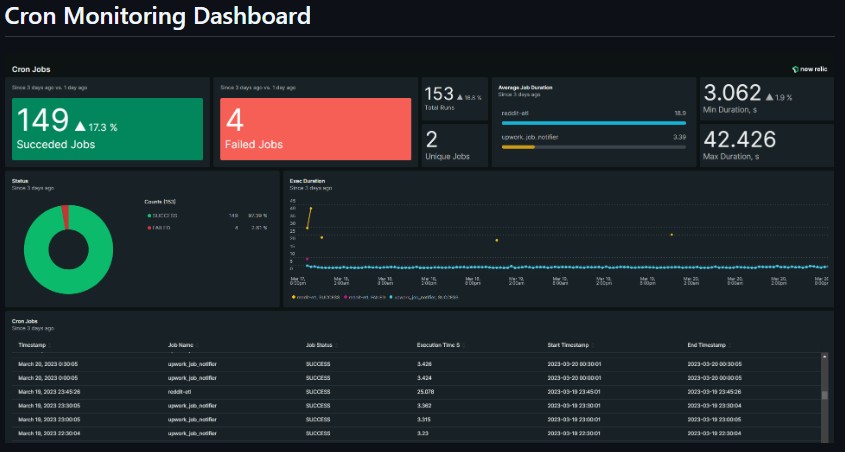
Overview
New Relic is a usage-based observability platform that teams often adapt for Cron job monitoring by mixing loss-of-signal NRQL alerts, lightweight custom events from jobs, and (when needed) Synthetics to act as scheduled “check-ins.” The appeal is familiar: keep cron status, job duration, and error signals alongside app, infra, and Kubernetes telemetry you already collect.
Key Advantage
Flexible cron coverage—use NRQL loss-of-signal for “should have run by now,” push custom events from your jobs, or schedule Synthetics when you need heartbeat-style checks without code changes.
Key Features
- Loss-of-signal monitors: Set an alert that fires if a job’s signal doesn’t arrive within the expected window (works for jobs that run more often than the 48-hour LoS limit).
- NRQL alert conditions: Express “late/missed” logic and duration thresholds with queries instead of brittle per-host checks.
- Custom cron events: Emit a small event per run (start/end, status, duration) and dashboard it for run histories and SLAs.
- Synthetics scheduling: Use scheduled monitors or private locations to approximate heartbeat pings when you can’t change the job code.
- Operational guardrails: Pause monitors during maintenance windows so your nightly batches don’t page on-call unnecessarily.
Pros
- Multiple paths to monitor cron without re-architecting jobs
- Runs in the same place as your app, infra, and k8s telemetry
- Mature dashboards, alerts, and integrations
- Works across classic crontab, Kubernetes Cron jobs, and data pipelines
Cons
- Query-driven setup (NRQL) adds a learning curve for nuanced “late/missed” logic
- Usage components and options can make the total cost harder to predict than pure per-GB models
- SaaS-only
New Relic Pricing at Scale
New Relic’s billing is based on data ingested, user licenses, and optional add-ons. The free tier offers 100 GB of ingest per month, then it costs $0.40 per GB after that. For a business ingesting 45 TB of logs per month, the cost would come around $25,990/month.
Tech Fit
Good fit when you already standardize on New Relic and want cron status in the same pane as application traces and infra metrics. Plays well with Linux crontab/systemd, Kubernetes Cron jobs (via events/logs/metrics), and data pipelines that can emit custom events or be probed via Synthetics/private locations.
4. Dynatrace
Overview
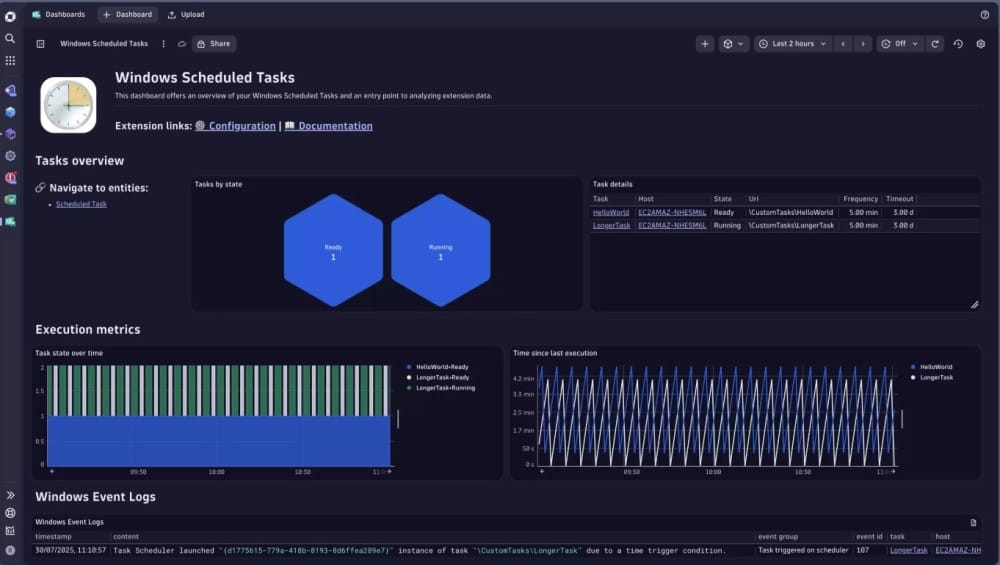
Dynatrace is recognized for enterprise-grade observability powered by Davis® AI, which gives automated context for issues across applications, infrastructure, and scheduled workloads. For Cron job monitoring, it provides both native coverage for Windows Scheduled Tasks and flexible log-driven patterns for Linux cron, Kubernetes Cron jobs, and custom batch systems. This makes it appealing to large organizations that need deep diagnostics and AI-assisted root-cause analysis for their scheduled jobs.
Key Advantage
Dynatrace offers dual coverage: out-of-the-box support for Windows Scheduled Tasks and customizable log/DQL workflows for any batch system. This combination ensures you can detect late, missed, or long-running jobs across mixed estates with AI-powered insights.
Key Features
- Windows Scheduled Tasks extension: Monitor failures, hangs, and missed executions with problem notifications and “time since last run” metrics.
- Batch-job log parsing: Use Grail log storage to extract start and end markers, compute durations, and track job health.
- Workflows and automation: Build recurring checks that alert if a cron job hasn’t run or has exceeded runtime thresholds.
- Open ingestion paths: Capture cron telemetry via OneAgent, OpenTelemetry, or Fluent Bit to unify job data with broader observability.
- Extensions 2.0 support: Extend monitoring to custom schedulers or specialized workloads beyond classic cron.
Pros
- AI-driven anomaly detection with Davis for quick problem context
- Native monitoring for Windows Scheduled Tasks with detailed metrics
- Powerful log-driven workflows for Linux cron and Kubernetes Cron jobs
- Flexible ingestion with OneAgent, OTel, or Fluent Bit
- Scales well across hybrid and multi-cloud environments
Cons
- Expensive for smaller teams, and layered pricing (ingestion, retention, and synthetic checks) increases complexity
- DQL parsing and workflow setup add a learning curve
Dynatrace Pricing at Scale
- Full stack: $0.01/8 GiB hour/month or $58/month/8GiB host
- Log Ingest & process: $0.20 per GiB
For a similar 45 TB (~45,000 GB/month) volume, the cost would be $21,850/month.
Tech Fit
Dynatrace is a strong fit for enterprises that run mixed environments, Windows Scheduled Tasks, Linux cron, systemd timers, and Kubernetes Cron jobs, and need job telemetry analyzed alongside application performance and infrastructure health. It is especially suited to organizations that benefit from Davis® AI for reducing alert noise and speeding up root-cause analysis across large, complex estates.
5. Cronitor
Overview
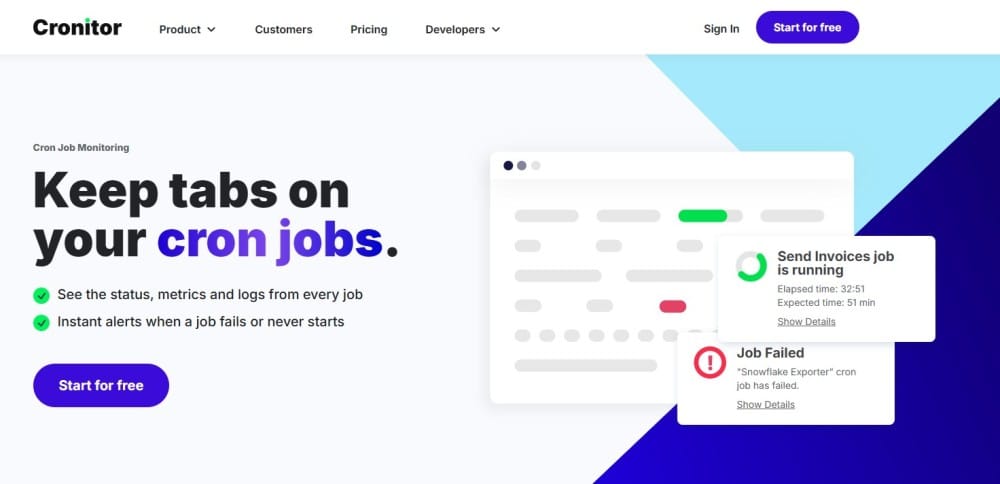
Cronitor is a cron-first monitoring platform known for precise, schedule-aware alerts, clean run timelines, and automatic capture of per-run metrics and logs. It’s positioned as the “single pane” for scheduled jobs—Linux crontab, Kubernetes Cron jobs, Windows tasks, and background workers—so teams can see late, missed, long-running, or failed executions at a glance.
Key Advantage
Purpose-built cron monitoring with schedule tolerance, grace periods, and performance assertions—so you can alert on “should-have-run,” “running too long,” or “exited too quickly” without writing custom glue.
Key Features
- Schedule semantics & tolerances: Define cron/interval/time-of-day schedules with grace periods and failure/schedule tolerances to curb noise.
- Lifecycle pings & assertions: Send run/complete/fail events; add max/min duration assertions to catch hangs and partial successes.
- Logs & metrics per run: Automatically correlate job output and key metrics with each execution for fast triage.
- Kubernetes & CLI auto-discover: Helm-deployable k8s agent and cronitor discover/exec/ping CLI to auto-find jobs and keep schedules in sync.
- SDKs & API: Official SDKs (Python/Node/PHP/Ruby, etc.) and a simple Telemetry API for quick integration.
Pros
- Cron-first UX with timeline views and “missed/late” intelligence
- Grace periods, schedule tolerance, and performance assertions reduce alert fatigue
- Easy rollout via CLI, SDKs, and HTTP pings
- Good multi-environment support and rich notification integrations
- Kubernetes Cron job support without stitching Prometheus rules
Cons
- Not a full-stack observability platform
- Costs scale with cron or monitor count; large fleets may pay more if the job count is very high
Cronitor Pricing at Scale
According to Cronitor’s official pricing, the Business plan is charged per monitor ($2/monitor/month) and per user ($5/user/month), includes unlimited API requests, and provides 12-month data retention, with pricing not tied to data volume . Using the example of 300 monitors and 10 users, the monthly cost is (300 × $2) + (10 × $5) = $650. Because Cronitor pricing is usage-based by monitors and users rather than GB ingested, this cost remains $650/month even if log volume increases from 10 TB to 45 TB in the broader observability stack.
Tech Fit
Great for teams that want cron-native monitoring across Linux cron, systemd timers, Kubernetes Cron jobs, and Windows scheduled tasks, with quick integrations for Python, Node.js, PHP, Ruby, and more. If you primarily need job correctness and schedule SLAs (not deep APM), Cronitor is an excellent fit; if you also need trace/log/infra correlation for broader outages, pairing with an observability platform like CubeAPM can make sense.
6. Healthchecks.io
Overview
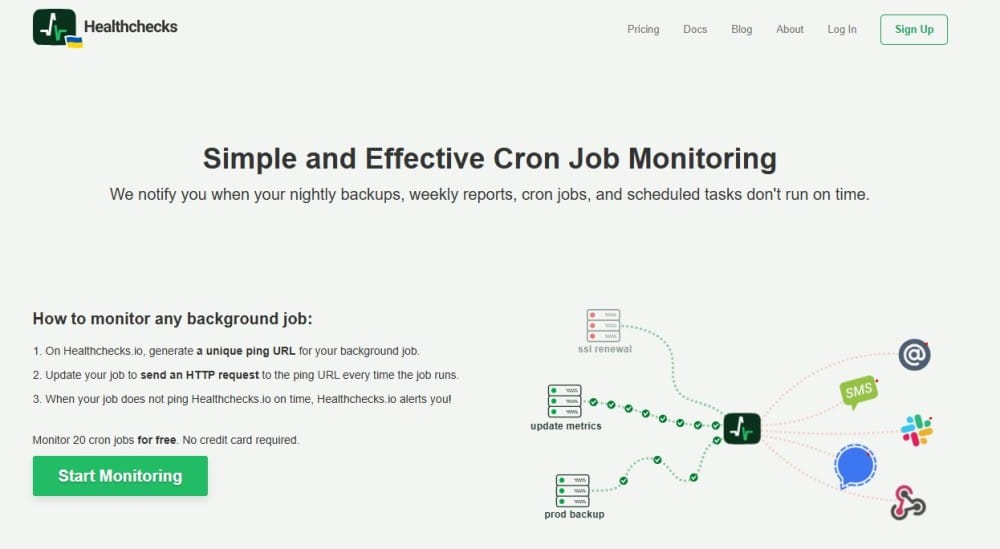
Healthchecks.io is a cron-first heartbeat service: each job gets a unique ping URL and the service alerts you when a run is late, missing, or times out. You can signal start, success, failure, or even pass an exit status, and set a fixed period or a cron expression with a grace time. Teams like it for its zero-agent setup, clean run timelines, generous integrations, and the option to self-host the open-source code if you need full control.
Key Advantage
Purpose-built heartbeat monitoring that’s schedule-aware and dead simple to wire up—ideal when you primarily need “did it run on time?” assurance with minimal overhead.
Key Features
- Heartbeat endpoints: Per-job ping URLs that accept start, success, fail, and exit-status signals for precise state tracking.
- Cron/period schedule + grace time: Define cadence with cron syntax or fixed intervals and add a grace window to avoid noisy alerts.
- Run logs: Each job keeps an event history of recent pings to audit timing and outcomes.
- Auto-provisioning: First ping can auto-create a check—useful for ephemeral jobs and dynamic environments.
- Integrations: Email, Slack, PagerDuty, WhatsApp/SMS/phone, webhooks, and even opening GitHub issues on failure.
Pros
- Cron-aware heartbeats with simple curl/wget integration
- Start/success/failure/exit-status semantics for richer signals
- Clean timelines and per-job logs for quick auditing
- Many notification channels and a self-host option
- No agents and fast time-to-value for basic cron assurance
Cons
- Not a full observability tool
- Limited advanced features
Healthchecks.io Pricing at Scale
Pricing is per account, not per GB of data. As of now: Business $20/month (100 jobs, 10 team members, 1,000 log entries/job) and Business Plus $80/month (1,000 jobs, unlimited team, 1,000 log entries/job) with included SMS/WhatsApp/phone credits; annual billing saves ~20%. A mid-sized company running, say, 300–1,000 cron jobs would typically land on Business Plus at ~$80/month—and that price is independent of how much log/trace data your jobs produce.
Tech Fit
Best for teams who want cron-native heartbeats across Linux crontab, systemd timers, Kubernetes Cron jobs, and CI runners with minimal setup and broad notifications. If your primary need is “detect missed/late runs,” Healthchecks.io shines; if you also need to correlate a failed run to traces, logs, and infra metrics at 10-TB scale, pairing or consolidating into an observability platform like CubeAPM is usually the pragmatic path.
7. Better Stack (Better Uptime)
Overview
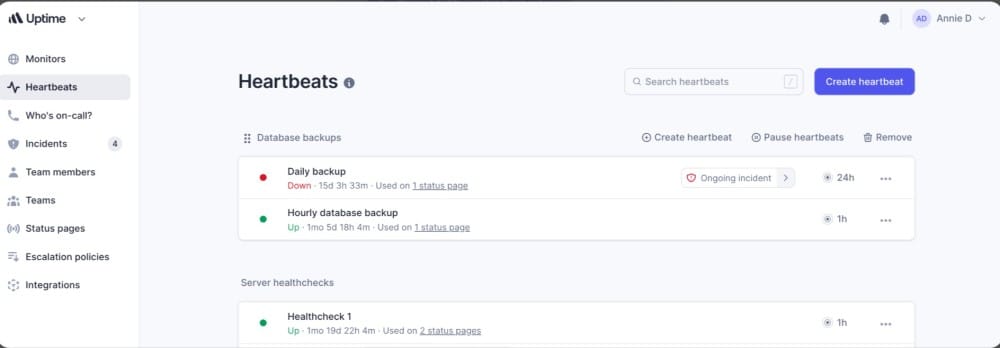
Better Stack (Better Uptime) combines cron-aware Heartbeats with on-call scheduling, incident management, and status pages. Each job gets a unique heartbeat URL; you set a cron expression or interval plus a grace period, and Better Stack alerts you if the job is late, missing, or explicitly fails. It’s positioned as a simple heartbeat solution with strong incident workflows for teams that want to connect cron failures directly to responder schedules.
Key Advantage
Cron Heartbeats are built directly into a modern incident management tool—so late or missed jobs create real incidents, not just alerts, and escalate to the right person automatically.
Key Features
- Heartbeat endpoints: Unique URLs that accept start, success, and fail signals for each job
- Cron expression & grace periods: Define flexible schedules with tolerance to avoid false positives
- Fast detection: Monitor jobs with up to 1-second check resolution
- Run history & incident creation: Store recent runs, automatically trigger incidents, and escalate to responders
- Easy rollout: No agents required; jobs call the heartbeat URL with curl or wget
Pros
- Integrated incident management and on-call escalation
- Cron-aware heartbeats with grace periods
- Free tier for small teams and side projects
- Clean, fast setup using simple HTTP pings
- Fits neatly into uptime and status workflows
Cons
- Not a full observability tool; lacks deep log/trace/infra correlation
- Pricing scales with job count and responder seats
- SaaS-only platform; no self-hosting deployment
Better Stack Pricing at Scale
Better Stack’s pricing model is per heartbeat subscription and per responder license:
- Free plan: 10 monitors & 10 heartbeats with Slack/email notifications
- Cron job monitoring plan: $17/month for additional heartbeats beyond the free tier
- Team subscription plan: $29/month base (adds advanced features like on-call scheduling, incident management, etc.)
At scale, Better Stack’s cron job monitoring stays easy to budget because pricing is based on heartbeats and responder seats, not log volume. As you add more cron jobs, costs increase gradually through additional heartbeat blocks, while incident management is priced separately per responder.
Tech Fit
Better Stack fits well for teams that primarily want heartbeat-style cron monitoring with built-in incident management and don’t mind pairing it with another platform for deep observability. If you need logs, traces, and infra metrics correlated with cron runs at scale, CubeAPM is generally a better value.
8. Sentry
Overview
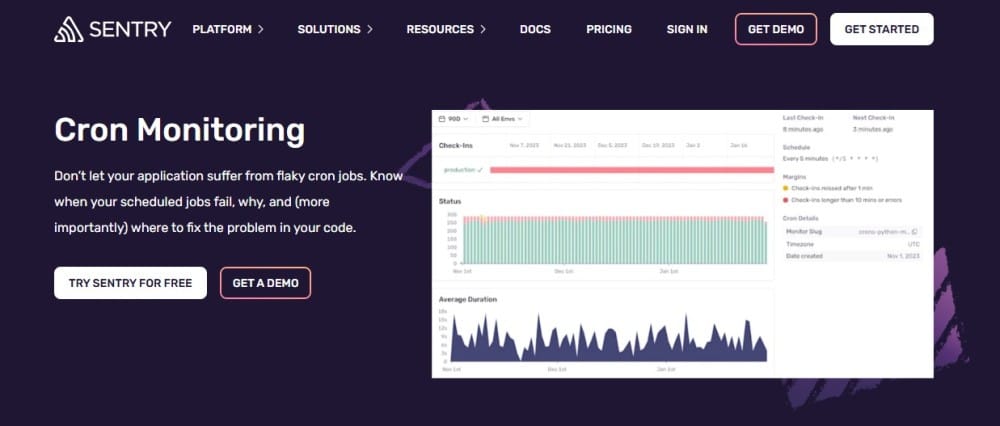
Sentry’s Cron Monitoring plugs scheduled jobs directly into the same place you track errors, logs, and traces. You define a monitor (with a cron or interval schedule), the job sends a start and finish check-in, and Sentry flags missed, failed, or timed-out runs while linking them to the exact errors and runtime context. It’s a great fit when your cron code already uses Sentry and you want job health, failure details, and code ownership in one workflow.
Key Advantage
Two-step check-ins with code-level context—Sentry tracks start/finish, marks timeouts automatically, opens issues on missed/failed runs, and ties investigations back to the precise stack traces and commits.
Key Features
- Check-ins & heartbeats: Send in-progress, ok, or error signals; timeouts are detected if a finish check-in never arrives.
- Schedule & guards: Define cron/interval schedules plus max runtime and check-in margin to catch late or long-running jobs.
- Run timeline & charts: Daily bar chart of missed/failed/successful runs and a runtime average line chart for quick drift detection.
- Multi-environment monitors: Track the same job across prod/stage/etc. with per-env status and alerts.
- SDK & API coverage: First-party SDKs (Node, Python, Go, .NET, PHP, Java, Ruby), CLI, and HTTP—plus programmatic upsert of monitors.
Pros
- Tight correlation between cron failures, error issues, logs, and traces
- Simple two-step pattern (start/finish) catches timeouts reliably
- Clean UI with run history and runtime trend charts
- Works across multiple environments with code owners and alerts
- Broad SDK coverage and ability to create/update monitors in code
Cons
- Additional monitors are billed per monitor; large job fleets add up
- Error reporting delays
Sentry Pricing at Scale
According to Sentry’s official pricing, each plan includes 1 free cron monitor, with additional monitors billed at $0.78 per monitor per month. For ~300 cron jobs would cost about $233/month in monitor fees ((299 × $0.78)). All plans also include 5 GB of logs per month, with additional logs charged at $0.50/GB.
Tech Fit
Best for teams already instrumented with Sentry who want cron runs, errors, and performance in one investigation loop. Strong coverage for Node.js, Python, Go, .NET, PHP, Java, Ruby, plus CLI/HTTP paths for any scheduler (Linux cron, systemd timers, Kubernetes Cron jobs, Celery/Sidekiq/Hangfire). If your workloads push multi-TB/month of telemetry, weigh Sentry’s per-monitor and per-GB costs against a per-GB-only model like CubeAPM.
9. Dead Man’s Snitch
Overview
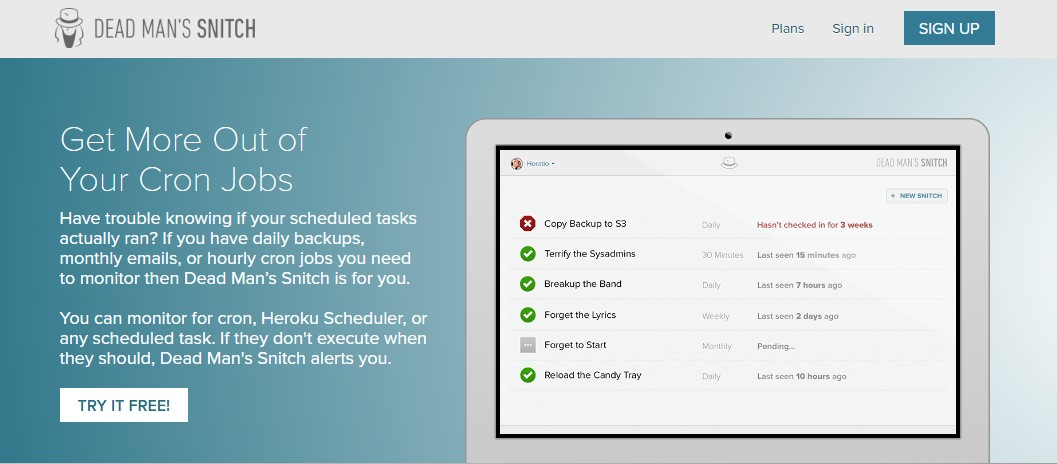
Dead Man’s Snitch (DMS) is a cron-first heartbeat service: each job gets a unique “snitch” URL that your script pings when it runs, and DMS alerts you if the run is late, missing, or fails. It’s popular with teams that want dead-simple setup, reliable “did it run?” assurance, and optional Field Agent wrapping to capture exit status, runtime, and output for faster debugging. Tight Heroku Scheduler integration keeps it a go-to in PaaS workflows as well.
Key Advantage
Heartbeat monitoring that’s extremely easy to wire up—plus Field Agent for richer per-run context (exit code, duration, output) without adding heavy observability plumbing.
Key Features
- Heartbeat check-ins: Give each job a snitch URL; ping on completion (or start/finish) so DMS can alert on missed runs.
- Field Agent wrapper: Wraps your command to send exit status, runtime, and captured output with the check-in for faster triage.
- Schedule awareness: Configure the expected cadence (hourly, daily, weekly, monthly) and get alerted when the window is missed.
- Heroku native: Official add-on and docs for wiring DMS to Heroku Scheduler tasks in seconds.
- Integrations & API: PagerDuty/Slack/Webhooks and a simple API so alerts land where your on-call lives.
Pros
- Minutes-to-value setup with curl or the Field Agent
- Reliable “did it run on time?” signal for any scheduler or language
- Optional richer context (exit code, runtime, output) without full APM
- Works great with Heroku Scheduler and traditional crontab
- Lightweight to operate with team-friendly notifications
Cons
- Not a full-stack observability suite
- Larger fleets can outgrow plan caps (snitch counts) and need higher tiers or custom options
Dead Man’s Snitch Pricing at Scale
Plans are per account and based on the number of snitches (monitors), not data volume:
- Little Birdy: $5/mo for 3 snitches (basic intervals)
- Private Eye: $19/mo for 100 snitches (enhanced intervals + integrations)
- Surveillance Van: $49/mo for 300 snitches (adds Smart Alerts & Error Notices)
For a mid-sized company with ~300 cron jobs, DMS runs ~$49/month.
If you also need deep debugging (logs/traces/metrics) at 45 TB/month, DMS doesn’t ingest or analyze that data, you’d add a separate observability/logs platform. In those high-telemetry scenarios, CubeAPM’s single price of $0.15/GB comes to ~$2,080/month for 45 TB and already includes cron monitoring alongside logs, traces, and infra, which can be more predictable and often more affordable overall than stitching DMS to a premium logs/APM stack.
Tech Fit
Ideal when you want simple, dependable heartbeats for Linux crontab, systemd timers, Heroku Scheduler, or any scheduler your scripts run under—on Linux, Windows, macOS, BSD, or Solaris via Field Agent—and you’ll keep deeper forensics in a separate tooling stack. If your team prefers one platform for cron health plus root-cause analysis at a multi-TB scale, CubeAPM will likely fit better.
How to Choose the Right Cron Job Monitoring Tools
Cron-Aware Scheduling & “Missed-Run” SLAs
Choose a tool that understands cron semantics, including DST shifts, clock drift, and SLA windows. It should alert you the moment a run is late, skipped, or duplicated instead of waiting until hours later.
Heartbeat Monitoring
Heartbeat (“check-in”) monitoring is essential for jobs that run outside your core app. The job pings the monitoring service at start/finish, and if no ping arrives within the expected window, an alert is fired. Look for configurable grace periods and a lightweight setup.
Runtime Baselines & Duration Anomalies
Modern cron monitoring should track more than success or failure. Look for runtime baselines (p95/p99), timeout alerts, and partial success detection. Capturing stdout/stderr alongside run histories helps engineers understand why a job deviated.
Kubernetes & Prometheus Support
For teams running Kubernetes Cron jobs, native visibility is critical. Proven patterns include exposing “last success” metrics and job duration counters to Prometheus, then surfacing them in SLO dashboards. Tools with k8s-native integrations simplify this setup.
OpenTelemetry-First Correlation
Enterprises are increasingly adopting OpenTelemetry so cron telemetry (job start, runtime, errors) can flow through the same pipeline as traces, logs, and metrics. While not every vendor fully supports it yet, OTel-first monitoring ensures alerts are correlated directly with job performance data, avoiding silos and vendor lock-in.
Multi-Scheduler Coverage
Most organizations use more than just crontab. Systemd timers, Jenkins jobs, Rundeck schedules, and Kubernetes Cron jobs all coexist. The right tool should treat every scheduler as a first-class source and provide consistent alerting across them.
Notification Quality & Noise Control
Alert fatigue is a common issue with cron monitoring. Look for features like “missed run by X minutes” notifications, heartbeat success checks, and runtime anomaly detection. Clean signals reduce noise while ensuring critical issues are never missed.
Cost Model You Can Forecast
Cron jobs often spike at the end of the day or the end of the month, which can drive up monitoring bills under usage-based pricing. Choose a tool with predictable pricing models (schedule-based checks or flat tiers) to avoid budget overruns during heavy job windows.
Conclusion
Choosing the right cron job monitoring tool isn’t simple. Teams often struggle with unpredictable pricing, limited integrations, or tools that only solve half the problem, alerting on missed jobs but leaving engineers blind when debugging why they failed. At scale, stitching multiple tools together quickly becomes costly and complex.
CubeAPM is the best Cron job monitoring tool provider, combining cron-aware monitoring with full observability (logs, traces, metrics, and error tracking) in one platform. With transparent pricing at $0.15/GB, no hidden infra or transfer fees, it scales seamlessly for growing teams.
If you’re looking for a cost-effective, OpenTelemetry-native solution that keeps your scheduled jobs reliable while giving you deep insights into application performance, start monitoring your cron jobs with CubeAPM today. Schedule your free demo now!
Disclaimer: The information in this article reflects the latest details available at the time of publication and may change as technologies and products evolve.
FAQs
1. What is the difference between cron job scheduling and cron job monitoring?
Cron job scheduling is about defining when a task should run using a cron expression or interval. Cron job monitoring, on the other hand, ensures that the scheduled job actually runs on time, completes successfully, and doesn’t silently fail or hang. Monitoring adds visibility, alerting, and often diagnostics.
2. Can cron job monitoring tools integrate with incident management platforms?
Yes, most modern tools provide integrations with services like Slack, PagerDuty, Opsgenie, or email alerts. This ensures that missed or failed jobs immediately trigger incidents and reach the right on-call engineers without manual checks.
3. How does CubeAPM handle cron job failures differently from simple heartbeat tools?
Unlike basic heartbeat services, CubeAPM not only detects missed or late runs but also correlates them with logs, traces, and metrics. This means you don’t just know that a job failed, you also know why it failed, with full root-cause context across your system.
4. Is it possible to monitor cron jobs across multi-cloud or hybrid environments?
Yes, many cron monitoring tools support cross-environment monitoring. With CubeAPM, for example, you can track cron jobs running on Kubernetes Cron jobs, Linux servers, or cloud schedulers; all from a single OpenTelemetry-native platform, making multi-cloud readiness much simpler.
5. How do I keep cron job monitoring costs predictable at scale?
Pricing models vary widely. Some tools charge per monitor, while others charge by data volume. CubeAPM offers a transparent model at $0.15/GB of ingested data, with no hidden infra or transfer fees. This makes it easier for mid-sized and enterprise teams to scale without surprise costs, especially when monitoring thousands of jobs with large telemetry footprints.


