Container Monitoring Tools for DevOps have become essential as the adoption of containers surges. In 2025, over 92% of IT and SaaS organizations use containers in production, and 85% rely on Kubernetes orchestration. These tools ensure performance, security, and stability in highly dynamic microservice environments.
But choosing the right Container Monitoring Tools for DevOps isn’t easy. Teams face cost overruns, hidden fees for data ingestion, and dashboards that miss critical service correlations. As of September 2025, DevOps engineers report setup complexity, poor data fidelity, and scaling challenges as major blockers.
CubeAPM is the best Container Monitoring Tools provider for DevOps, solving these pain points with OpenTelemetry-native monitoring, smart trace sampling, predictable $0.15/GB pricing, and support for self-hosted or SaaS deployments.
In this article, we’ll cover the top container monitoring tools for DevOps, their features, pricing, and best use cases.
Top 10 Container Monitoring Tools for DevOps
- CubeAPM
- Datadog
- Dynatrace
- New Relic
- Sysdig Monitor
- Sematext
- Elastic Observability
- Grafana (Cloud & OSS LGTM stack)
- SigNoz
- Splunk Observability Cloud
What is a Container Monitoring Tool for DevOps?
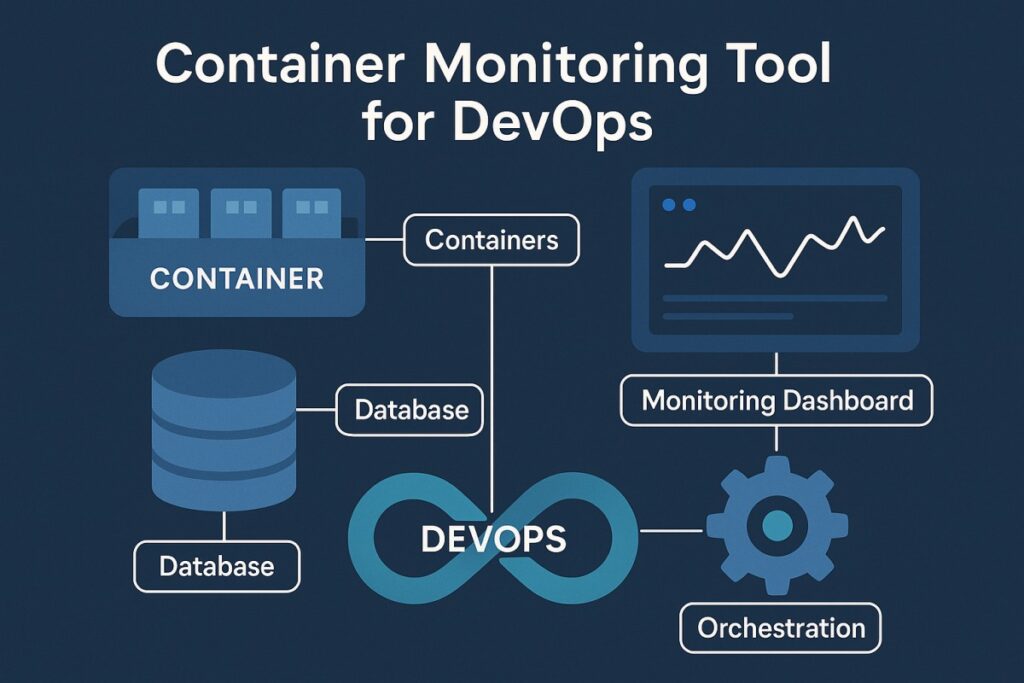
A Container Monitoring Tool for DevOps is a platform that continuously collects and correlates metrics, logs, traces, and events from containerized applications and their underlying infrastructure. These tools give teams end-to-end visibility into workloads running on Kubernetes, Docker, or cloud-native environments—helping them detect issues faster, optimize resources, and ensure reliable application performance.
For modern businesses, container monitoring is not just about spotting CPU or memory spikes. It directly impacts uptime, cost efficiency, and customer experience:
- Ensures real-time visibility into ephemeral workloads that scale up and down dynamically.
- Helps reduce MTTR (Mean Time to Resolution) by stitching together metrics, logs, and traces.
- Enables cost optimization by highlighting underutilized resources and noisy neighbors.
- Supports compliance and governance by offering deployment options like self-hosting and data localization.
- Improves user experience by tying backend container health to frontend performance through Real User Monitoring (RUM).
Example: Debugging Latency Spikes in Kubernetes with CubeAPM
Imagine a retail application running on Kubernetes where checkout requests suddenly slow down. With CubeAPM, engineers can:
- Use distributed tracing to follow the request across microservices and spot the bottleneck.
- Correlate container CPU/memory metrics with logs to confirm whether a pod was throttled or misconfigured.
- Trigger synthetic monitoring tests to simulate checkout flows and validate fixes before redeploying.
- Review real user monitoring dashboards to confirm that customer-facing latency has improved.
By combining smart sampling (retaining only meaningful traces) with flat $0.15/GB ingestion pricing, CubeAPM provides full-stack visibility while keeping costs predictable. This ensures DevOps teams can debug faster, scale confidently, and avoid the financial pitfalls of legacy monitoring vendors.
Why Teams Choose Different Container Monitoring Tools for DevOps
Cost predictability in container-heavy environments
DevOps teams frequently report exploding bills as containerized workloads generate massive telemetry streams. On Reddit’s r/devops, engineers highlight surprise costs from “high-cardinality Kubernetes metrics and traces” that balloon monthly invoices beyond projections (Reddit).
OpenTelemetry-first approach to avoid lock-in
With OpenTelemetry becoming the CNCF standard, teams prefer tools that integrate seamlessly without forcing proprietary agents. G2 reviewers note that OTel-first platforms give flexibility to “instrument once and switch vendors without rework”.
Strong correlation across logs, metrics, and traces
In containerized systems, pods may spin up and vanish within minutes, making siloed monitoring useless. Experts stress the need for unified correlation across logs, metrics, and distributed traces to accelerate root cause analysis.
Retention and storage economics
Container telemetry produces long-tail data required for debugging and compliance. DevOps discussions highlight frustration when short retention policies or costly upgrades make it hard to access historical data without breaking budgets.
Flexible deployment models: SaaS, on-prem, BYOC
Highly regulated industries need data residency and privacy compliance. G2 reviews consistently mention the importance of BYOC (Bring Your Own Cloud) or self-hosted models, which allow teams to keep data under their own control while still using a SaaS-like interface.
Noise reduction and AI-assisted triage
Dynamic container clusters create excessive alerts. Users on DevOps forums describe alert fatigue as one of their top challenges, praising platforms that apply AI-based triage and service maps to suppress noise and prioritize real incidents.
Multi-cloud and multi-cluster readiness
Enterprises increasingly run Kubernetes clusters across AWS, GCP, Azure, and hybrid on-prem setups. Analysts point out that observability tools must normalize telemetry and maintain consistent dashboards across environments to prevent blind spots (IDC report).
Usability and learning curve for platform teams
Ease of setup and intuitive dashboards are decisive. G2 reviews show that tools with steep learning curves often fail to gain adoption in busy platform teams, while auto-discovery and quick visualization of Kubernetes services win favor.
Top 10 Container Monitoring Tools for DevOps
1. CubeAPM
Overview
CubeAPM is an OpenTelemetry-native observability platform built to monitor containerized workloads across Kubernetes and cloud-native stacks. It’s known for budget-friendly ingestion pricing and deep correlation of logs, metrics, traces, and events—positioning it as a pragmatic choice for DevOps teams that need Kubernetes-aware visibility without bloat.
Key Advantage
High-signal container monitoring with smart trace retention that keeps the right data for root cause analysis while staying cost-efficient at scale.
Key Features
- Kubernetes-aware discovery & maps: Auto-detects clusters, namespaces, pods, nodes, and services; surfaces health, saturation, and dependencies in one place.
- Cron Job monitoring: Tracks Job/Pod runs, exit codes, durations, retries, and missed schedules; alerts on failed or long-running jobs.
- Correlated telemetry: Joins container metrics, K8s events, logs, and distributed traces into unified timelines for faster RCA.
- Multi-cluster views & SLOs: Normalizes labels and provides cross-cluster dashboards, alerts, and SLO tracking for hybrid/multi-cloud estates.
- Synthetics for container endpoints: Probes internal and external services behind ingress/gateways to validate uptime and latency after deploys.
Pros
- OpenTelemetry-first with quick Kubernetes onboarding
- Strong correlation across logs, metrics, traces, and events
- Works for SaaS, self-hosted, and BYOC deployments
- Transparent ingestion pricing that scales with usage
- Good multi-cluster and namespace-level governance
Cons
- May not suit teams that prefer fully vendor-hosted SaaS only
- Focused purely on observability, does not include cloud security posture management
CubeAPM Pricing at Scale
CubeAPM uses a transparent pricing model of $0.15 per GB ingested. For a mid-sized business generating 45 TB (~45,000 GB) of data per month, the monthly cost would be ~$7,200/month.
Tech Fit
Great fit for Kubernetes (GKE, EKS, AKS, on-prem), Docker/containerd/CRI-O, and service-mesh environments; supports backends and apps written in Node.js, Java, .NET, Python, Go, Ruby, and more via OpenTelemetry SDKs and the Collector.
2. Datadog
Overview
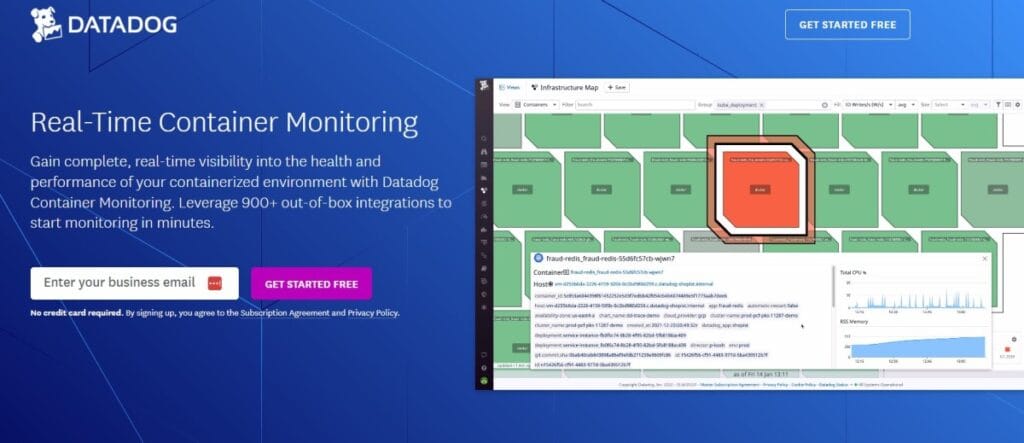
Datadog is a popular enterprise observability platform with deep Kubernetes awareness, live container visibility, and 900+ integrations—appealing to DevOps teams that want one place to correlate container metrics, logs, traces, network, and security signals across dynamic clusters.
Key Advantage
End-to-end, real-time visibility for fast triage in highly ephemeral container fleets—autodiscovery maps containers and services as they spin up, then ties metrics, logs, and traces together for investigation.
Key Features
- Live container & service autodiscovery: Detects new containers, identifies running services, and begins collecting telemetry automatically.
- Kubernetes control plane & cluster agent: Collects control-plane metrics and uses a Cluster Agent to reduce API server load while centralizing cluster-level data.
- Correlated signals for RCA: Troubleshoot faster by correlating container metrics with logs, traces, network data, and events in one view.
- Container scope & discovery management: Limit agent discovery to specific containers/namespaces to control data and cost.
- Serverless containers & cloud runtimes: Out-of-the-box dashboards for Fargate and Cloud Run with per-container resource and error metrics.
Pros
- Mature Kubernetes integration and container maps for pods, nodes, and namespaces
- Strong correlation across metrics, logs, traces, and network for containerized microservices
- 900+ integrations and rich dashboards accelerate onboarding for complex estates
- Autodiscovery reduces manual config drift in fast-churning clusters
- Cluster Agent and control-plane coverage help at the multi-cluster scale
Cons
- Costs can rise with container counts, log indexing volume, and APM hosts as you scale
- SaaS-only; no self-hosting
Datadog Pricing at Scale
Datadog charges differently for different capabilities. APM starts at $31/month; infra starts at $15/month; logs start at $0.10/GB, and so on. For a mid-sized business ingesting around 45 TB (~45,000 GB) of data per month, the cost would come around $27,475/month.
Tech Fit
Broad language support (Java, .NET, Node.js, Python, Go, Ruby, PHP) and strong coverage for Kubernetes (EKS/AKS/GKE), containerd/Docker, and serverless containers like AWS Fargate and Google Cloud Run—useful for hybrid and multi-cloud DevOps teams.
3. Dynatrace
Overview
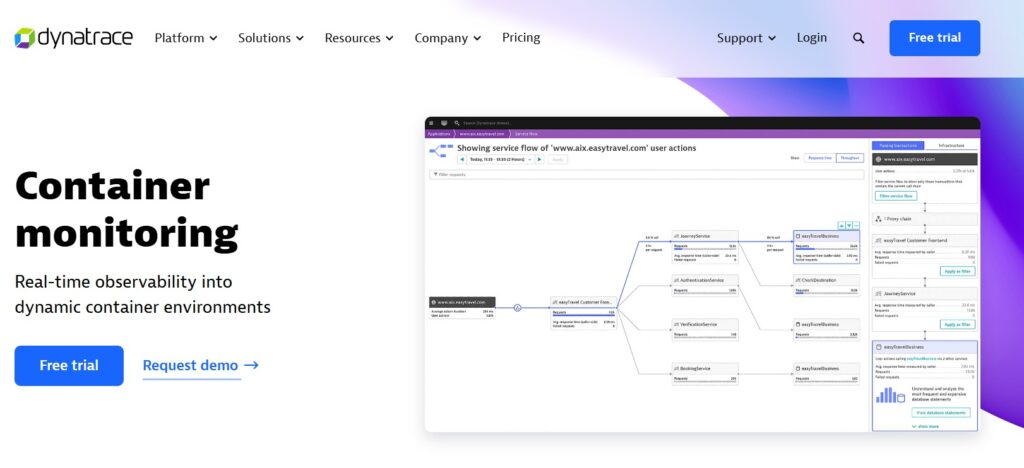
Dynatrace is a full-stack observability platform with strong container and Kubernetes awareness. It’s OneAgent auto-discovers pods, containers, and services, then maps dependencies in real time with Smartscape and investigates issues using Davis AI—appealing to DevOps teams that want precise answers across multi-cluster, multi-cloud estates.
Key Advantage
Automatic discovery and causal AI that turns noisy container telemetry into actionable root-cause insights across clusters and services.
Key Features
- Kubernetes platform monitoring: Per-pod visibility, cluster health, and control-plane insights designed for dynamic K8s fleets.
- OneAgent auto-instrumentation: A Single agent discovers technologies in containers without image changes, capturing metrics, logs, and traces.
- Smartscape dependency mapping: Real-time topology of services, processes, hosts, and containers for fast blast-radius analysis.
- Davis AI for RCA: Causal analysis that correlates events, traces, and metrics to explain incidents and recommend fixes.
- Grail-powered data: Unified storage/analytics for logs, traces, metrics with query and retention controls.
Pros
- Deep Kubernetes and container visibility out of the box
- Clear service and dependency context via Smartscape
- Causal AI that accelerates triage and reduces false positives
- Single-agent approach simplifies deployment across mixed stacks
- Robust multi-cloud support and enterprise features
Cons
- Pricing units (GiB-hour, pod-hour, container-hour, GiB ingest) can be complex and high at scale
- Learning curve
Dynatrace Pricing at Scale
- Full stack: $0.01/8 GiB hour/month or $58/month/8GiB host
- Log Ingest & process: $0.20 per GiB
For a similar 45 TB (~45,000 GB/month) volume, the cost would be $21,850/month.
Tech Fit
Well-suited to Kubernetes (EKS, AKS, GKE, OpenShift), containerd/Docker, and polyglot microservices. Strong for Java, .NET, Node.js, Go, Python, and more—especially where teams want automated discovery, topology context, and AI-assisted RCA across clusters.
4. New Relic
Overview
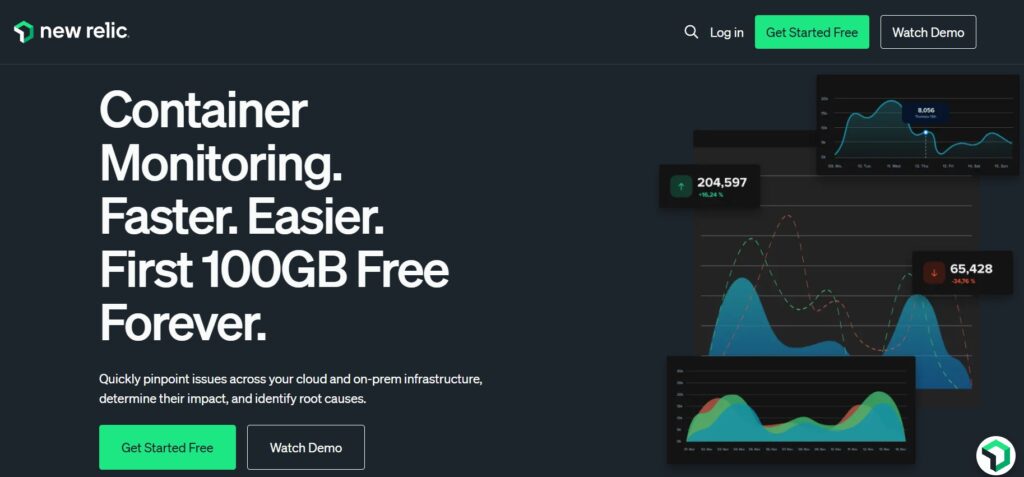
New Relic is a well-known observability platform with strong Kubernetes awareness—cluster explorer views, workload health, and log/trace correlation—used by DevOps teams to monitor containerized services across EKS/AKS/GKE and hybrid environments. It pairs a broad feature set (infra + APM + logs + synthetics) with usage-based pricing and a sizable quickstart ecosystem for container stacks.
Key Advantage
Kubernetes cluster explorer with end-to-end correlation—jump from a noisy pod or node to the exact service, log line, and trace span for faster RCA.
Key Features
- Kubernetes cluster explorer: Multi-dimensional views of nodes, pods, namespaces, and workloads, with metrics, events, logs, and traces in context.
- Container log routing & parsing: Guides to correctly tag, route, and parse Docker/container logs so they attach to the right container entities.
- Health checks & service checks: Best-practice guidance for liveness/readiness probes and container service checks to keep workloads healthy.
- Quickstarts for cloud containers: Installable dashboards/integrations for Azure Containers and other runtimes to accelerate onboarding.
- Kubernetes troubleshooting content: Deep dives on monitoring K8s and debugging common container/pod/node errors.
Pros
- Mature Kubernetes views with cluster explorer and workload context
- Solid correlation across metrics, logs, and traces for containerized microservices
- Helpful operational content and how-tos for K8s logging, probes, and debugging
- Quickstarts to jump-start monitoring on major container platforms
- Broad language support and integrations for heterogeneous fleets
Cons
- Usage-based data pricing, plus paid users, can raise TCO at high container scale
- SaaS-based; no self-hosting
New Relic Pricing at Scale
New Relic’s billing is based on data ingested, user licenses, and optional add-ons. The free tier offers 100 GB of ingest per month, then it costs $0.40 per GB after that. For a business ingesting 45 TB of logs per month, the cost would come around $25,990/month.
Tech Fit
Strong for Kubernetes on EKS/AKS/GKE and container runtimes (Docker, containerd), plus serverless containers (e.g., Azure Containers). Broad language coverage, including Java, .NET, Node.js, Python, Go, Ruby, PHP, and more—suited to polyglot microservices and platform engineering teams.
5. Sysdig Monitor
Overview
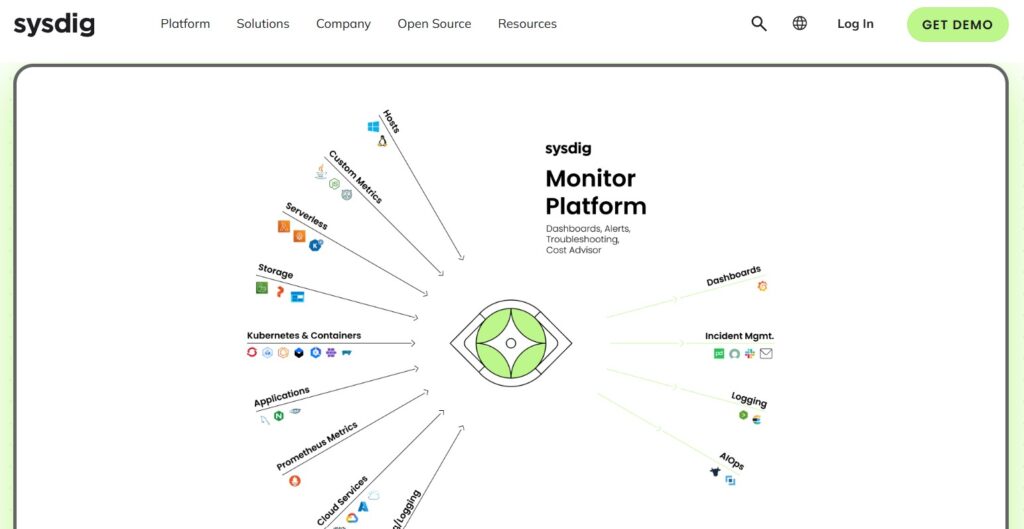
Sysdig Monitor is a container-first monitoring solution built with a strong Kubernetes focus. It combines managed Prometheus, deep visibility into clusters, and cost optimization insights—giving DevOps teams the ability to monitor, troubleshoot, and optimize workloads at scale without running their own Prometheus infrastructure.
Key Advantage
Managed Prometheus with Kubernetes-aware intelligence, so DevOps teams can use familiar PromQL queries while gaining enterprise-grade dashboards, governance, and cost analysis.
Key Features
- Kubernetes & container monitoring: Full-stack visibility across nodes, pods, namespaces, and workloads with health and performance metrics.
- Managed Prometheus & PromQL: Retains the open-source semantics while offloading storage and scaling challenges.
- Service auto-discovery: Automatically detects new workloads and dependencies, keeping monitoring aligned with fast-moving clusters.
- Cost Advisor & efficiency metrics: Identifies over-provisioned resources, right-sizing opportunities, and wasted spend in Kubernetes environments.
- Custom metrics management: Controls for time-series growth and guardrails against metric cardinality issues.
Pros
- Purpose-built for Kubernetes and containerized workloads
- Native Prometheus compatibility for easy adoption
- Built-in cost insights and right-sizing recommendations
- Automated service discovery reduces manual setup
- Guardrails for managing custom metrics at scale
Cons
- Pricing is quote-based and tied to host count and time-series usage, not a simple per-GB model
- Difficult to set up
Sysdig Monitor Pricing at Scale
For Sysdig Monitor, there is no publicly listed flat per-GB price on the official website. Pricing is provided via custom quote and scales based on the number of hosts and the volume of metrics/time-series used, rather than data ingestion size. As a result, there is no official cost figure to calculate for 10 TB or 45 TB at scale. Large Kubernetes or Prometheus deployments can therefore see widely varying costs depending on node count and custom metrics usage, not raw data volume.
Tech Fit
Sysdig Monitor is best for Kubernetes-native DevOps teams who are already comfortable with Prometheus and PromQL but want a managed, scalable solution. It integrates well with EKS, AKS, GKE, and on-prem Kubernetes, and supports polyglot microservices in languages like Java, Go, .NET, Node.js, and Python.
6. Sematext
Overview
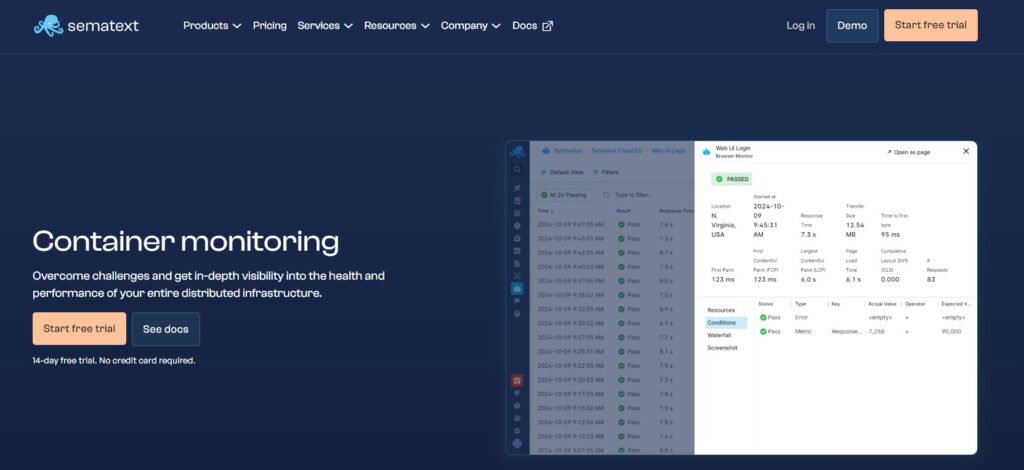
Sematext is a SaaS observability platform with strong Kubernetes/container coverage. A lightweight agent discovers clusters, nodes, pods, and services, collects metrics and logs, and ships them to prebuilt dashboards and alerts—useful for DevOps teams that want managed Prometheus-style monitoring without running their own storage.
Key Advantage
Kubernetes-ready monitoring with flexible, app-scoped pricing controls for logs and metrics, so teams can dial cost vs. visibility per environment.
Key Features
- Kubernetes maps & discovery: Auto-detects clusters, namespaces, nodes, and pods, and surfaces health and performance in curated dashboards.
- Container & node metrics: Collects CPU, memory, file system, network, and control-plane metrics with pod/label context for fast triage.
- Log shipping & parsing: Ships container logs with metadata and parsing rules so log streams correlate cleanly with Kubernetes entities.
- Alerting & SLO workflows: Out-of-the-box thresholds and anomaly alerts for pods/nodes, plus SLO-oriented views teams can tailor.
- Process and service views: Real-time process insights and service-level breakdowns to spot hot spots before they cascade.
Pros
- Purpose-built for Kubernetes and containers
- Lightweight agent with quick onboarding
- App-scoped plans help control log and metric spend
- PromQL-friendly workflows for teams used to Prometheus
- Helpful defaults for dashboards and alerting
Cons
- Pricing spans separate products (Monitoring vs Logs), so totals require careful planning
- Occasional downtimes
Sematext Pricing at Scale
For Sematext as a container monitoring tool, pricing at scale is primarily driven by data ingestion and retention, not by container or cluster count. The official pricing lists logs at $0.10 per GB ingested, with storage billed separately based on the selected retention period, while infrastructure monitoring is charged per host. As containerized environments grow and emit more telemetry, costs scale linearly with log volume and retention. This makes Sematext predictable, but increasingly expensive for high-throughput container workloads.
Tech Fit
Best for DevOps teams standardizing on Kubernetes across EKS/AKS/GKE or on-prem, who want a managed collection with PromQL-friendly workflows. Works well for polyglot microservices—Java, Go, .NET, Node.js, Python—where you emit container metrics and ship logs with Kubernetes labels for clean correlation.
7. Elastic Observability
Overview
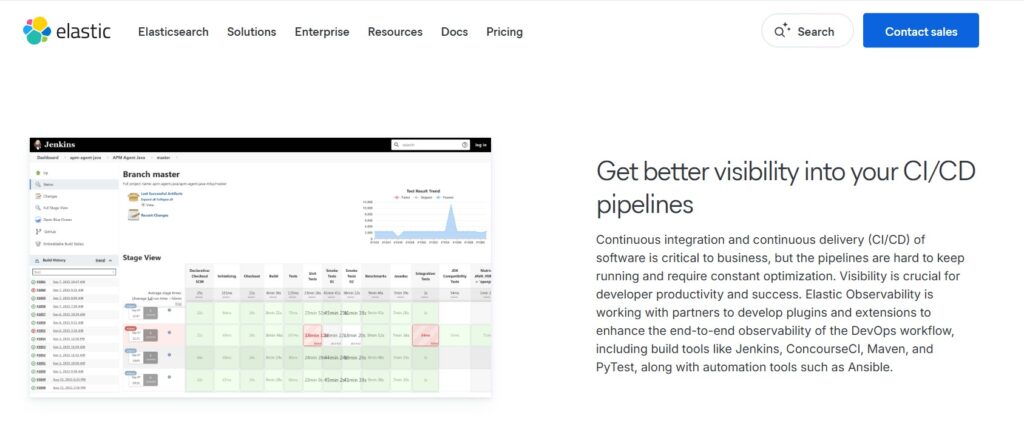
Elastic Observability extends the ELK experience to containerized and cloud-native environments by unifying logs, metrics, and traces. With Kubernetes-native integrations, curated dashboards, and the option to run as Elastic Cloud, self-managed, or as a Serverless project, it helps DevOps teams manage high-volume telemetry while leveraging Elastic’s powerful search and analytics.
Key Advantage
Search-first troubleshooting at scale—engineers can seamlessly pivot between container logs, metrics, and traces to uncover root causes faster.
Key Features
- Kubernetes integration: Collects metrics from clusters, nodes, pods, and workloads with labels and contextual insights.
- APM for microservices: Captures distributed traces across containerized services and ties them to logs and metrics.
- Infrastructure monitoring: Prebuilt dashboards for container runtimes, orchestrators, and system resources.
- Log pipelines & parsing: Flexible log routing, enrichment, and parsing to handle high-cardinality Kubernetes workloads.
- SLOs, ML & anomaly detection: Built-in SLO monitoring, anomaly detection, and AIOps features for faster triage.
Pros
- Strong log analytics and search workflows for container troubleshooting
- Mature dashboards for infrastructure, APM, and logs
- Flexible deployment: serverless, hosted cloud, or self-managed
- Large ecosystem of integrations and ingest pipelines
- Supports advanced use cases with ML and anomaly detection
Cons
- Pricing can be complex across ingest, retention, and egress
- Complex to set up
- Costly premium support (5-15% of billing)
Elastic Observability Pricing at Scale
Elastic’s Serverless Observability pricing starts around $0.15/GB for ingest and $0.02/GB/month for retention. Egress beyond the free tier is $0.05/GB, premium support is an additional 5-15% of monthly spend, and synthetic monitoring is billed separately at $0.10 per 10,000 test runs. Mid-sized scenario (45 TB/month ingest), estimated total: ≈ $17,435/month.
Tech Fit
Elastic Observability is well-suited for Kubernetes on EKS/AKS/GKE and containerd/Docker estates where log analytics and query power are priorities. It supports major languages—Java, .NET, Node.js, Python, Go, Ruby, and PHP—and is a natural fit for teams familiar with ELK who want container observability in the same ecosystem.
8. Grafana (Cloud & OSS LGTM stack)
Overview
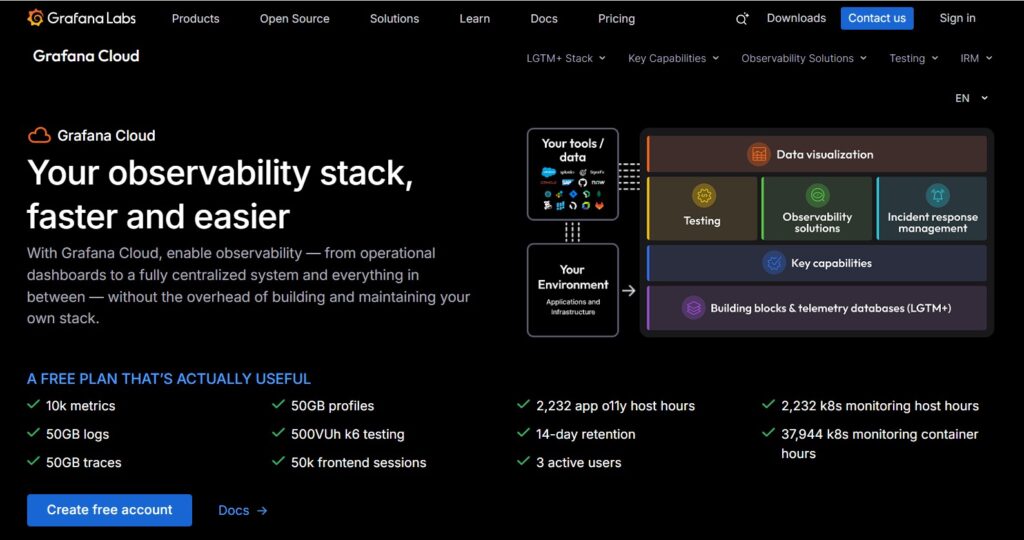
Grafana brings together the LGTM stack—Loki for logs, Grafana for visualization, Tempo for traces, and Mimir for metrics—into a Kubernetes-friendly observability platform. With curated dashboards, service discovery, and strong open-source roots, it’s a go-to choice for DevOps teams who want flexibility between OSS self-hosting and Grafana Cloud.
Key Advantage
Modular, open observability stack with Kubernetes-native views that lets teams correlate logs, metrics, and traces seamlessly while retaining control over how they deploy.
Key Features
- Kubernetes monitoring dashboards: Out-of-the-box cluster, node, and pod views with drilldowns into workloads and namespaces.
- Loki for container logs: Label-rich log ingestion with Kubernetes metadata and live tailing to speed up debugging.
- Tempo traces correlation: Link spans to related logs and metrics to move from a failed request to the exact pod and log line.
- Mimir for metrics: Scalable Prometheus-compatible metrics storage with long-term retention options.
- Continuous profiling and k6: Spot performance bottlenecks at the code level and run synthetic tests against containerized endpoints.
Pros
- Strong Kubernetes support with prebuilt dashboards
- Fully open-source stack with PromQL, Tempo, Loki, and Mimir
- Flexible deployment—self-hosted or managed Grafana Cloud
- Powerful correlations across logs, metrics, traces, and profiles
- Large community and plugin ecosystem
Cons
- Pricing split across logs, traces, and metrics makes budget planning difficult
- Learning curve
Grafana Cloud Pricing at Scale
Grafana Cloud pricing is transparent and usage-based (Pro plan adds a $19/month platform fee). Key list prices: Metrics at $6.50 per 1k active series, Logs/Traces/Profiles at $0.50 per GB ingested; Kubernetes Monitoring beyond the included free usage is $0.015 per host hour and $0.001 per container hour. The free tier includes helpful allowances (e.g., 10k series, 50 GB logs/traces/profiles, 2,232 host hours, 37,944 container hours).
For the mid-sized scenario of 45 TB data ingestion, teams may have to pay $11,875/month.
Tech Fit
Grafana is a strong fit for Kubernetes environments (EKS, AKS, GKE, on-prem) and teams already using Prometheus and PromQL. It supports polyglot microservices—Java, Go, Node.js, .NET, Python, Ruby—and gives platform engineers the choice between full OSS flexibility and managed Grafana Cloud.
9. SigNoz
Overview
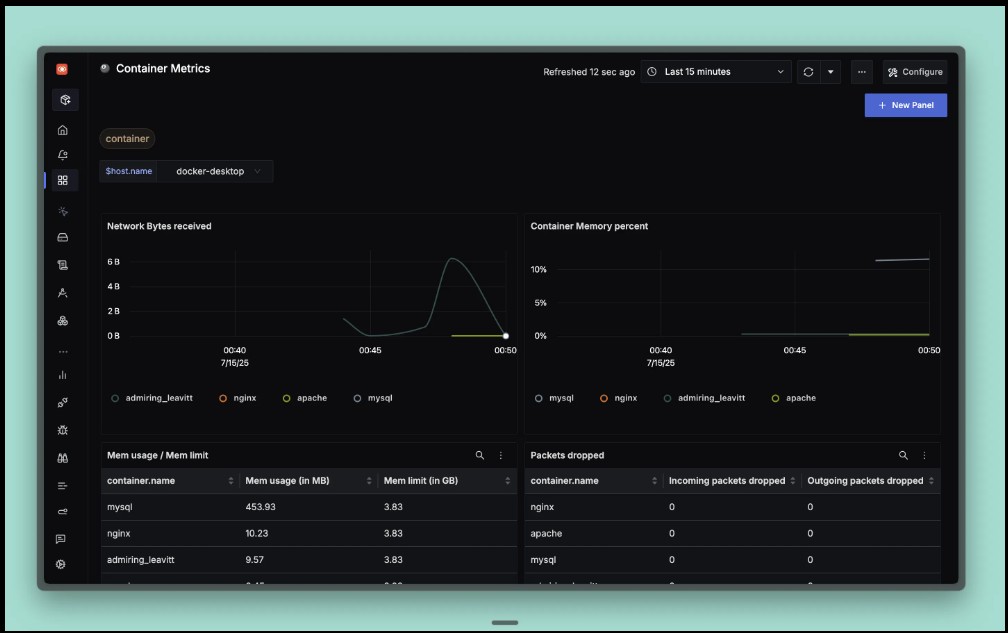
SigNoz is an OpenTelemetry-native observability platform that covers logs, metrics, and traces with Kubernetes-ready dashboards. Teams can run it as SigNoz Cloud or self-host the open-source edition, making it attractive to DevOps groups that want container monitoring with OTel pipelines and cost controls.
Key Advantage
OpenTelemetry-first collection for containers—instrument once, route data reliably, and use ready-made Kubernetes and Docker dashboards to accelerate troubleshooting.
Key Features
- Kubernetes dashboards: Cluster, node, pod, and workload views with labels and health context for fast container triage.
- Docker container metrics: Templates for CPU, memory, network, and disk I/O to spot hot pods and right-size resources.
- OTel collector patterns: Guides for deploying collectors and auto-instrumentation to standardize container telemetry.
- Correlated signals: Pivot from a slow span to the exact pod and log line, tying traces to logs and infra metrics.
- Alerting & SLOs: Threshold and anomaly alerts with service-level views that teams can tailor to containerized apps.
Pros
- OpenTelemetry-native and Kubernetes-aware out of the box
- Option to self-host or use managed SigNoz Cloud
- Helpful container and Kubernetes dashboard templates
- Straightforward per-unit pricing for logs, traces, and metrics on Cloud
- Good fit when you want OSS flexibility with a managed option
Cons
- Separate prices for logs, traces, and metric samples make budget planning difficult
- Fewer integrations
SigNoz Pricing at Scale
SigNoz Cloud bills logs/traces as per usage; around $0.30 per GB for ingested traces/logs, and $0.10/GB for metrics, plus you may wish to pay extra for add-ons. Using our 45 TB scenario, the cost could be $16,000/month.
Tech Fit
Great for Kubernetes on EKS/AKS/GKE and Docker/containerd estates using OpenTelemetry. Works well across polyglot stacks—Java, Go, .NET, Node.js, Python, Ruby, PHP—and for platform teams that want OSS flexibility with a managed cloud option.
10. Splunk Observability Cloud
Overview
Splunk Observability Cloud combines infrastructure monitoring, APM, RUM, and synthetics into one platform with Kubernetes awareness and full-fidelity (NoSample) tracing. It’s designed for large-scale containerized environments, helping DevOps teams monitor clusters, pods, services, and dependencies in real time while tying together metrics, logs, and traces.
Key Advantage
Full-fidelity tracing with real-time service maps that let DevOps teams uncover dependencies, blast radius, and root causes without sampling gaps.
Key Features
- Kubernetes & container monitoring: Auto-discovery of clusters, pods, and workloads with health and performance insights.
- Service maps & golden signals: Visualize dependencies and track latency, error rates, and saturation across services.
- OpenTelemetry-native ingestion: Standardized data collection without vendor lock-in.
- AI-assisted troubleshooting: Anomaly detection and guided root cause analysis reduce mean time to resolution.
- Comprehensive DevOps workflows: Integrates APM, RUM, and synthetics with container-level telemetry.
Pros
- Full-fidelity tracing ensures no missing spans
- Strong Kubernetes context across infra and services
- OpenTelemetry support makes instrumentation portable
- Covers infra, APM, logs, and synthetics in one platform
- Scales well for large multi-cluster, multi-cloud setups
Cons
- Costs rise quickly with heavy telemetry or high container counts
- Complex setup
Splunk Observability Pricing at Scale
Splunk prices its Observability Cloud primarily by host per month, with separate charges for log and trace ingestion when volumes exceed plan entitlements.
- Infrastructure only: from $15/host/month
- App & Infra: from $60/host/month
- End-to-End Observability: from $75/host/month
Example (mid-sized company, 45 TB/month and 125 hosts):
- Host licensing (End-to-End): 125 × $75 = $9,375/month
- Logs and traces: 45 TB/month is billed separately under Splunk’s ingest model, which can push costs several thousand dollars higher depending on retention and indexing.
Tech Fit
Splunk Observability Cloud suits enterprises running Kubernetes on EKS, AKS, or GKE with polyglot services—Java, Go, Node.js, .NET, Python, Ruby—and needing enterprise-grade breadth (infra + APM + RUM + synthetics). It’s best for teams with larger budgets who value full-fidelity tracing and enterprise support.
How to choose the right Container Monitoring Tools for DevOps
Pricing you can forecast under the container scale
Containerized workloads generate high-cardinality telemetry, often leading to unpredictable invoices. Enterprises need monitoring tools with transparent, usage-aware pricing models so Kubernetes clusters can scale without financial surprises.
OpenTelemetry-first to stay portable
OpenTelemetry has become the universal standard for container observability, letting teams instrument once and route data anywhere. This avoids vendor lock-in, reduces agent overhead, and ensures long-term flexibility across platforms.
Correlation that accelerates RCA
Logs, metrics, and traces in silos slow down resolution during outages. Tools that correlate these signals into unified timelines reduce MTTR, enabling engineers to pinpoint issues across ephemeral pods and microservices.
Multi-cluster and multi-cloud consistency
Many enterprises run Kubernetes across multiple regions or clouds, which adds complexity in standardizing monitoring. The right tool should unify telemetry, SLOs, and dashboards across all environments for consistent visibility.
Data retention and cost governance
Industries often demand long-term data for audits or regressions, but storage costs can escalate. Effective tools balance hot vs. cold retention and provide FinOps-style governance to align telemetry spend with business priorities.
Deployment model that fits data governance
Highly regulated industries can’t always use SaaS vendors. Tools offering on-prem or BYOC deployment options give enterprises control over data while still enabling modern container observability.
Noise reduction and usability for teams
Dynamic clusters generate floods of transient alerts, creating fatigue for engineers. Platforms that combine AI-driven noise suppression with intuitive Kubernetes dashboards improve adoption and keep alerts actionable.
Controls for label cardinality and metric hygiene
Kubernetes metrics can explode when unbounded labels are introduced. Platforms with cardinality controls and hygiene features keep monitoring pipelines efficient, prevent query slowdowns, and contain costs at scale.
Conclusion
Choosing the right Container Monitoring Tools for DevOps is rarely simple. Teams struggle with unpredictable costs, complex pricing tiers, and platforms that demand constant tuning to keep up with high-volume container workloads.
CubeAPM solves these challenges with a simple $0.15/GB pricing model, Kubernetes-native dashboards, and full OpenTelemetry support. It brings together logs, metrics, and traces in one place without extra infrastructure or hidden fees, making it easier to manage containers at scale.
If your DevOps team is looking for reliable, affordable, and future-ready container monitoring, CubeAPM is the best choice. Book a free demo with CubeAPM today.
Disclaimer: The information in this article reflects the latest details available at the time of publication and may change as technologies and products evolve.
FAQs
1. What is the difference between container monitoring and traditional infrastructure monitoring?
Traditional infrastructure monitoring focuses on servers, VMs, and networks, while container monitoring captures short-lived, dynamic workloads within Kubernetes or Docker. It tracks pods, nodes, namespaces, and microservices interactions, which traditional tools often miss.
2. How do Container Monitoring Tools for DevOps integrate with CI/CD pipelines?
Most modern tools expose APIs and integrations with CI/CD systems, enabling automated alerts during deployments. They can verify container health after rollouts and roll back if performance issues are detected.
3. Why is pricing transparency important in Container Monitoring Tools for DevOps?
DevOps teams often ingest terabytes of telemetry data. Without transparent pricing, costs can spiral due to hidden fees for hosts, metrics, or data transfer. CubeAPM solves this with a clear $0.15/GB model, making cost forecasting straightforward.
4. Can Container Monitoring Tools for DevOps support compliance needs?
Yes, but coverage varies. Some tools lack fine-grained controls for data residency or retention. CubeAPM offers BYOC/on-prem deployments, making it a safer choice for regulated industries.
5. What should teams prioritize when evaluating Container Monitoring Tools for DevOps?
Focus on OpenTelemetry support, Kubernetes-native dashboards, scalability, and integration with your DevOps toolchain. Tools like CubeAPM that combine affordability with deep OTel support and Kubernetes-first features help ensure both technical and financial fit.


