Atatus is a full-stack observability solution known for its simplicity and developer-first focus, making it especially appealing for startups, agile teams, and engineering teams in SMBs.
However, Atatus is primarily SaaS-based and can only be self-hosted through the Enterprise plan. With the SaaS platform, your data goes through their servers, which may not be ideal for compliance-heavy industries and may also incur egress charges. In addition, the pricing is different for logs, infra, APM, RUM, synthetics, and even analytics, increasing the overall cost.
For teams looking for a simplified, cost-efficient observability solution with self-hosting, CubeAPM is the best Atatus alternative. The platform is also full-stack and comes with smart, context-based sampling, intelligent alerting, and unlimited data retention, among others. Let’s discuss the top Atatus alternatives based on various parameters.
Top 7 Alternatives to Atatus
- CubeAPM
- Datadog
- Dynatrace
- New Relic
- Splunk Appdynamics
- Honeycomb
- Grafana
Why People Are Looking for Atatus Alternatives
High Pricing
Atatus advertises simple pricing – $0.07/Host hour per month for APM, $0.021/Host hour per month, and $2/GB for log ingestion. But as data volumes increase, this host-hour-based pricing escalates high. Real users on G2 have also expressed their concerns regarding the high cost of Atatus.
No Self-Hosting
Atatus remains a SaaS-only platform, offering no self-hosted or VPC deployments. So, the data goes through their servers. For organizations with strict compliance requirements, such as those in finance, healthcare, or regions with data localisation laws, this limitation can be a big concern.
Criteria for Selecting Atatus Alternatives
1. Full Signal Coverage
Look for tools that offer comprehensive MELT support—Metrics, Events, Logs, Traces, along with RUM and synthetics. Platforms that centralize these signals reduce context switching and accelerate incident resolution through unified root cause analysis.
2. OpenTelemetry (OTEL) Native Support
Native OTEL compatibility ensures vendor-agnostic instrumentation and future-proof observability. It allows seamless integration across distributed environments without being locked into a single SDK or data format.
3. Smart Sampling & Ingestion Controls
Platforms with tail-based sampling or policy-driven data retention help teams retain important telemetry while controlling ingestion volumes. This directly translates into better cost efficiency and focused debugging.
4. Transparent & Scalable Pricing
Avoid per-host or per-feature pricing that escalates linearly. Prefer usage-based models (e.g., per ingested GB) with clear breakdowns, alerting thresholds, and budget controls to prevent surprise bills at scale.
5. Deployment Flexibility (SaaS & Self-Hosting)
Choose tools that support both cloud-hosted and on-premise deployment options. This ensures compliance with data residency requirements and gives organizations more control over performance, security, and cost.
6. Enterprise Readiness
Look for features like RBAC, SSO/SAML, audit logs, compliance certifications (SOC2, HIPAA), and team-level isolation. These are essential for larger organizations with formal security and operational requirements.
7. Ease of Instrumentation & Setup
Modern platforms should offer agent-based auto-instrumentation, fast setup guides, SDK support, and minimal overhead to get started. Tools that simplify onboarding reduce developer friction and increase adoption.
8. Support Quality & Ecosystem Maturity
Reliable vendor support (email, chat, Slack) and an active integration ecosystem (Terraform, CI/CD tools, cloud platforms) are crucial. Evaluate both response time and community resources when comparing alternatives.
Atatus Overview
Known for
Atatus is primarily known as a lightweight, full-stack observability platform that caters to small and mid-sized engineering teams. It offers Application Performance Monitoring (APM), Real User Monitoring (RUM), logs, uptime checks, infrastructure monitoring, and API analytics in a unified dashboard designed for simplicity and speed.
Standout Features
- Real User Monitoring (RUM): Tracks user journeys in real time, capturing frontend performance metrics like Time to Interactive (TTI), First Contentful Paint (FCP), and user geography.
- Error Tracking: Detects and reports errors in JavaScript and backend code with contextual details such as stack trace, user agent, and impacted sessions.
- Uptime Monitoring: Provides HTTP status checks and alerting with configurable regions and frequency.
- Multi-channel Alerting: Supports alerts via Slack, PagerDuty, Opsgenie, email, and webhook integrations for fast incident routing.
Key Features
- APM Tracing: Monitors backend performance with service-level traces and latency breakdowns.
- Log Management: Centralized logging with filtering, search, and retention options, though with limited cross-signal correlation.
- Infrastructure Monitoring: Provides CPU, memory, and disk metrics from connected hosts and containers.
- Custom Dashboards: Allows teams to visualize data from various signals using drag-and-drop widgets.
- Synthetics and API Monitoring: Simulates transactions and monitors the availability of key endpoints.
- JavaScript SDKs: Offers SDKs for JavaScript, Node.js, and frontend frameworks for quick instrumentation.
Pros
- Simple to set up with clear UI/UX, especially for developers new to observability.
- Full-stack coverage in a single, affordable platform for small teams.
- Offers multiple SDKs for backend and frontend instrumentation.
- Integrates with tools like Slack, Opsgenie, and Webhooks out of the box.
- Offers a freemium plan with limited features, making it attractive for startups.
Cons
- Pricing escalates quickly due to per-host billing and high log ingestion rates ($2/GB)
- No self-hosting
Best for
Atatus is ideal for small startups, developer-led teams, and SMBs looking for an affordable entry point into observability. It suits applications with lower telemetry volumes and minimal compliance or enterprise-grade requirements.
Pricing & Customer Reviews
- APM: $0.07 per host-hour per month,
- RUM: $1.96 per 10K views/month
- Logs: $2/GB/month
- Infra: $0.021
- Synthetics: $1.5/10k checks/month
- Analytics: $1/10k events/month
- G2 Rating: 4.5/5
- Praised for: Ease of use, responsive support, and quick setup.
- Criticised for: high costs at scale, no self-hosting
Top 7 Atatus Alternatives
1. CubeAPM

Known for
CubeAPM is a next-generation observability platform purpose-built for high-resolution telemetry collection, data cost control, and OpenTelemetry-native operations. It enables full-stack observability across traces, metrics, logs, RUM, synthetics, and errors while giving teams granular control over data ingestion, retention, and hosting.
Standout Features
- Smart Sampling Engine: Intelligently retains error-heavy, latency-prone spans while discarding noise, reducing ingest volumes without compromising trace depth.
- One-Hour Deployment: Plug-and-play compatibility with Datadog, Prometheus, and OTEL agents allows teams to get production visibility in under 60 minutes.
- Direct Slack Support: Engineers get real-time help from the core team with sub-5-minute TAT, eliminating ticket queues and email delays.
- Drop-in Agent Compatibility: Smooth migration from other APM vendors through native compatibility with existing agents like Datadog, New Relic, and Prometheus.
Key Features
- Full MELT Observability: Tracks metrics, events, logs, traces, synthetics, and RUM on a unified platform with seamless signal correlation.
- OpenTelemetry-First Architecture: Built ground-up with OTEL, allowing vendor-neutral instrumentation and complete control over data flow.
- Self-Hosted & SaaS Flexibility: Offers both cloud-hosted and VPC/on-prem deployments to meet regulatory compliance needs such as GDPR, HIPAA, and RBI.
- Real-Time Alerts & Dashboards: Custom dashboards and anomaly-based alerting pipelines with Slack/webhook integrations out of the box.
- Transparent Pricing Model: $0.15/GB of data ingested, with no per-user fees.
- Enterprise-Grade Security: Includes SSO, role-based access control, and audit trails suitable for compliance-heavy industries.
Pros
- 800+ integration support
- Zero cloud egress charges
- Native support for OTEL and Prometheus out of the box
- Real-time trace sampling and cost optimization features
- Unified full-stack observability with prebuilt dashboards
- Slack-based support with sub-5-min turnaround
- On-premise deployment available for data sovereignty
- Ingestion-based pricing with no per-seat fees
Cons:
- Not ideal for teams looking for off-prem solutions
- Strictly an observability platform with no support for cloud security management
Best for
CubeAPM is perfect for teams that want fine-grained control over observability costs and deployment. It’s ideal for mid-to-large-scale DevOps teams, regulated industries, and businesses seeking OpenTelemetry-first architectures with compliance readiness and full MELT visibility.
Pricing & Customer Reviews
- Ingestion: $0.15/GB; infrastructure monitoring, synthetics, and error tracking are included at no extra cost.
- G2 Score: 4.7/5
- Praised for: Rapid time to value, transparent pricing, blazing-fast Slack-based support
CubeAPM vs Atatus
Atatus offers a streamlined observability solution for small teams, but it becomes costly at scale. Atatus also offers only SaaS deployment with no on-premise hosting, which is a big concern for companies with strict data residency or compliance needs. In contrast, CubeAPM delivers full support for self-hosted deployments and is cost-effective with a simple $0.15/GB of ingested data without any retention or egress charges.
2. Datadog
Known for
Datadog is a comprehensive SaaS-based observability and security platform tailored for modern, distributed cloud environments. Its strength lies in combining monitoring, logging, tracing, RUM, and runtime security into a single pane of glass, backed by hundreds of integrations across cloud providers, container platforms, and third-party services.
Standout Features
- Extensive Integration Ecosystem: Over 900 native integrations, including Kubernetes, AWS, Azure, MongoDB, Jenkins, Kafka, and more, making it easy to plug into most tech stacks without custom work.
- Interactive Notebooks for RCA: Teams can investigate incidents collaboratively by combining live telemetry, annotations, and visualizations in a shared, commentable workspace.
- Unified DevSecOps View: Datadog bridges security and observability with built-in modules for cloud security posture management (CSPM), threat detection, and runtime container protection.
- Frontend Session Replay + RUM: Enables teams to replay real-user journeys while correlating frontend performance issues with backend bottlenecks.
- Deep Serverless Observability: Granular insights into AWS Lambda, Azure Functions, and Fargate workloads with cold-start metrics, invocation traces, and payload metadata.
Key Features
- All-in-One MELT Platform: Provides monitoring for metrics, events, logs, traces, synthetics, and user behavior with centralized dashboards and alerting.
- Auto-Instrumentation Across Languages: Supports out-of-the-box instrumentation for Java, Python, Go, Node.js, .NET, PHP, and others with minimal code changes.
- Cloud-Native Monitoring: Includes first-party integrations with Kubernetes, ECS, Azure Monitor, GCP Stackdriver, and more.
- Built-in Security Telemetry: Tracks vulnerabilities, audit logs, configuration drifts, and runtime threats from infrastructure to applications.
- CI/CD Pipeline Insights: Correlates telemetry with deployments and build artifacts to detect regressions introduced during software releases.
- Live Dashboards with Data Correlation: Customizable dashboards that support real-time queries, thresholds, alerts, and context-aware overlays.
Pros
- Market-leading breadth of integrations across infrastructure and application layers
- Combines observability with security analytics in a single platform
- Deep visibility into containerized and serverless workloads
- Supports complex dashboards and advanced alert logic for large teams
- Ideal for hybrid cloud and microservices-heavy deployments
Cons
- Expensive for small teams
- SaaS-only architecture; no self-hosting
Best for
Datadog is a strong fit for mature DevOps and platform engineering teams operating in fast-moving cloud-native environments. Enterprises running Kubernetes, serverless workloads, or multi-cloud apps benefit from its broad integrations, real-time dashboards, and built-in security telemetry—all in a unified observability stack.
Pricing & Customer Reviews
- Infrastructure Monitoring: $15/host/month
- APM: $31/host/month annually
- Logs: $0.10/GB + $1.70/M events for 15-day retention
- Serverless: $10 per million invocations
- RUM/Synthetics and Security add-on pricing varies
- G2 Rating: 4.4/5 (based on 630+ reviews)
- Praised for: Ecosystem depth, customizable dashboards, powerful integrations
- Criticized for: High costs, lack of self-hosted options
Datadog vs Atatus
While both platforms provide full-stack observability, Datadog far surpasses Atatus in terms of depth, integrations, and security capabilities. It offers advanced DevSecOps tooling, deeper serverless visibility, and richer correlation views for distributed environments. However, Atatus remains easier to adopt.
3. Dynatrace
Known for
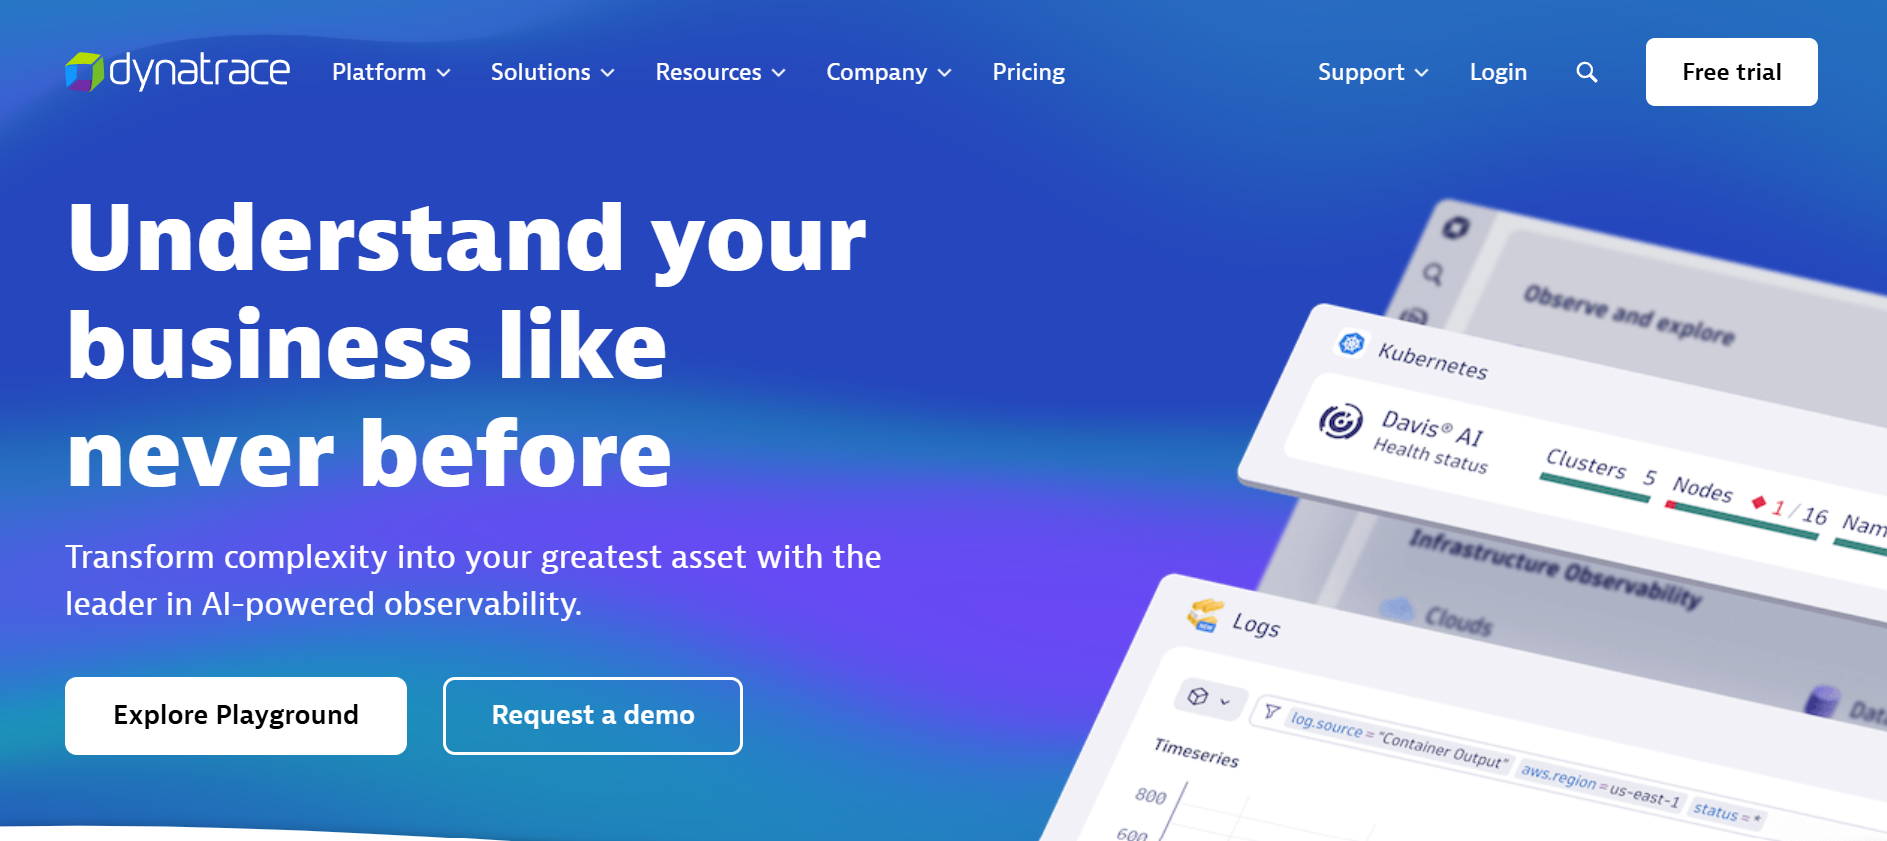
Dynatrace is an enterprise-grade observability platform built to automate everything from service discovery to root cause analysis and application threat detection. It’s engineered for high-scale, hybrid-cloud environments where uptime, speed, and intelligent correlation matter most. Powered by its proprietary Davis AI engine, Dynatrace eliminates manual triage by detecting anomalies and mapping dependencies in real time.
Standout Features
- Smartscape Topology Mapping: Dynamically maps every service, host, container, and process into a live dependency graph, enabling AI to understand the system’s behavioral baseline
- Davis AI-Powered RCA: Uses machine learning to correlate telemetry data across layers—MELT, user sessions, and deployments—surfacing root causes instead of noisy symptoms.
- Unified Observability + Application Security: Combines APM and security by monitoring code-level vulnerabilities and runtime threats without requiring extra agents.
- Synthetics + RUM Correlation: Offers both synthetic transaction testing and real user behavior tracking, linked directly to backend performance data for end-to-end visibility.
Key Features
- All-in-One MELT Visibility: Covers metrics, logs, events, traces, synthetics, and user behavior in one integrated interface.
- Autonomous Instrumentation: Automatically detects services, VMs, APIs, containers, and dependencies—ideal for large-scale or dynamic infrastructure.
- AI-Curated Alerts & Anomalies: Reduces alert fatigue through real-time anomaly detection based on causal impact rather than simple thresholds.
- Deep Code-Level Tracing: Follows transactions through services, down to methods and classes, aiding performance optimization and regression detection.
- Cloud & Kubernetes Native: Out-of-the-box support for AWS, Azure, GCP, OpenShift, Kubernetes, and hybrid environments.
- Embedded Application Security: Monitors running applications using Runtime Application Self-Protection (RASP) for real-time security insights.
Pros
- AI-driven root cause analysis with high accuracy and minimal manual tuning
- Real-time Smartscape mapping of dependencies from infrastructure to frontend
- Automatic instrumentation saves setup time across services and containers
- Includes application security insights directly within the observability workflow
- Scales efficiently across large hybrid or multi-cloud environments
Cons
- Expensive
- Steep learning curve
Best for
Dynatrace is purpose-built for large enterprises operating mission-critical infrastructure that spans legacy, cloud-native, and containerized environments. Its AI-driven automation and full-stack visibility make it especially valuable for teams managing hundreds of services where speed, accuracy, and minimal manual effort are key to performance and security.
Pricing & Customer Reviews
- Full-Stack Monitoring: $0.08 per 8 GiB host/hour
- RUM: $0.00225 per session
- Synthetics: $0.001 per HTTP check
- App Security: $0.018/hour per host
- Kubernetes: $0.002/hour per pod
- G2 Rating: 4.5/5 (from over 1,300 reviews)
- Praised for: Powerful AI features, automated discovery, and full-stack correlation
- Criticized for: High pricing, steep learning curve
Dynatrace vs Atatus
While Atatus offers straightforward observability for logs, traces, and RUM, Dynatrace’s strength lies in its AI-powered RCA, autonomous service mapping, and integrated security. That said, Dynatrace’s pricing and learning curve may deter smaller teams.
4. New Relic
Known for
New Relic is a cloud-native observability platform built for developers and SREs who demand fine-grained control over telemetry analysis and dashboard customizations. It offers full-stack monitoring and deep querying capabilities through its proprietary telemetry query language, delivering rich insights across applications, infrastructure, and user behavior in real time.
Standout Features
- Explorer View for Dependency Mapping: Offers an interactive, service-oriented view of your system, visualizing services, containers, and hosts with their health states and dependencies.
- NRQL for Precision Queries: Allows power users to craft advanced telemetry queries across logs, traces, and metrics using New Relic Query Language (NRQL), unlocking deep custom insights.
- Lookout for Smart Anomaly Detection: Uses statistical models to automatically surface spikes, regressions, or anomalous patterns in telemetry with reduced noise.
- Highly Configurable Dashboards: Lets teams build role-based views, custom layouts, and real-time visualizations tailored to different stakeholders and workflows.
Key Features
- End-to-End MELT Coverage: Monitors metrics, events, logs, traces, synthetics, and RUM in a unified experience, enabling full-scope observability.
- Language-Agnostic Auto-Instrumentation: Supports out-of-the-box agent-based instrumentation for Java, Python, Go, .NET, Node.js, and more.
- Cloud-Native Integration Suite: Offers plug-and-play compatibility with AWS, Azure, GCP, Kubernetes, and serverless platforms.
- Simulated and Real User Monitoring: Provides active checks for site availability and real user session insights, including page load, interaction delay, and browser metrics.
- Machine Learning-Based Alerts: Detects anomalies using historical baselines and predictive models to cut through alert fatigue.
- CI/CD Observability Hooks: Connects telemetry data to your software delivery lifecycle, enabling faster rollback and release insights.
Pros
- Powerful querying with NRQL enables deep, real-time analysis across all telemetry types
- Rich dashboarding experience with customizable layouts and widgets
- Unified observability stack with seamless coverage of logs, RUM, synthetics, and traces
- Fast onboarding and agent deployment across languages and platforms
- Prebuilt dashboards for Kubernetes, Lambda, and CI/CD systems streamline early usage
Cons
- No on-prem or bring-your-own-cloud deployment
- Pricing includes ingest, user licenses, and retention, making the platform expensive
Best for
New Relic is best suited for observability-savvy DevOps and engineering teams operating in multi-cloud or Kubernetes environments. It’s ideal for teams that want complete flexibility in how they query, visualize, and correlate telemetry data—especially those focused on detailed release monitoring, incident forensics, and dashboard-driven workflows.
Pricing & Customer Reviews
- Free tier: 100 GB/month with 1 user
- Data Ingest: $0.40/GB depending on retention tier
- Core User License: $49/user/month
- Full Platform Access: $349/user/month
- G2 Rating: 4.4/5 (500+ reviews)
- Praised for: Dashboard flexibility, NRQL-powered analytics, and intuitive SaaS interface
- Criticized for: Complex pricing, lack of self-hosting
New Relic vs Atatus
Atatus is simpler to adopt and has a more predictable pricing model at a small scale, but lacks the depth, extensibility, and dashboarding customization that New Relic delivers. With NRQL, users can extract nuanced telemetry insights to enable comprehensive observability.
5. Splunk AppDynamics
Known for
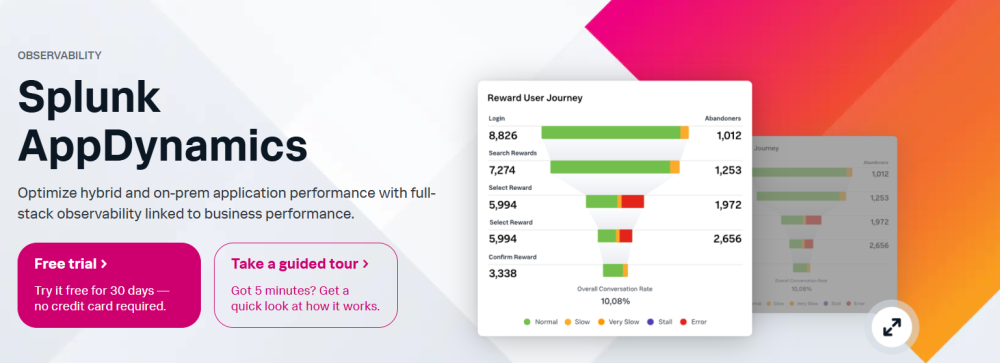
Splunk AppDynamics, now part of Cisco’s observability stack, specializes in performance monitoring at the transaction level, enabling real-time diagnostics of business-critical applications. It’s particularly favored by enterprises that operate complex monolithic and distributed systems and need full-stack visibility tied to user journeys and SLAs.
Standout Features
- Transaction-Level Tracing: Tracks user flows through backend services, external APIs, and databases, allowing teams to isolate the exact layer or function causing slowdowns in critical paths.
- Live Service Topology Maps: Dynamically visualizes how application components interact in production, highlighting real-time dependencies, latencies, and failure points.
- Code-Level Debugging: Allows developers to drill into method-level execution and analyze latency or memory issues in Java, .NET, PHP, and other supported languages.
- Dynamic Baselining for Anomaly Detection: Automatically generates performance baselines and flags deviations without manual threshold tuning, helping reduce noise and false positives.
Key Features
- End-to-End APM Instrumentation: Agent-based support for Java, .NET, Node.js, Python, and PHP enables precise tracking of services and transactions.
- Business Transaction Tagging: Maps telemetry to specific business workflows, enabling SLA and revenue-impact monitoring.
- Full-Stack RUM & Synthetics: Combines frontend experience monitoring with synthetic availability testing to offer holistic visibility.
- Hybrid Deployment Support: Monitors apps running on cloud, on-premise, and mixed infrastructure with equal depth.
- Runtime Security Visibility: Integrates with Cisco Secure Application to detect vulnerabilities and application-layer threats during runtime.
- CI/CD Monitoring Hooks: Tracks build and deployment events in the context of telemetry, aiding rollback decisions and release validation.
- Auto-Discovery for Dynamic Environments: Identifies new services, traffic flows, and dependencies automatically in changing environments.
Pros
- Powerful business transaction mapping for SLA-based performance management
- Deep application diagnostics with code-level visibility
- Robust hybrid and legacy infrastructure monitoring
- Seamless integration into Cisco’s security and observability stack
- Baseline-driven alerting reduces configuration overhead and alert fatigue
Cons
- Costly as data volumes grow
- Inefficient alerts
- Slow update cycle
Best for
Splunk AppDynamics is ideal for large enterprises operating under strict SLAs and needing deep application intelligence across hybrid or on-prem environments. Its ability to tie performance metrics directly to business workflows makes it a top choice for teams focused on revenue-impacting services.
Pricing & Customer Reviews
- Infrastructure Monitoring: $6/vCPU/month
- Premium Edition (Infra + APM): $33/vCPU/month
- Enterprise Edition: $50/vCPU/month with business telemetry features
- RUM: From $0.06 per 1,000 tokens
- Synthetics: Starting at $12/location/month
- G2 Rating: 4.3/5 (375+ reviews)
- Praised for: Business transaction visibility, hybrid deployment support, and deep diagnostics
- Criticized for: High pricing, slower updates
Splunk AppDynamics vs Atatus
While Atatus provides decent frontend and backend monitoring for smaller teams, AppDynamics offers extensive transaction-first observability with code-level traceability and hybrid deployment support.
6. Honeycomb
Known for
Honeycomb is a high-cardinality observability platform built for modern engineering teams that need fast, query-driven debugging and trace-level insight into complex distributed systems. It excels in exploratory observability, where developers investigate unknown unknowns—especially in environments like microservices, Kubernetes, and event-driven architectures.
Standout Features
- BubbleUp for Root Cause Isolation: This signature tool highlights anomalies by automatically surfacing the dimensions that deviate from normal behavior, making it easier to investigate outliers in traces or logs.
- Columnar Query Engine: Built for speed and flexibility, Honeycomb’s query engine allows slicing and dicing millions of spans across high-cardinality fields with sub-second latency.
- Service Map Autogeneration: Visualizes dependencies across services based on trace data, helping teams understand how services interact in production.
- Tail-Based Sampling for Precision: Captures only the most useful traces after they complete, ensuring rare issues (e.g., high-latency or failed requests) are retained without overwhelming storage.
Key Features
- Native OpenTelemetry Integration: Built from the ground up to support OTEL pipelines, ensuring easy ingestion and vendor-agnostic instrumentation.
- Event-Based Observability: Focuses on spans and events over time, making it ideal for detailed behavioral analysis across distributed services.
- Trace Explorer: Enables engineers to filter and pivot trace datasets across fields like latency, HTTP status, user ID, or feature flag, without needing predefined dashboards.
- High-Cardinality Data Handling: Optimized to work with millions of unique field combinations, making it ideal for real-time debugging across dynamic services.
- Query History & Collaboration: Teams can revisit, clone, and share complex queries to enable collective debugging and knowledge reuse.
- SaaS Deployment with Team Workflows: Includes team-focused views and access control, with preconfigured dashboards and workspace segmentation.
Pros
- Excellent for debugging unpredictable or emergent issues in distributed systems
- BubbleUp and columnar queries enable fast outlier analysis
- Tail-based sampling preserves the most relevant traces efficiently
- OTEL-native by default, enabling modern instrumentation pipelines
- No rigid dashboards—users can flexibly query any field at any time
Cons
- Expensive, especially for smaller teams
- Less control over quota management
Best for
Honeycomb is best suited for developer and SRE teams working on highly distributed systems like microservices or event-driven architectures. It’s ideal for organizations that value trace-based debugging, flexible data slicing, and high-cardinality analysis over conventional metrics dashboards.
Pricing & Customer Reviews
- Free plan: includes 20M events/month
- Paid plans: $130/month for 100M events
- G2 Rating: 4.6/5
- Praised for: Exploratory debugging, trace-level analytics, and OTEL-native workflows
- Criticized for: high pricing, no self-hosting
Honeycomb vs Atatus
While Atatus offers a structured observability stack with predefined dashboards and UI-based alerts, Honeycomb takes a developer-first approach focused on exploration and discovery. Atatus suits teams looking for quick dashboards, but Honeycomb offers more powerful trace querying, anomaly surfacing, or tail-based sampling.
7. Grafana

Known for
Grafana is a versatile, open-source observability platform favored for its real-time dashboards, strong community backing, and support for open standards. It’s widely adopted by DevOps teams building modular observability stacks around Prometheus, Loki, and Tempo, making it a go-to for infrastructure-centric use cases and teams prioritizing vendor neutrality.
Standout Features
- Native OTEL with Flexible Dashboards: Grafana supports OpenTelemetry through Prometheus and Tempo while offering powerful dashboarding tools with dynamic variables, templating, and query language support like PromQL and SQL.
- Loki & Tempo Log + Trace Stack: Grafana’s native log (Loki) and trace (Tempo) tools integrate directly with its dashboards, delivering end-to-end visibility across MEL. These components offer lightweight, scalable ingestion without proprietary vendor lock-in.
- OSS or Cloud Flexibility: Teams can choose to self-host Grafana for full control or use Grafana Cloud to simplify operations with managed services for Prometheus, Loki, and Tempo.
- Grafana Alerting & OnCall: Unified alerting across all data sources with routing, deduplication, and incident escalation workflows. Grafana OnCall adds built-in support for SRE practices and on-call rotations.
Key Features
- Time-Series Visualizations: Supports heatmaps, graphs, annotations, and real-time dashboards using metrics from diverse sources like Prometheus, InfluxDB, and Elasticsearch.
- Open-Standard MEL Stack: Integrates with Prometheus for metrics, Loki for logs, and Tempo for traces—enabling vendor-neutral observability pipelines.
- Deployment Flexibility: Offers open-source, enterprise self-hosted, and managed cloud versions to meet compliance and infrastructure constraints.
- Plugin Ecosystem & Prebuilt Dashboards: Hundreds of plugins and community-built dashboards for AWS, Kubernetes, MySQL, Kafka, Redis, and more.
- Role-Based Access Control (RBAC): Granular user permissions, dashboard folders, and sharing capabilities enable secure collaboration at scale.
- Alert Management & Routing: Visual alert rule builder, alert silencing, escalation chains, and integrations with PagerDuty, Slack, and others.
Pros
- Free and open-source version ideal for teams with internal expertise
- Native support for open standards, including Prometheus, OTEL, Loki, and Tempo
- Wide range of visualization and customization options
- Offers both SaaS and self-hosting for compliance and data control
- Mature plugin ecosystem with strong community support
Cons
- Complex setup
- Quality support in paid plans
Best for
Grafana is ideal for DevOps, SRE, and platform teams who want to build a customizable observability stack using open-source tools. It’s best suited for organizations that value deployment flexibility, low-cost telemetry management, and OTEL-native integration—especially those who already use Prometheus, Loki, or Kubernetes in production.
Pricing & Customer Reviews
- Grafana OSS: Free
- Grafana Cloud Free Tier: Includes 10K metrics series, 50GB logs/month
- Pro Plans: Start at $19/month
- Enterprise: Custom pricing with advanced features and support
- G2 Rating: 4.5/5 (130+ reviews)
- Praised for: Dashboarding flexibility, cost transparency, and open-source architecture
- Criticized for: Complex setup
Grafana vs Atatus
Atatus delivers an integrated, SaaS-based experience for teams looking for a quick observability setup with low friction. Grafana allows teams to craft more tailored observability pipelines with Prometheus, Loki, and Tempo, supporting custom deployments and cost optimization.
Conclusion: Choosing the Right Atatus Alternative
While Atatus offers a clean and developer-friendly introduction to observability, it can be costly as data volumes grow. Plus, there’s no self-hosting option, which can be a concern for compliance-focused industries.
If you’re looking for a full self-hosting platform with cost-effectiveness, CubeAPM is a great option. This full-stack observability platform offers smart sampling to reduce costs, blazing-fast dashboards, intuitive setup, unlimited data retention, and no egress charges. Book a free demo with CubeAPM today.
Disclaimer: The information in this article reflects the latest details available at the time of publication and may change as technologies and products evolve.
FAQs
1. What are the best alternatives to Atatus for full-stack observability?
Top alternatives to Atatus include CubeAPM, Datadog, Dynatrace, New Relic, Splunk AppDynamics, Honeycomb, and Grafana. These platforms offer broader signal coverage (MELT), OpenTelemetry support, smarter sampling strategies, and more scalable pricing models, making them suitable for modern cloud-native and enterprise workloads.
2. Why do teams switch from Atatus to other observability platforms?
Teams often outgrow Atatus due to its lack of self-hosting options and high pricing that escalates quickly with scale. As observability needs mature, organizations seek alternatives with better cost control, deeper visibility, and deployment flexibility.
3. Is CubeAPM a better alternative to Atatus?
Yes. CubeAPM is widely regarded as a superior Atatus alternative—offering full MELT support (metrics, events, logs, traces), smart sampling to reduce ingest costs, self-hosting for compliance, and a unified OTEL-native pipeline. It’s ideal for teams looking to scale observability with transparent pricing and high-resolution telemetry.
4. Which Atatus alternative offers the best pricing model?
CubeAPM stands out with its $0.15/GB ingestion model, zero per-user fees, and included infrastructure/RUM/synthetics support. Compared to Atatus’s host-hour billing and separate charges for logs and frontend views, CubeAPM enables predictable, usage-based pricing without hidden costs.
5. Can CubeAPM be used instead of managing open-source observability stacks?
Absolutely. CubeAPM delivers the power of an OpenTelemetry-native, full-stack observability system—without the operational overhead of managing open-source tools. It gives you complete visibility across logs, traces, metrics, and more, with minimal setup, built-in dashboards, and enterprise-grade support, making it a production-ready alternative to DIY observability.


