Aspecto, founded in 2019, is a modern developer-friendly observability platform focused on OpenTelemetry-based distributed tracing, service dependency mapping, and real-time debugging. SmartBear acquired it in 2023 and folded its tech into BugSnag, which became Insight Hub, adding error monitoring, RUM, backend performance, and distributed tracing.
Although powerful, BugSnag comes with certain downsides, such as limited on-premise deployment. The platform is primarily SaaS-based, and only the Enterprise tier has on-premise deployment. Also, the pricing looks affordable at first glance, but it’s tied to the number of monthly error events and spans, which can escalate with increasing needs.
CubeAPM is the best Aspecto alternative as it offers cost-efficient observability with simple, ingestion-based pricing of $0.15/GB. It also offers full self-hosting deployment in your cloud or on-premise infrastructure. The platform provides full MELT coverage, native OpenTelemetry ingestion, smart sampling for cost optimization, and high-quality support.
In this article, we’ll explore the top BugSnag or Aspecto alternatives based on features, pricing, user feedback, and more.
Top 7 Aspecto/BugSnag Alternatives
- CubeAPM
- Datadog
- Dynatrace
- New Relic
- Grafana
- Honeycomb
- IBM Instana
Why Are People Looking for Aspecto Alternatives?
Pricing Complexity
Since Aspecto’s acquisition, its original pricing (usage-based) is no longer available on the website. BugSnag’s pricing is available and is based on monthly events for error monitoring and spans, and not per GB of data ingested. Beyond the free tier, the pricing starts with $20/month for 50k monthly events and 1M monthly spans. Many users may exceed this, which will add to their cost.
Limited Deployment Options
BugSnag is primarily a SaaS-based solution, and on-prem hosting is only available in its Enterprise plan. Organizations operating under regulated industries, such as finance, healthcare, and government, must validate this carefully if they choose a SaaS-based plan in order to meet compliance requirements.
Criteria for Selecting Aspecto Alternatives
Native OpenTelemetry (OTEL) support
An ideal alternative should fully support OTEL ingestion, processing, and querying without forcing proprietary agents or formats. This ensures vendor neutrality, easier migration, and the ability to reuse existing instrumentation. Platforms with OTEL-native pipelines also integrate more seamlessly with modern microservices architectures.
Full MELT coverage
Look for a platform that delivers the complete MELT stack—metrics, events, logs, and traces—in a unified interface. This reduces tool sprawl, streamlines troubleshooting, and enables cross-signal correlation (e.g., linking a spike in latency with a specific infrastructure event and error trace).
Flexible deployment options
Compliance-heavy industries require deployment models beyond SaaS, including private cloud, self-hosted, or fully air-gapped setups. A strong alternative should provide multiple hosting options with documented data residency controls and the ability to meet HIPAA, GDPR, and industry-specific regulations.
Transparent and predictable pricing
Alternatives should publish clear cost structures—such as $/GB ingestion or per-host rates—along with retention tiers and add-on costs for modules like synthetics or RUM. Transparent pricing allows teams to model 6–12 months of usage and prevents unexpected overages.
Advanced sampling strategies
Efficient cost control depends on sampling that retains high-value traces—such as those linked to anomalies, latency spikes, or error patterns—while discarding redundant data. Look for tail-based or context-aware sampling capabilities, ideally with policies that can be tuned per service or environment.
Integration ecosystem
An alternative should offer compatibility with widely used tools like Prometheus, Grafana, major cloud providers, CI/CD pipelines, and incident management systems. This reduces friction during migration and ensures observability data flows into existing workflows.
Performance and scalability
Low-latency ingestion and querying are critical for real-time troubleshooting. The platform should handle large telemetry volumes (e.g., 10 TB/month or more) without performance degradation, while maintaining high availability across regions.
Support quality and roadmap visibility
Reliable support channels (chat, ticket, Slack) with documented SLAs are essential. Roadmap transparency ensures customers know how the product will evolve and whether it aligns with their long-term observability strategy.
Aspecto/BugSnag Overview
Known for
BugSnag (formerly Aspecto) is known as SmartBear’s unified observability and application stability platform. It combines error monitoring, real user monitoring (RUM), backend performance insights, and distributed tracing into a single interface, aimed at helping engineering teams identify, prioritize, and resolve production issues quickly.
Standout Features
- Error Stability Scoring: Tracks application health over time by calculating stability scores for each release.
- Integrated Distributed Tracing: Incorporates Aspecto’s OTEL-based tracing to connect backend transactions with frontend error data.
- Real User Monitoring (RUM): Monitors user sessions for errors, performance metrics, and stability impact.
- Release & Version Tracking: Links stability metrics and errors directly to specific releases for faster rollback or remediation.
- Cross-Platform Support: Works with web, mobile, and backend applications, supporting multiple frameworks and languages.
Key Features
- Error Monitoring & Alerting: Captures unhandled exceptions, performance issues, and error trends with real-time notifications.
- RUM & Session Insights: Tracks page load time, navigation timing, and error impact on user experience.
- Distributed Tracing Support: Integrates tracing data to connect application errors with related backend spans.
- Version & Deployment Insights: Monitors stability scores and errors per release to assess the impact of new deployments.
- Collaboration Tools: Integrates with Slack, Jira, GitHub, and other developer tools for incident workflow automation.
- API & SDK Availability: Offers language-specific SDKs for fast integration and customization.
Pros
- Unified interface for error monitoring, RUM, and tracing.
- Clear release-based stability tracking.
- Strong integration ecosystem with developer workflow tools.
- Supports multiple platforms and frameworks.
- Real-time alerts for high-priority production issues.
Cons
- Primarily SaaS; on-premises deployments limited to enterprise contracts
- Pricing is complex for high-ingestion workloads
Best for
Engineering teams that prioritize error tracking, real user monitoring, and basic distributed tracing in one platform, particularly those already using SmartBear products. Well-suited for web, mobile, and backend applications that need stability scoring and release insights, but less ideal for organizations seeking full-stack MELT observability in a single tool.
BugSnag Pricing & Customer Reviews
- Free: 1 user, 7.5k events, 1M spans/month
- Select: $20/month, unlimited users
- Preferred: $33/month, unlimited users
- Enterprise: Custom pricing with on-premises and advanced features
- G2 rating: 4.3/5 (32 reviews)
- Praised for: real-time error detection, robust filtering and tracking, and helpful error dashboards.
- Criticised for: limited MELT coverage, opaque pricing for high-volume tracing
Top 7 Aspecto Alternatives
1. CubeAPM

Known for
CubeAPM is recognized as an OpenTelemetry-native observability platform built for complete MELT (Metrics, Events, Logs, Traces) visibility, cost efficiency, and flexible deployment. It excels at enabling teams to retain valuable telemetry without ballooning storage costs, thanks to advanced smart sampling.
Standout Features
- Context-Aware Smart Sampling: Dynamically retains traces based on anomalies like high latency, error spikes, or abnormal span durations—cutting data volume by up to 80% while preserving investigative depth.
- Broad Agent Compatibility: Natively integrates with agents from Datadog, New Relic, Prometheus, and Elastic, streamlining migration without re-instrumentation.
- Rapid Deployment: Operational in under an hour with no complex SDK setup or manual code changes.
- Direct-to-Engineer Support: Offers Slack or WhatsApp access to core engineers with response times often under five minutes, minimizing MTTR.
Key Features
- Unified MELT Stack: End-to-end observability from a single interface, covering logs, metrics, traces, RUM, synthetics, and error tracking.
- Native OTEL Support: Full OTLP ingestion for all telemetry signals, ensuring interoperability and avoiding vendor lock-in.
- Transparent Usage-Based Pricing: Single $/GB rate with no per-host or per-user fees, plus built-in cost controls.
- Flexible Deployment Models: Supports SaaS, on-premises, and air-gapped hosting with compliance readiness for HIPAA, GDPR, and other regulations.
- Ready-to-Use Dashboards: Auto-generated visualizations for Kubernetes, infrastructure, databases, and application performance.
- Enterprise-Grade Security: Features SSO, RBAC, tenant isolation, and detailed audit trails for secure collaboration.
Pros
- 800+ integrations and strong ecosystem compatibility
- No egress fees or hidden charges
- Fully OTEL-compliant with zero vendor lock-in
- Predictable costs with ingestion-based pricing
- Exceptionally fast and accessible technical support
- Advanced sampling keeps costs low without losing critical data
- Meets stringent regulatory compliance requirements
Cons
- Not designed for teams seeking bundled cloud security tooling
- Self-managed hosting may be less appealing for teams preferring pure SaaS
Best for
CubeAPM is suitable for development teams that run microservices-based architectures. It’s especially suited for organizations demanding full MELT coverage, strict compliance, advanced cost control, and high-performance troubleshooting in production-scale systems.
CubeAPM Pricing & Customer Reviews
- Pricing: $0.15/GB of data ingested, inclusive of infra, logs, traces, synthetics, RUM, and error tracking
- G2 Score: 4.7/5
- Praised for: transparent pricing, quick deployment, and industry-leading Slack-based support
CubeAPM vs BugSnag
While BugSnag combines error monitoring, RUM, and basic tracing, CubeAPM delivers full MELT observability with native OTEL support, deep sampling control, and full self-hosting deployment. It also offers transparent pricing without user or span quotas, making it significantly more predictable and cost-efficient for high-ingestion environments.
2. Datadog
Known for
Datadog is a major player in cloud-native observability and security, built to give engineering teams a single place to monitor infrastructure, applications, user experience, and security posture. With its wide ecosystem of native integrations and strong presence in AWS, GCP, Azure, Kubernetes, and CI/CD environments, it’s a go-to choice for DevOps and SecOps teams that need consolidated visibility across hybrid and multicloud deployments.
Standout Features
- Extensive Integration Network: Supports over 900 prebuilt integrations with cloud services, runtimes, and databases, enabling plug-and-play deployment in most environments.
- Collaborative RCA Tools: Notebooks allow engineers to correlate logs, metrics, and traces in one view, annotate findings, and share investigations in real time.
- Full-stack Observability and security: You’ll get performance monitoring alongside threat detection, audits, and vulnerability scanning.
- Session Replay in RUM: Provides full playback of user interactions to debug frontend issues with complete context.
- Serverless Visibility: Datadog tracks cold starts, latency, and errors for AWS Lambda, GCP Cloud Functions, and Azure with little to no overhead.
Key Features
- MELT Coverage: The tool covers metrics, events, logs, traces, synthetics, and RUM for deeper analysis.
- Auto-Instrumentation for Multiple Languages: Lightweight agents for Java, Python, Go, Node.js, .NET, and more capture telemetry with minimal code changes.
- Cloud-Native Optimization: Deep integrations with Kubernetes, ECS, Lambda, Azure Monitor, and GCP Stackdriver for dynamic workloads.
- Built-in Security Telemetry: Surfaces vulnerabilities and compliance gaps alongside performance metrics in the same interface.
- CI/CD Integration: Links errors and regressions to commits, builds, or pull requests for faster rollback decisions.
- Highly Customizable Dashboards: Drag-and-drop widgets allow tailored monitoring views for different teams.
Pros
- Broadest integration catalog in the observability market
- Provides security and observability, both
- RCA-friendly tools for collaborative debugging
- Exceptional support for Kubernetes, serverless, and multicloud
- AI-powered anomaly detection reduces alert fatigue
Cons
- High pricing for smaller teams
- SaaS-only; no option for on-prem deployment
Best for
Datadog is ideal for fast-scaling organizations running containerized, serverless, or microservices workloads across multiple clouds. Its mix of observability and security capabilities supports close collaboration between DevOps and SecOps teams, and its extensive integrations make it well-suited to complex, fast-changing environments, provided teams can manage its cost structure.
Pricing & Customer Reviews
- Infrastructure Monitoring: $15–$34 per host/month
- APM: $31–$40 per host/month (annual); $36 on-demand
- Logs: $0.10/GB of data ingested
- Serverless: $10 per million invocations
- Security Tools: $15–$40 per user/month
- G2 rating: 4.4/5 (based on 630+ reviews)
- Praised for: plenty of integrations, useful dashboards, full coverage for observability
- Criticised for: cost, absence of self-hosted deployment
Datadog vs BugSnag
Datadog offers broader MELT coverage, more integrations, and integrated security compared to BugSnag’s primary focus on error monitoring, RUM, and tracing. However, Datadog’s ingestion-based pricing can escalate rapidly, making it less predictable for large-scale workloads, whereas Insight Hub’s usage is constrained mainly by span/event quotas.
3. Dynatrace
Known for
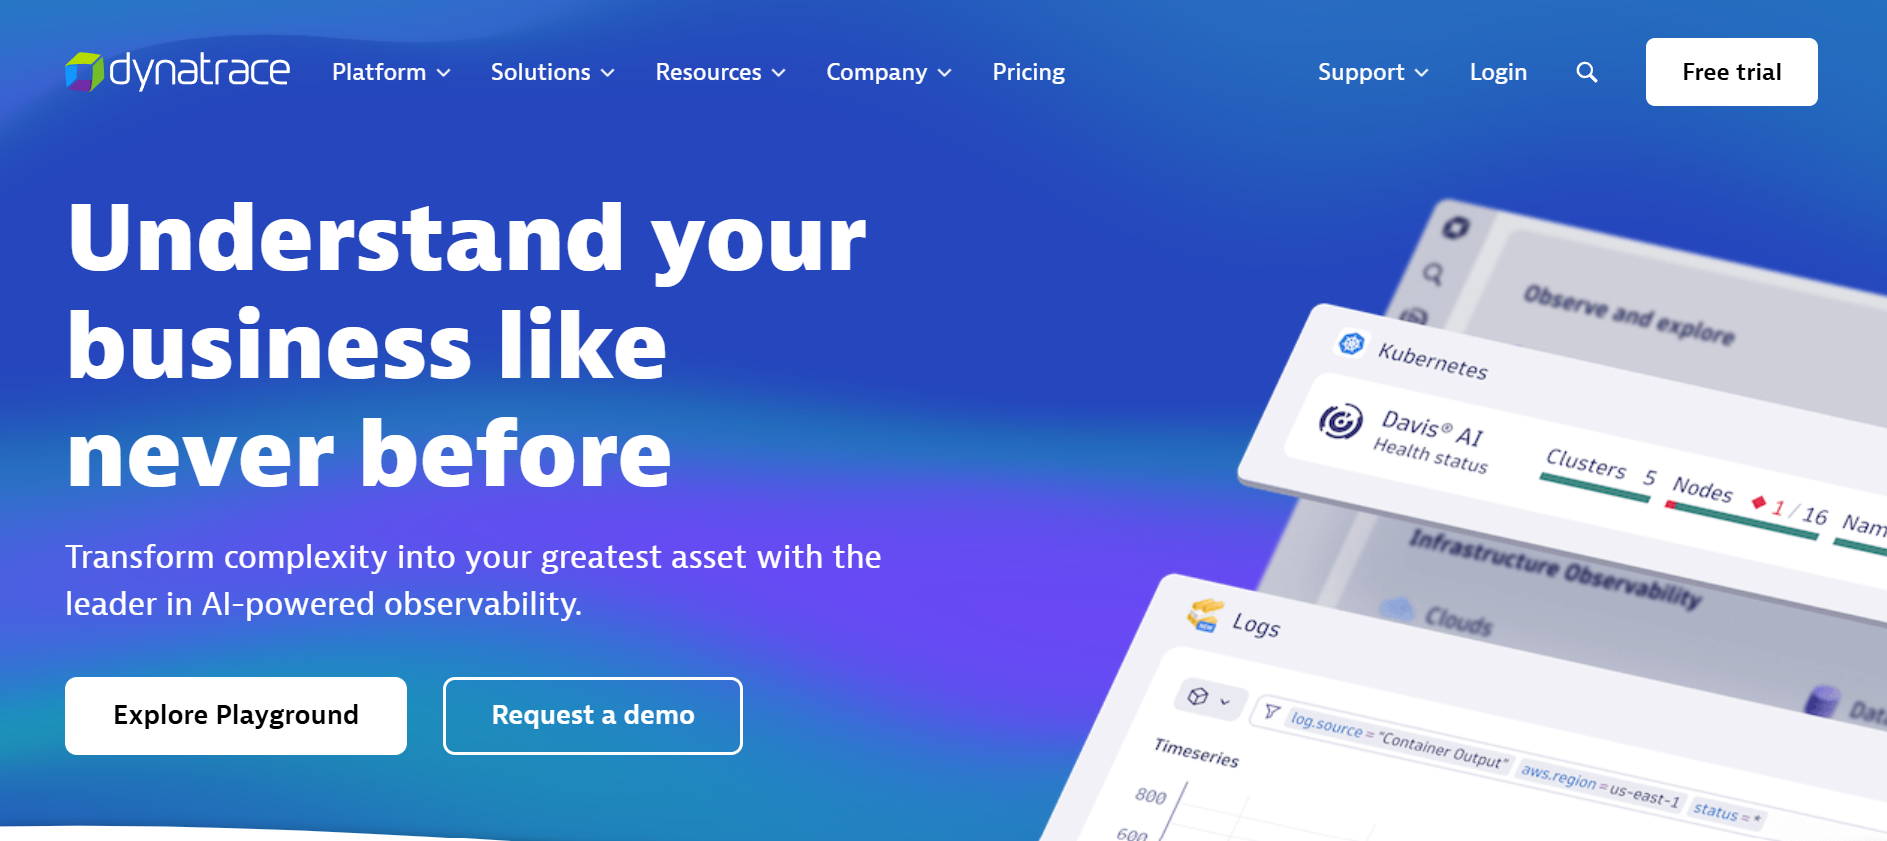
Dynatrace is a high-end enterprise observability and application security solution recognized for merging MELT telemetry with AI-driven automation. Its signature capability lies in the Davis AI engine, which continuously ingests massive volumes of signals to detect anomalies, map dependencies, and pinpoint root causes without the need for manual configuration. This makes it especially attractive to large organizations that demand zero-touch monitoring, high uptime SLAs, and advanced troubleshooting at scale.
Standout Features
- Smartscape Real-Time Mapping: Auto-discovers and visualizes applications, services, dependencies, and infrastructure relationships as they evolve.
- Davis AI Analysis Engine: Correlates signals across metrics, logs, traces, and user data, automatically filtering noise and surfacing the root cause in seconds.
- Built-In Runtime Security: Incorporates runtime application self-protection (RASP) to detect vulnerabilities, exploits, and insecure configurations without requiring extra agents.
- Combined RUM and Synthetic Testing: Integrates synthetic transaction tests with real user monitoring to provide a unified view of digital experience.
Key Features
- MELT: The tool consolidates metrics, logs, events, traces (MELT) and RUM and synthetics, which means full-stack observability.
- OneAgent Auto-Instrumentation: Automatically detects services, APIs, and dependencies—no code changes or manual tagging required.
- Real-Time End-to-End Tracing: Links user actions to backend services, methods, or infrastructure for precise troubleshooting.
- Cloud and Kubernetes Native: Provides pod-level and deployment-level observability for Kubernetes, plus deep integration with AWS, Azure, and GCP.
- Integrated Application Security: Monitors vulnerabilities and code-level risks in real time, bringing security into traditional APM workflows.
- Enterprise-Grade Scalability: Optimized for large hybrid or multicloud deployments with automated agent scaling and centralized policy controls.
Pros
- Industry-leading AI-powered root cause detection
- Seamless auto-instrumentation across diverse tech stacks
- Provides performance observability with application security
- Visual Smartscape mapping makes complex environments easy to navigate
- All-in-one MELT coverage reduces reliance on multiple vendors
Cons
- Expensive at scale
- Learning curve
Best for
Dynatrace is most suitable for large enterprises and platform teams running mission-critical workloads across hybrid and multicloud environments. It’s a strong fit when real-time AI incident triage, zero-touch instrumentation, and integrated security are top priorities.
Pricing & Customer Reviews
- Full-Stack Monitoring: $0.08 per 8 GiB host/hour
- Infrastructure Monitoring: $0.04 per host/hour
- Kubernetes Monitoring: $0.002 per pod/hour
- RUM: $0.00225 per session
- Synthetic Monitoring: $0.001 per HTTP test
- App Security: $0.018 per 8 GiB host/hour
- G2 rating: 4.5/5 (based on 1,300+ reviews)
- Praised for: powerful AI-driven insights, automation, and scalability for hybrid environments
- Criticised for: pricing, steep learning curve
Dynatrace vs BugSnag
Dynatrace offers broader MELT support than BugSnag, in addition to AI-based root cause analysis (RCA) and app security functionalities. However, BugSnag has simpler pricing.
4. New Relic
Known for
New Relic is a cloud-based observability platform tailored for developers, SREs, and DevOps teams running complex, microservices-oriented applications. It provides full-stack MELT visibility, rapid onboarding through native integrations, and deep analysis via its proprietary New Relic Query Language (NRQL). Its strength lies in enabling teams to quickly visualize, query, and correlate telemetry data in real time for both debugging and performance optimization.
Standout Features
- Explorer View for Dependency Mapping: Automatically generates live service maps of applications, infrastructure, and upstream/downstream dependencies to accelerate troubleshooting.
- NRQL-Driven Data Exploration: Leverages the New Relic Query Language for real-time, custom filtering and aggregation across metrics, traces, and logs.
- Lookout ML Anomaly Detection: Uses machine learning baselines to surface anomalies in latency, error rates, and throughput while reducing false alerts.
- Advanced Dashboarding: Allows fine-grained customization of dashboards and visual widgets, enabling role-specific and executive-level reporting.
Key Features
- MELT: The tools can correlate metrics, traces, logs, RUM, synthetics, and events under one data model.
- Agent-Based Auto-Instrumentation: Supports a broad set of programming languages (Java, Python, Ruby, Node.js, Go, .NET) for fast backend integration.
- Cloud & DevOps Integration: Native connectors for AWS, Azure, GCP, Kubernetes, GitHub, and Jenkins to link telemetry directly to deployment events.
- Real User & Synthetic Monitoring: Captures live user sessions alongside synthetic flows to proactively identify performance degradation.
- AI-Powered Baselines: Learns expected behavior patterns over time, improving alert accuracy and reducing noise.
- Fast SaaS Deployment: Minimal configuration required—teams can begin monitoring within minutes of agent installation.
Pros
- Flexible NRQL querying for precise, ad hoc data analysis
- Highly customizable dashboards for multi-team or leadership use
- Rapid onboarding and quick time-to-value via native integrations
- Automatic service mapping simplifies navigating distributed systems
- Strong ecosystem of cloud and CI/CD integrations
Cons
- SaaS-only delivery; on self-hosting
- Pricing complexity due to ingestion, user roles, and feature add-ons
Best for
New Relic is well-suited for SaaS-first engineering teams, platform operations groups, and organizations seeking rapid setup with powerful querying and visualization. It’s particularly effective for CI/CD-aware observability, anomaly detection, and real-time production debugging.
Pricing & Customer Reviews
- Free Tier: 100 GB/month ingest, 1 core user
- Ingestion: $0.40/GB based on retention
- Core User: $49/user/month
- Full Platform Access: $349/user/month, based on features
- G2 rating: 4.4/5 (500+ reviews)
- Praised for: customizable dashboards, query engine performance, easy onboarding
- Criticised for: unpredictable costs, no self-hosted option, and partial OTEL-native integration
New Relic vs BugSnag
New Relic delivers far deeper MELT observability, a powerful query language, and richer dashboard customization compared to BugSnag. However, BugSnag’s OTEL-native tracing and potentially simpler cost structure may appeal to teams trying to avoid complex SaaS pricing or those requiring on-premise deployment.
5. Grafana

Known for
Grafana is an open-source observability and visualization solution. It’s known for its support for open standards and a huge integration ecosystem. It empowers teams to create fully customized dashboards and connect disparate telemetry sources, often leveraging Prometheus, Loki, and Tempo for a complete MELT observability stack under their own control.
Standout Features
- Native OTEL: Grafana integrates natively with OpenTelemetry via Prometheus, Loki, and Tempo for you to visualize data across different data types.
- Integrated Loki & Tempo Backends: Offers built-in log and trace storage engines that connect directly to the Grafana interface, minimizing extra tooling requirements.
- Deployment options: You can run it either as open-source software or deploy it on-premise through Grafana Enterprise or Cloud.
- Advanced Alerting: Supports alert routing, silencing, and escalation policies, with optional OnCall integration for incident response.
Key Features
- Powerful Time-Series Visualization: Delivers rich panels, graphs, gauges, and heatmaps for spotting patterns and anomalies in metrics.
- Compatibility: Offers native support for Tempo, Prometheus, and Loki, which allows teams to easily control their data ingestion, analysis, and storage.
- Plenty of Plugins & Dashboards: The tool offers a large marketplace of plugins for databases, cloud platforms, etc.
- Multiple Hosting Models: Choose from OSS (free), Grafana Cloud for managed hosting, or Enterprise with enhanced features and SLAs.
- Granular RBAC: Define permissions at the team, folder, and dashboard level to enforce security policies.
- Alert Rule Builder: You can build alerts and route them to apps, such as Slack, email, PagerDuty, or webhooks.
Pros
- Free, open-source foundation with strong OTEL support
- Highly customizable dashboards and plugin-based extensibility
- Multiple hosting options to fit regulatory or scaling needs
- Deep integration with Prometheus, Loki, and Tempo
- Backed by a large and active open-source community
Cons
- Complex setup, scaling, and backend optimization
- Support beyond the community level is available only in paid plans
Best for
Grafana is more suitable for DevOps teams and engineering teams looking for a platform that offers great flexibility plus vendor neutrality. It’s especially suited to those comfortable operating Prometheus, Loki, and Tempo independently while prioritizing visualization and customization over turnkey automation or bundled APM features.
Pricing & Customer Reviews
- Grafana OSS: Free
- Grafana Cloud: Free for 10,000 active series
- Pro Tier: From $19/month
- Enterprise: Custom quotes based on scale/support
- G2 rating: 4.5/5 (130+ reviews)
- Praised for: powerful visualization, flexible deployment options, strong open-source community
- Criticised for: Setup difficulty, basic features in the free plan
Grafana vs BugSnag
Grafana provides unmatched visualization flexibility and native OTEL integration, enabling teams to craft custom observability environments. BugSnag, however, may offer a simpler, more consolidated experience for organizations that want fewer moving parts and built-in ingestion pipelines without managing backend complexity.
6. Honeycomb
Known for
Honeycomb is recognized as an “observability-first” platform tailored for SREs and developers who need to deeply query and understand complex, event-driven systems. It emphasizes high-cardinality, real-time data exploration, and empowers teams to ask ad-hoc questions of their telemetry with minimal setup.
Standout Features
- High-Cardinality Query Engine: Designed to handle multi-dimensional, high-cardinality data without pre-aggregation, making mystery debugging and deep exploration lightning-fast.
- Event-Centric Exploration UI: Interactive filtering and “bubble-up” workflows allow users to pivot through traces, traces events, and metadata in real-time.
- Heatmap-Based Visual Insights: Visualizes performance distributions via heatmaps and flamegraphs to highlight anomalies and performance regressions over time.
Key Features
- Ad-Hoc Trace & Event Analytics: Enables deep querying across events, spans, and custom fields without much upfront indexing or schema definitions.
- Real-Time Interaction Feedback: Enables instant feedback on queries, supporting rapid hypotheses and live debugging during incidents.
- Compact Collaboration: Shared queries, dashboards, and annotations keep teams aligned during incident resolution.
- Scalable OLAP-Style Storage: Optimized for rapid access to high-cardinality data, combining compression with performance.
- SaaS-Based Delivery: Fully managed service that offloads telemetry storage, scaling, and infrastructure management from users.
Pros
- Exceptional for exploring complex, high-cardinality datasets
- UI supports deep, iterative investigation workflows
- Real-time performance analysis accelerates root cause identification
- Strong collaboration features are embedded within the UI
Cons
- Expensive, especially for smaller teams
- Significant learning curve
Best for
Honeycomb is ideal for development, SRE, and platform teams managing event-rich, distributed microservices that require fine-grained, real-time observability. It shines in environments where ad-hoc querying, multi-dimensional troubleshooting, and seamless collaboration are needed.
Pricing & Customer Reviews
- Free: for 20 million events/month
- Paid: Starts $130/month for 100M events
- Enterprise: Custom
- G2 rating: 4.7/5 (15 reviews)
- Praised for: intuitive event exploration, powerful heatmap visuals, and flexible ad-hoc debugging workflows (based on community feedback).
- Criticised for: steep costs at high cardinality, learning curve
Honeycomb vs BugSnag
Honeycomb excels at interactive, high-cardinality event and trace exploration within distributed systems, offering unmatched investigation workflows. BugSnag, on the other hand, packages tracing with error monitoring, RUM, and release insights—better suited to teams wanting a consolidated pipeline with less manual querying overhead.
7. IBM Instana

Known for
IBM Instana is known for delivering AI-assisted observability with automatic service discovery, real-time topology mapping, and flexible deployment across SaaS or self-hosted environments. It’s built to monitor applications, containers, and infrastructure end-to-end while supporting compliance-heavy industries through on-prem and hybrid options.
Standout Features
- Causal AI-Powered Incident Detection: Uses causality-based machine learning to identify the true root cause of incidents rather than just correlated dependencies, reducing noise and accelerating resolution.
- Continuous Auto-Mapping: Automatically discovers services, APIs, containers, and infrastructure nodes to maintain an always-up-to-date system topology.
- AI-Driven Remediation Guidance: Leverages Watsonx.ai automation to provide resolution recommendations based on historical fixes and known incident patterns.
Key Features
- Full MELT Observability: Combines metrics, events, logs, traces, RUM, and synthetic monitoring in a single interface for unified visibility.
- End-to-End Stack Coverage: Supports applications, microservices, Kubernetes clusters, and VMs with minimal manual configuration.
- OpenTelemetry Integration: Connects to OTEL collectors for enhanced interoperability while still offering native instrumentation.
- Automated Baseline Learning: Establishes performance baselines and triggers anomaly alerts when deviations are detected, helping to reduce false positives.
- Granular Session Monitoring: Captures detailed real user session data to identify frontend issues in real time.
- Deployment Flexibility: Offers both cloud-hosted and self-managed deployment modes to meet data sovereignty and compliance needs.
Pros
- Accelerates mean-time-to-resolution with automated root cause detection
- Minimal setup thanks to automatic mapping and instrumentation
- Intelligent remediation suggestions reduce manual troubleshooting effort
- Supports both SaaS and self-hosted deployments for regulated industries
- Well-rated for ease of use and responsive customer support
Cons
- High per-host pricing, which can escalate with growing needs
- UI slow downs
- Difficult to learn
Best for
IBM Instana is a strong choice for mid-to-large enterprises, SRE teams, and platform engineering groups that require automated discovery, AI-powered troubleshooting, and flexible deployment options. It’s especially suited to hybrid or compliance-focused environments where both observability depth and deployment control are essential.
Pricing & Customer Reviews
- Essentials: $20 per host/month
- Standard: $75 per host/month
- G2 rating: 4.4/5 (396+ reviews)
- Praised for: intuitive user interface, quick setup, and strong customer support
- Criticized for: performance issues, scaling cost
IBM Instana vs BugSnag
IBM Instana focuses on automated discovery, real-time dependency mapping, and AI-powered root cause detection across the full MELT stack, with the flexibility of both SaaS and self-hosted deployment. It’s suitable for hybrid as well as compliance-heavy environments. In contrast, Bugsnag is specialized for application stability monitoring, error tracking, and release health analytics, primarily targeting frontend and mobile teams.
Conclusion: What’s the best CubeAPM is the Best Aspecto Alternative
Aspecto (BugSnag) offers valuable release health and error tracking, but it’s primarily a SaaS platform, which may not be suitable for compliance-focused organizations. Its pricing is also based on monthly events and spans, which can escalate with growing needs.
CubeAPM addresses these challenges head-on with a simpler, cost-effetive pricing of just $0.15/GB of ingested data. It also offers self-hosting deployment on your cloud or on-premise infrastructure to meet compliance requirements. The platform is complete MELT observability, OTEL-native, and offers smart context-aware sampling that cuts costs by up to 50%. Book a free demo with CubeAPM today.
Disclaimer: The information in this article reflects the latest details available at the time of publication and may change as technologies and products evolve.
FAQs
1. What is Aspecto (BugSnag) used for?
Aspecto or BugSnag is primarily used for release health tracking, error monitoring, and performance insights for modern applications. It focuses on helping developers debug and analyze service-level performance issues.
2. Why should I look for Aspecto alternatives?
You might seek Aspector or BugSnag alternatives if you need a full on-premise or self-hosting deployment and simpler pricing.
3. What features should I look for in an Aspecto alternative?
Key features include unified MELT observability, native OTEL support, advanced sampling strategies for cost control, flexible hosting models, compliance readiness, and fast, responsive support channels.
4. Is CubeAPM a good alternative to Aspecto?
Yes. CubeAPM offers complete MELT coverage, OTEL-native ingestion, real-time dashboards, compliance-focused self-hosting deployment, and transparent ingestion-based pricing.
5. Are there free alternatives to Aspecto?
Yes. Open-source tools like Jaeger, Grafana Tempo, and SigNoz offer free self-hosted options. However, they may require significant engineering effort to deploy and maintain.


