Application Performance Monitoring (APM) is no longer optional—it’s a core requirement for businesses running cloud-native, microservices, and SaaS applications. Enterprises that actively monitor application performance see a 30% reduction in downtime incidents compared to those without a monitoring strategy.
Modern APM solutions like CubeAPM provide end-to-end observability, also catering to developer-first teams with lightweight setups and OpenTelemetry (OTEL) integration. These tools go beyond uptime checks, offering insights into distributed tracing, infrastructure monitoring, log management, and error tracking.
This article compares the Top 8 APM tools. Each is evaluated on features, pricing, strengths, limitations, and best use cases—helping teams make informed choices.
What is an APM Tool?
An Application Performance Monitoring (APM) tool helps organizations track, analyze, and optimize the performance of applications in real time. It collects telemetry data such as response times, throughput, and error rates across distributed systems.
APM tools typically include several core capabilities:
- Distributed Tracing: Follows a user request or transaction as it moves through multiple services, APIs, and databases, making it easier to find where delays occur.
- Infrastructure & Resource Monitoring: Tracks CPU, memory, network, and database utilization to see how underlying infrastructure affects application behavior.
- Error & Exception Tracking: Automatically captures and categorizes failures so teams can detect recurring problems and prioritize fixes.
- Alerting & Anomaly Detection: Sends notifications when thresholds are breached, or unusual patterns emerge, reducing mean time to detect (MTTD) and resolve (MTTR).
- User Experience Monitoring: Some APMs also include Real User Monitoring (RUM) or synthetic monitoring to measure frontend performance from the customer’s perspective.
This makes them critical for debugging, optimizing cloud-native architectures, and ensuring reliability in complex distributed environments.
Why Teams Choose Different APM Tools
1. Cost Predictability
Pricing is a major differentiator. Some tools charge per GB ingested, per host, or per feature. Teams often move to alternatives that provide transparent billing to avoid bill shock at scale.
2. OpenTelemetry-First Approach
OpenTelemetry has become the industry standard for instrumentation. Tools that embrace OTEL reduce vendor lock-in and allow seamless data portability.
3. Strong Logs ↔ Traces ↔ Metrics Correlation
When an issue occurs, being able to move from logs to traces to metrics in one workflow saves time and accelerates root-cause analysis.
4. Kubernetes and Multi-Cloud Readiness
Cloud-native teams need tools that can handle dynamic, ephemeral workloads. Native Kubernetes and multi-cloud observability is often a must-have. Teams value APMs that highlight slow queries, deadlocks, and cache misses alongside application traces.
5. Integration Ecosystem
Modern engineering teams rely on dozens of tools across CI/CD, alerting, cloud platforms, and collaboration. An APM solution with broad integrations—Slack, Jira, Kubernetes, AWS/GCP/Azure, Terraform, and more—simplifies adoption and avoids data silos. CubeAPM stands out here with 800+ native integrations, making it easy to plug into existing stacks without extra overhead.
6. Ease of Use
Many teams pick APM platforms based on how easy they are to set up and use. Complex tools with steep learning curves slow down adoption, especially for smaller teams. That’s why solutions with straightforward onboarding, minimal configuration, and intuitive dashboards win preference. CubeAPM stands out here with its frictionless deployment(setup <1 hr), clean UI, and ready-to-use integrations, helping teams start monitoring in hours instead of weeks.
Top 8 APM Tools
Full-Stack Observability (Metrics, Traces, Logs)
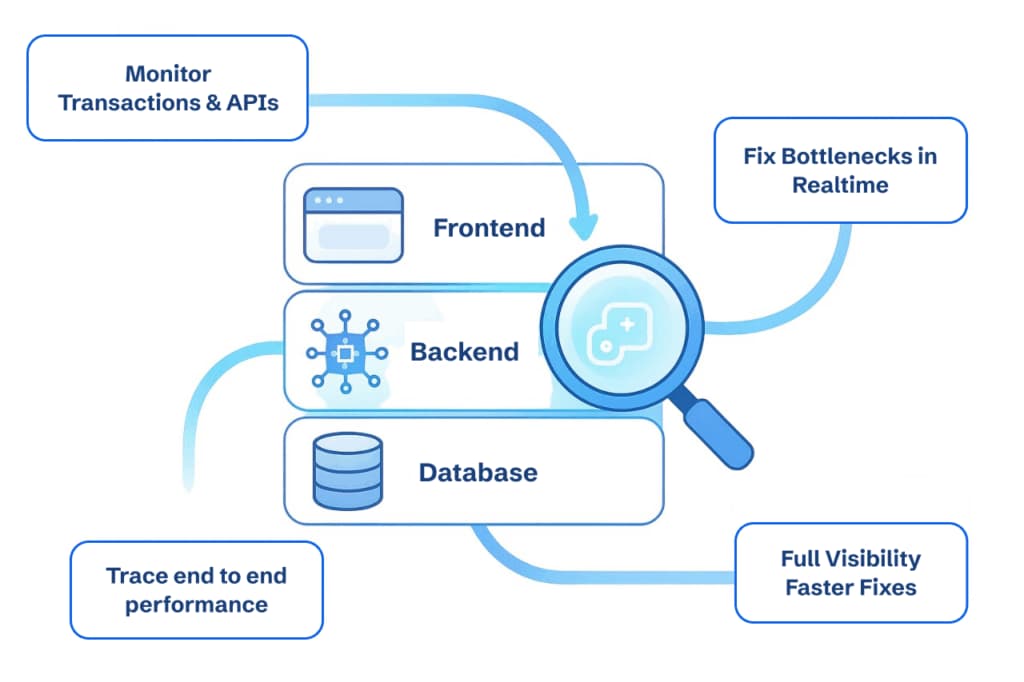
Full-stack visibility across frontend, backend, APIs, and databases — powered by CubeAPM.
- CubeAPM: Modern OpenTelemetry-native platform covering metrics, events, logs, and traces (MELT). Smart sampling keeps costs predictable at scale.
- Datadog: Cloud-first observability with 900+ integrations and end-to-end monitoring across infra, APM, and security.
- New Relic: Unified observability with ingestion-based pricing, strong ecosystem support, and AI-powered insights.
- Dynatrace: Enterprise-grade monitoring with automation, Davis AI engine, and broad enterprise cloud coverage.
Visualization & Dashboards
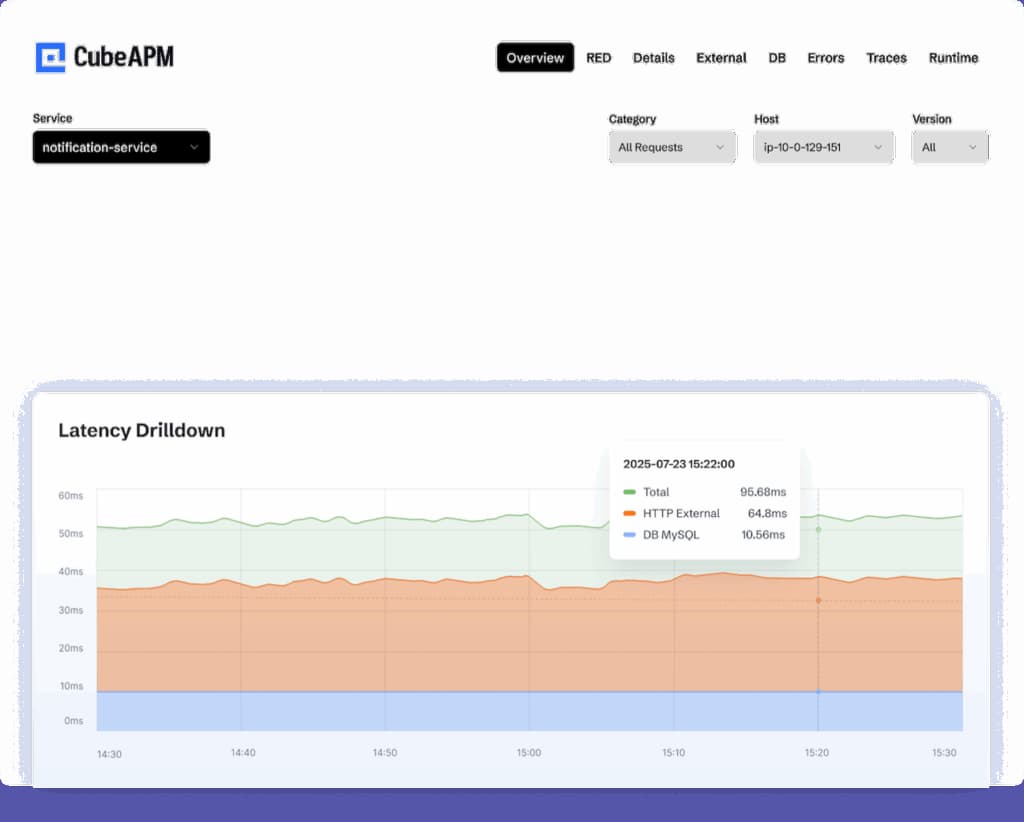
Real-time latency drilldowns in CubeAPM reveal exactly where your service is slowing down
- Grafana: Highly flexible visualization and dashboarding, integrates with multiple data sources for custom observability stacks.
- Coralogix: Strong in log analytics and pipeline optimization, AI-driven observability with real-time dashboards.
Open Source & Cost-Controlled Observability
- SigNoz: OTEL-first, open-source APM offering full-stack coverage with transparent usage-based pricing.
Enterprise-Grade Monitoring & Compliance
- CubeAPM: OpenTelemetry-native observability platform built for scale, with transparent ingestion-based pricing, full MELT correlation (Metrics, Events, Logs, Traces), and self-hosted deployment options for strict compliance needs (HIPAA, GDPR, DPDP)
- Splunk AppDynamics: Enterprise observability cloud with strong compliance support, AI-based anomaly detection, and performance monitoring at scale.
1. CubeAPM
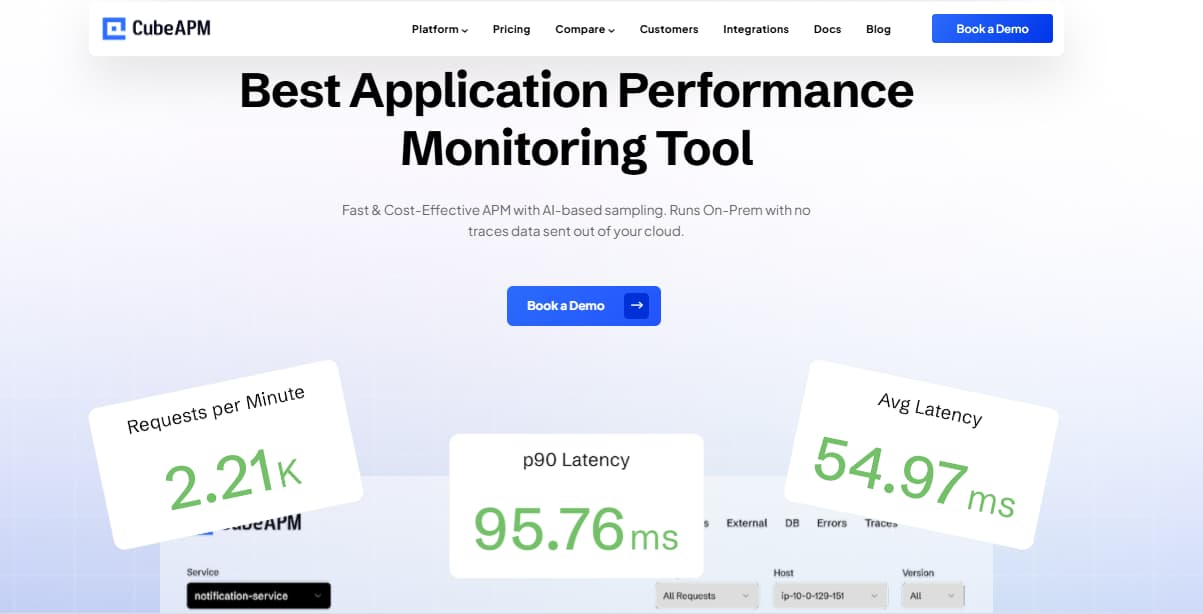
Overview
CubeAPM is a next-generation, OpenTelemetry-native APM platform built for cost efficiency, compliance, and simplicity. Unlike incumbents that rely heavily on ingestion-based pricing, CubeAPM uses smart sampling to retain critical telemetry while keeping costs predictable.
Key Advantage
The biggest advantage of CubeAPM is its transparent and predictable pricing model. Instead of charging high ingestion or user-license fees, CubeAPM leverages smart sampling and on-prem deployment options to reduce infrastructure costs while ensuring compliance.
Key Features
- Smart Sampling: Retains error-heavy or latency traces while discarding irrelevant noise, reducing data costs without sacrificing insights.
- Full-Stack Observability: Includes distributed tracing, logs, metrics, infra monitoring, DB analysis, synthetics, and RUM in one suite.
- On-Prem Hosting: Stores telemetry inside your own cloud to meet localization laws and save on data transfer costs.
- High Compatibility: Works seamlessly with Prometheus, OTEL, Datadog, New Relic, and Elastic agents, easing migration.
- Unlimited Retention: Teams can keep all telemetry data indefinitely without hidden retention fees.
Pros
- Cost-efficient and predictable billing.
- An extensive integrations ecosystem, 800+ integrations.
- Zero egress costs.
- Unlimited data retention at no additional cost.
- Strong customer support with rapid SLAs.
- Compliance-ready with on-prem/self-hosting options.
Cons
- Not suited for teams looking for off-prem solutions
- Strictly an observability platform and does not support cloud security management
CubeAPM Pricing with Scale Example
Flat pricing of $0.15/GB
Scaling Example
*All pricing comparisons are calculated using standardized Small/Medium/Large team profiles defined in our internal benchmarking sheet, based on fixed log, metrics, trace, and retention assumptions. Actual pricing may vary by usage, region, and plan structure. Please confirm current pricing with each vendor.
For a mid-sized SaaS company ingesting 45TB(~45,000) total monthly data ingestion and 45,000TB of observability data outcharged by the cloud provider, the total cost will be about ~$7200/month.
Tech Fit
CubeAPM is particularly suited for cloud-native teams running Kubernetes or serverless workloads who want cost control without losing observability depth. It’s also a strong fit for regulated industries (finance, healthcare, government) where data must stay within specific regions, thanks to its on-prem hosting option. For organizations scaling quickly, CubeAPM ensures costs remain predictable even with large data volumes, making it ideal for fast-growing SaaS and enterprise teams.
2. Datadog
Overview
Datadog is one of the most widely adopted observability platforms, offering broad feature coverage and 600+ integrations. It is the go-to choice for many enterprises because of its ability to cover almost any workload or technology stack out of the box.
Key Advantage
Datadog’s advantage is its comprehensive observability ecosystem. With hundreds of pre-built integrations, it allows teams to monitor nearly every component of modern systems. This depth and breadth make it appealing for enterprises that don’t want to stitch together multiple niche tools.
Key Features
- Distributed Tracing: Maps end-to-end service performance across microservices.
- Infrastructure Monitoring: 900+ integrations spanning cloud, on-prem, and hybrid systems.
- Log Management: Centralized storage and analysis of logs at scale.
- Security Monitoring: Detects vulnerabilities, suspicious activity, and misconfigurations.
- Synthetic + RUM: Proactively tests user-facing endpoints and monitors real user performance.
Pros
- Extremely feature-rich platform.
- Market-leading Kubernetes support.
- Mature dashboards and reporting.
- Large enterprise adoption and support ecosystem.
Cons
- Expensive at scale.
- Initial setup is complex, requiring expertise.
- Smaller teams often feel overwhelmed by its breadth.
Datadog Pricing with Scale
- APM (Pro Plan): $35/host/month
- Infra (Pro Plan): $15/host/month
- Ingested Logs: $0.10 per ingested or scanned GB per month
Scaling Example
For a mid-sized SaaS company operating 125 APM hosts, 40 profiled hosts, 100 profiled container hosts, 500,000,000 indexed spans, 200 infra hosts, 1,500,000 container hours, 300,000 custom metrics, and ingesting around 10TB(~10,000 GB) of logs per month with 3500 indexed logs, the monthly cost would be around ~$27,475/month.
Tech Fit
Datadog is a great fit for large enterprises or fast-scaling organizations that prioritize feature breadth over cost control. It excels in environments with complex multi-cloud deployments and Kubernetes-heavy workloads where teams need deep integrations and dashboards. For teams with generous budgets and a preference for a single vendor covering everything from monitoring to security, Datadog remains a strong choice.
3. New Relic

Overview
New Relic is one of the pioneers in the APM space, with strong adoption among developers and enterprises looking for detailed application insights. It is known for its ease of onboarding and extensive support for languages like Java, .NET, Node.js, Python, and Ruby. With full-stack observability features, New Relic remains a trusted choice for organizations transitioning to modern distributed architectures.
Key Advantage
New Relic’s key advantage is its deep application performance visibility, particularly around JVM and backend systems. Its APM capabilities are widely recognized for providing granular transaction-level details, making it a favorite among engineering teams dealing with complex monoliths or microservices.
Key Features
- Application Performance Monitoring: Granular transaction tracing across multiple languages.
- Logs in Context: Connects log events with traces and errors for unified debugging.
- Error Analytics: Identifies anomalies and tracks error rates with real-time alerts.
- Infrastructure Monitoring: Correlates app behavior with infrastructure metrics.
- Browser + Mobile Monitoring: Provides frontend-to-backend visibility for user experience.
Pros
- Deep JVM and backend monitoring.
- Easy setup and fast agent-based instrumentation.
- Strong transaction-level tracing.
- Integrates frontend + backend performance views.
Cons
- High costs at scale with ingestion-based billing.
- Complex initial setup
- Overwhelming UI, especially for beginners
New Relic Pricing with Scale
- Free Tier: 100GB/month ingested
- Pro plan: $0.40/GB ingested beyond the free 100GB limit
- Pro Plan: $349/user for full platform user
Scaling Example
A mid-sized SaaS company ingesting 45TB (~45,000 GB) of telemetry data per month and with 10 full users, the cost would come around ~$25,990/month.
Tech Fit
New Relic is a strong fit for organizations with Java, .NET, and Node.js applications needing deep application tracing. It works well for engineering teams seeking quick onboarding and end-to-end visibility without heavy setup. SaaS businesses and enterprises with full-stack monitoring needs find it especially valuable, though costs can become a barrier as data volumes scale.
4. Dynatrace
Overview
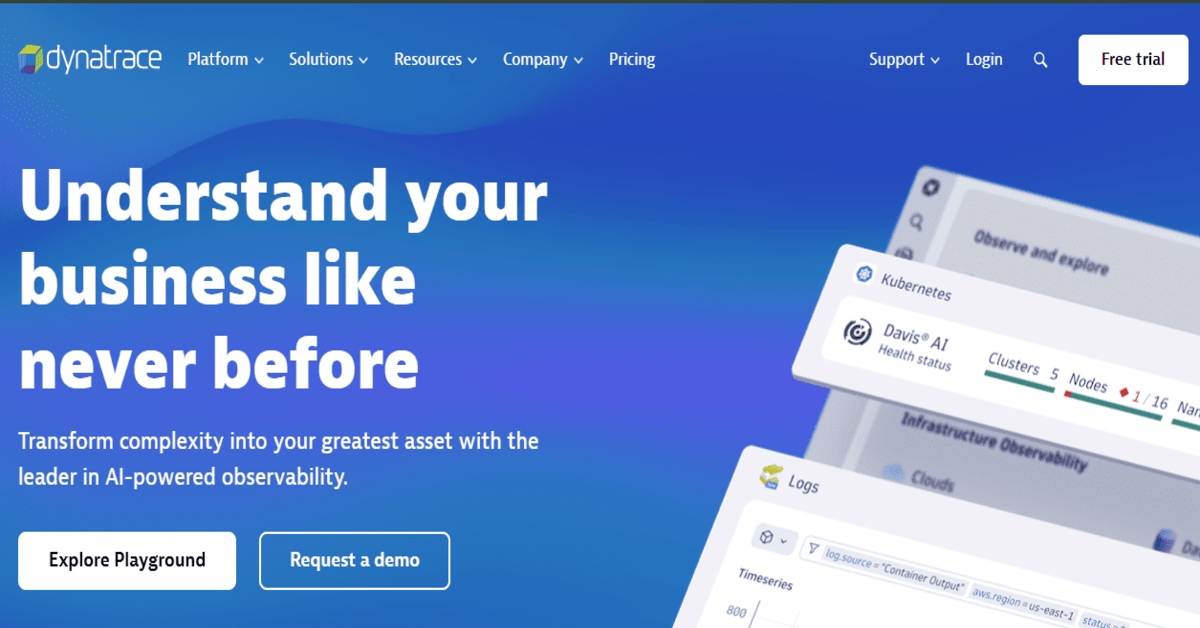
Dynatrace is an enterprise-grade observability platform known for its AI-powered insights and automation. It is widely used by Fortune 500 companies and large organizations with complex, hybrid, and multi-cloud environments. Dynatrace goes beyond monitoring by using Davis AI to provide root-cause analysis and auto-remediation capabilities, making it a top choice for IT Ops and enterprise DevOps teams.
Key Advantage
Dynatrace’s standout advantage is its AI-driven observability engine. The platform automatically maps dependencies, identifies anomalies, and suggests root causes, reducing the manual effort engineers spend on troubleshooting. This predictive and automated approach makes it especially powerful for enterprises with massive, distributed systems.
Key Features
- Full-Stack Monitoring: Covers infrastructure, APM, logs, and security monitoring.
- AI-Powered Davis Engine: Automates anomaly detection and root-cause analysis.
- End-to-End Tracing: Granular service and transaction visibility.
- Cloud-Native Readiness: Strong Kubernetes, OpenShift, and multi-cloud support.
- Synthetic Monitoring: Tests performance with simulated traffic.
Pros
- Market leader in enterprise observability.
- Excellent automation with AI-driven insights.
- Broad integrations with cloud and hybrid infrastructures.
- Strong security monitoring features.
Cons
- Expensive as usage grows.
- Steeper learning curve for smaller teams.
- Overwhelming UI for new users.
Dynatrace Pricing with Scale
- Infrastructure Monitoring: $29/mo/host
- Full-Stack Monitoring: $58/mo/8 GiB host
Scaling Example
A midsized SaaS company operating 125 APM hosts, 200 infra hosts, 10TB(~10,000 GB) of ingested logs, 300,000 custom metrics, 1,500,000 container hours, and 45,000GB of observability data out(charged by cloud provider), the cost would come around ~$21,850/month.
Tech Fit
Dynatrace is best suited for large enterprises with hybrid or multi-cloud setups. It excels in environments where teams require automation, AI-powered analysis, and predictive monitoring. Enterprises with large Kubernetes deployments or IT Ops-heavy organizations benefit most, while SMBs often find it too costly or complex.
5. Coralogix
Overview
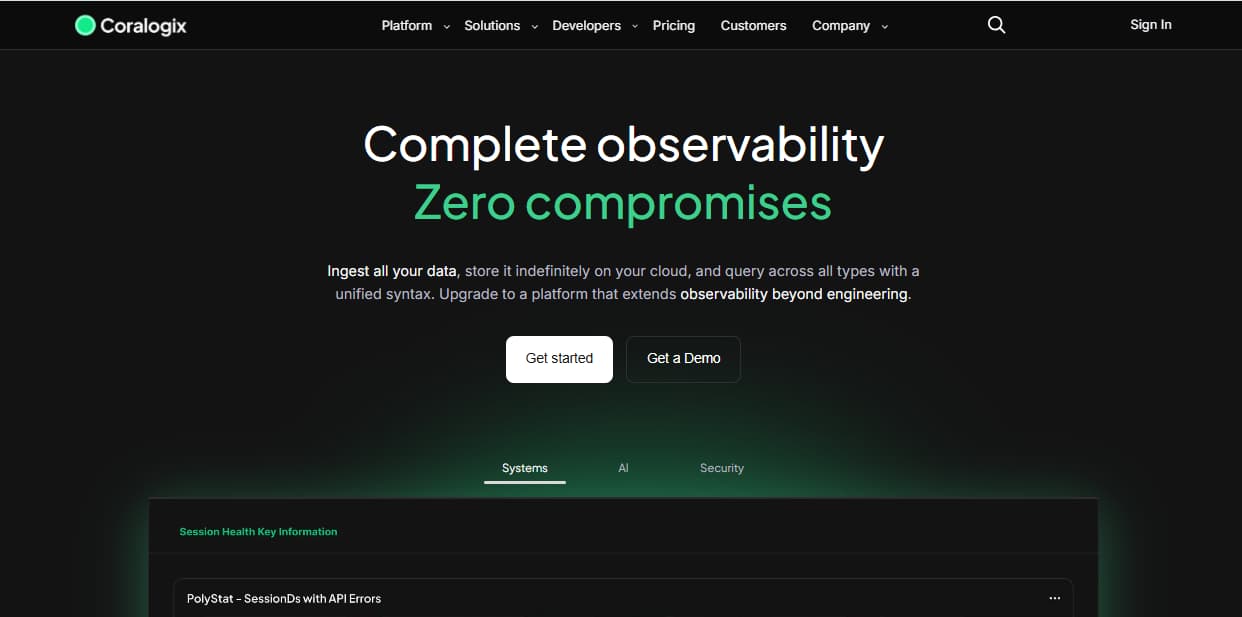
Coralogix is an observability platform known for its cost-optimized data streaming and “log data in motion” approach. Unlike traditional platforms that store all data first, Coralogix allows teams to route, block, or archive data before indexing.
Key Advantage
Coralogix’s key advantage is its Streama technology, which processes and analyzes logs in real time without the need to index everything. This drastically reduces costs while still enabling full observability and compliance.
Key Features
- Streama Processing: Real-time log streaming, classification, and cost control.
- Unified Observability: Logs, metrics, traces, and security events under one platform.
- AI/ML Insights: Automated anomaly detection and alerting.
- OpenTelemetry Support: Native OTEL pipelines for traces and metrics.
- Flexible Retention: Decide which data to store, drop, or archive.
Pros
- Highly cost-efficient with log streaming.
- Flexible data retention policies.
- Good OpenTelemetry support.
- Scales well for log-heavy environments.
Cons
- Expensive as usage grows.
- Steep learning curve for new users.
- Overwhelming UI for beginners.
- Complex initial setup.
Coralogix Pricing with Scale
- Logs: $0.42 / GB
- Traces: $0.16 / GB
- Metrics: $0.05 / GB
Scaling Example
For a midsized SaaS company ingesting 25,000GB of data by APM hosts, 10,000GB of data by infra hosts, 10,000GB of data by log hosts, and 45,000GB of observability data out(charged by cloud provider), the cost would be around ~$13,200.
Tech Fit
Coralogix is best for teams handling log-heavy workloads where storage costs become unsustainable. It’s a strong fit for companies needing real-time log streaming, anomaly detection, and compliance-friendly retention. Cloud-native teams that want OpenTelemetry pipelines with fine-grained cost control benefit most from Coralogix.
6. Splunk AppDynamics
Overview
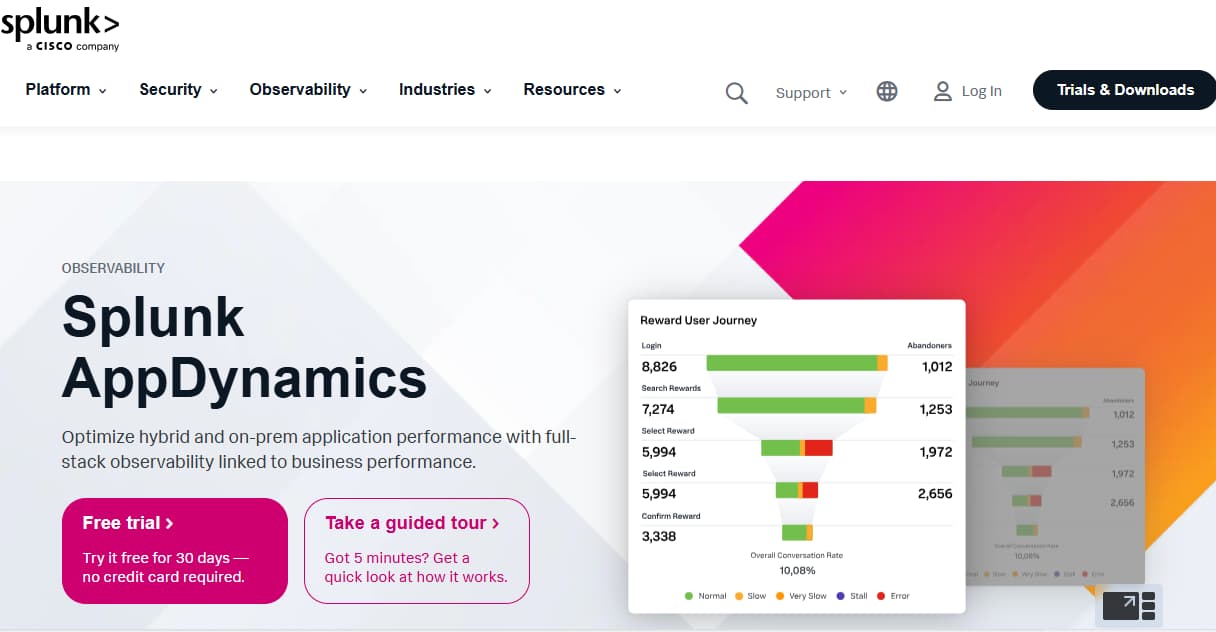
Splunk AppDynamics, previously SignalFx, is built for large-scale enterprise observability. Integrated with Splunk’s logging and SIEM ecosystem, it is favored by Fortune 500 companies requiring high-throughput analytics and ML-powered anomaly detection.
Key Advantage
Its key strength is enterprise-scale tracing with AlwaysOn profiling. This ensures high-volume traces can be analyzed without sampling gaps, giving enterprises granular visibility into distributed systems.
Key Features
- Distributed Tracing: AlwaysOn approach captures large-scale traces.
- Anomaly Detection: ML-based alerts across telemetry.
- Kubernetes Monitoring: Strong container and cluster observability.
- Cloud Monitoring: Works with multi-cloud and hybrid setups.
- Splunk Integration: Seamless with Splunk’s logging and security stack.
Pros
- Enterprise-grade scalability.
- Strong ML-driven anomaly detection.
- Seamless integration with the Splunk ecosystem.
- Good fit for regulated industries.
Cons
- Expensive at scale.
- Complex user interface.
- Overwhelming UI, especially for new users.
Pricing
- AppDynamics APM: starts at $33/month/CPU core
- Infra Monitoring: starts at $6/month/CPU core
Scaling Example
For a mid-sized SaaS company running 125 hosts and 45,000GB of observability data out(charged by cloud provider), the cost will be around ~$8,625/month.
Tech Fit
Splunk APM is best suited for large enterprises already invested in Splunk’s ecosystem. It’s particularly strong in regulated industries (finance, government, healthcare) that need advanced compliance and ML-driven security + observability.
7. SigNoz

Overview
SigNoz is a fast-growing open-source, OTEL-native APM. It offers developers a transparent, self-hosted alternative to commercial vendors, making it a popular choice among startups and SMBs.
Key Advantage
Its biggest advantage is open-source flexibility without vendor lock-in. Teams can self-host, customize, and run their own observability stack at minimal cost.
Key Features
- Traces, Metrics, Logs: Full observability coverage.
- OpenTelemetry Native: Built fully around OTEL.
- Deployment Options: Run on-prem or use managed cloud.
- Grafana/Prometheus Integration: Works with popular OSS tools.
- Alerting & Anomaly Detection: Out-of-the-box rules for system health.
Pros
- Completely free when self-hosted.
- Open-source and transparent.
- No vendor lock-in.
- Developer-friendly for OSS users.
Cons
- Requires operational effort to manage at scale.
- Steep learning curve for new users
- Requires expertise to manage high-volume workloads.
Signoz Pricing with Scale
- Free for self-hosted OSS.
- Free tier + base fee of $49/month. Charges beyond the base fee are based on data ingested:
- Traces: $0.30/GB.
- Logs: $0.30/GB.
- Metrics: $0.10/million samples.
Scaling Example
For a mid-sized SaaS company that ingests 25,000GB of data by APM hosts, 10,000GB of data by infra hosts, 10,000GB of data by log hosts, and 45,000GB of observability data out(charged by cloud provider), the cost would be around ~$16,000.
Tech Fit
SigNoz is best for startups, SMBs, and developer teams who prefer OSS-first solutions and want to avoid vendor lock-in. It’s also well-suited for teams experimenting with OTEL or those with limited budgets.
8. Elastic Observability
Overview
Elastic APM, part of the Elastic Stack, is well known for its powerful search and analytics. Organizations already using Elasticsearch for logging often extend it to APM for a unified stack.
Key Advantage
Elastic APM’s biggest advantage is its deep integration with Elasticsearch, which allows teams to perform complex queries and correlations across logs, metrics, and traces.
Key Features
- Unified Telemetry: Stores logs, metrics, and traces in Elasticsearch.
- Rich Search Capabilities: Query data flexibly using Kibana.
- Deployment Options: Elastic Cloud or self-host.
- OTEL Support: Works with standard instrumentation.
- Integration Ecosystem: Large community and plugin support.
Pros
- Strong search and correlation features.
- Wide open-source community.
- Flexible deployment models.
- Cost-efficient if already using Elastic.
Cons
- Elasticsearch scaling complexity.
- Storage and infra costs grow rapidly.
- Requires in-house expertise to tune.
Elastic Observability Pricing with Scale
- Standard: $99/month
- Gold: $114/month
- Platinum: $131/month
- Enterprise: $184/month
Scaling Example
For a mid-sized SaaS company with 125 APM hosts, 20TB of events ingestion per month, and 45,000GB of observability data out(charged by cloud provider), the cost would be around $17435.
Tech Fit
Elastic APM is best for teams already invested in Elastic Stack for logging or analytics. It’s suited for organizations that value search-heavy workflows and want a single stack for observability and analytics.
Best APM Tools by Use Case & Technology
Startups & SMBs
- CubeAPM: Cost-effective with smart sampling, predictable pricing, and simple onboarding—ideal for fast-growing teams moving from small to mid-size.
- SigNoz: Lightweight and affordable observability, easy self-hosting, and open-source flexibility.
- New Relic: Quick cloud integration with guided setup, making it friendly for smaller teams.
Large Enterprises
- CubeAPM: Scales seamlessly with enterprise workloads, combining MELT observability and OpenTelemetry-native pipelines.
- Dynatrace: AI-powered full-stack observability designed for massive, complex environments.
- Datadog: Handles thousands of hosts with strong multi-cloud integrations and enterprise security compliance.
Kubernetes-Heavy Environments
- CubeAPM: Supports bare-metal, VMs, and Kubernetes with native OpenTelemetry, Helm-based setup, and deep pod/node visibility.
- Datadog: Auto-discovers clusters, monitors pods, and gives real-time container health.
Serverless-First Apps
- CubeAPM: Provides function-level tracing, error correlation, and cost-effective monitoring for AWS Lambda and Azure Functions.
- New Relic: Strong Lambda and Azure Functions monitoring with event-driven trace correlation.
Java Applications
- CubeAPM: Natively understands OTLP, making it compatible with JVM-based frameworks for logs, metrics, and traces.
- New Relic: Deep JVM monitoring, thread profiling, and code-level tracing.
- Dynatrace: Strong enterprise-grade support for large Java applications with AI-based anomaly detection.
- Elastic APM: Open-source agent for JVM apps with log-trace correlation.
Node.js Applications
- CubeAPM: Full OpenTelemetry tracing support for Node.js services with async request handling.
- New Relic: Node.js agent with async I/O monitoring and distributed tracing.
- Elastic APM: Efficient async handling and low-overhead tracing for Node apps.
SaaS Products
- CubeAPM: Predictable scaling costs, SaaS-native integration, and end-to-end MELT observability.
- SigNoz: OSS-based solution with simple scaling for multi-tenant SaaS products.
- New Relic: Multi-cloud support and strong integrations for SaaS growth stages.
Testing / Pre-Prod Environments
- CubeAPM: Lightweight to set up, supports environment tagging, and integrates well into CI/CD pipelines.
- IBM Instana: Quick setup and automatic environment tagging for dev/test pipelines.
- SigNoz: Flexible OSS for sandbox and staging monitoring.
- Datadog: Tag-based environment management with CI/CD integrations.
How to Choose the Right APM Tool
1. Cost Predictability
Tools with per-host and add-on billing (like Datadog, Splunk, or Dynatrace) often scale unpredictably. A usage-based model with transparent rates (like CubeAPM’s $0.15/GB) avoids surprise bills.
2. OpenTelemetry & Standards Support
Modern observability depends on OTEL for vendor neutrality. Ensure your tool supports full OTEL ingestion across logs, metrics, and traces.
3. Scalability & Performance
Consider whether the tool can handle 10TB+ ingestion/month and thousands of requests without performance drops. Self-hosting options also matter for high-scale enterprises.
4. Compliance & Data Residency
Enterprises in finance, healthcare, or government need GDPR, HIPAA, or SOC 2. Check if the tool offers compliance coverage and lets you control where data is stored.
5. Ease of Deployment & Support
Some tools demand steep learning curves (Dynatrace, Elastic), while others provide plug-and-play OTEL collectors and strong documentation (CubeAPM, New Relic).
Conclusion
APM tools remain critical as applications grow more distributed. While legacy vendors like Datadog, New Relic, Dynatrace, and Splunk provide powerful features, their pricing complexity and scaling costs often frustrate teams.
CubeAPM emerges as the best balance: OpenTelemetry-native, transparent pricing ($0.15/GB), full MELT support, and predictable scaling.
Disclaimer: The information in this article reflects the latest details available at the time of publication and may change as technologies and products evolve.
FAQs
1. What is an APM tool and why is it important?
An Application Performance Monitoring (APM) tool tracks app health through response time, error rate, throughput, logs, and traces, helping teams detect bottlenecks before they impact users.
2. Why are teams moving away from Datadog or New Relic?
High per-host and add-on fees cause unpredictable bills. Many teams prefer usage-based pricing (e.g., $/GB) for cost control.
3. Which APM tool is most cost-effective for scaling SaaS companies?
CubeAPM is one of the most cost-predictable at $0.15/GB ingested, avoiding per-host or retention penalties, making it 3–4× cheaper at scale.
4. Do APM tools support OpenTelemetry (OTEL)?
Yes, but support varies. CubeAPM and Dynatrace are OTEL-native, while others like Datadog and New Relic provide partial OTEL support but push for proprietary agents.
5. How do I decide between self-hosted and cloud APM?
Self-hosted APM (like CubeAPM, Elastic) is ideal for teams needing data control and compliance. Cloud APM (like Datadog, Splunk) suits teams that prioritize ease of setup but accept higher ongoing costs.


