










Without test observability, a flaky CI run that fails intermittently for three days becomes engineering folklore. With test observability, the same failure surfaces as a correlated pattern: fixture timeout on worker 4, linked to database connection pool exhaustion, reproducible in 8 of 12 runs, fixed by raising the pool limit from 10 to 20. Test observability is the practice of instrumenting the test suite itself with traces, logs, and metrics so teams can explain why tests are slow, noisy, or flaky rather than just marking them as skipped and moving on.
According to the 2024 State of DevOps Report, elite performers deploy 973 times more frequently than low performers, but this speed depends on test suites that give fast, clear signals. When a test suite becomes a black box that occasionally fails for unknown reasons, deployment confidence drops, and teams start bypassing tests entirely or running them only on main branch merges. Test observability changes this by treating the test execution pipeline as a production system worth monitoring with the same rigor applied to application performance monitoring or infrastructure health checks.
What Is Test Observability?
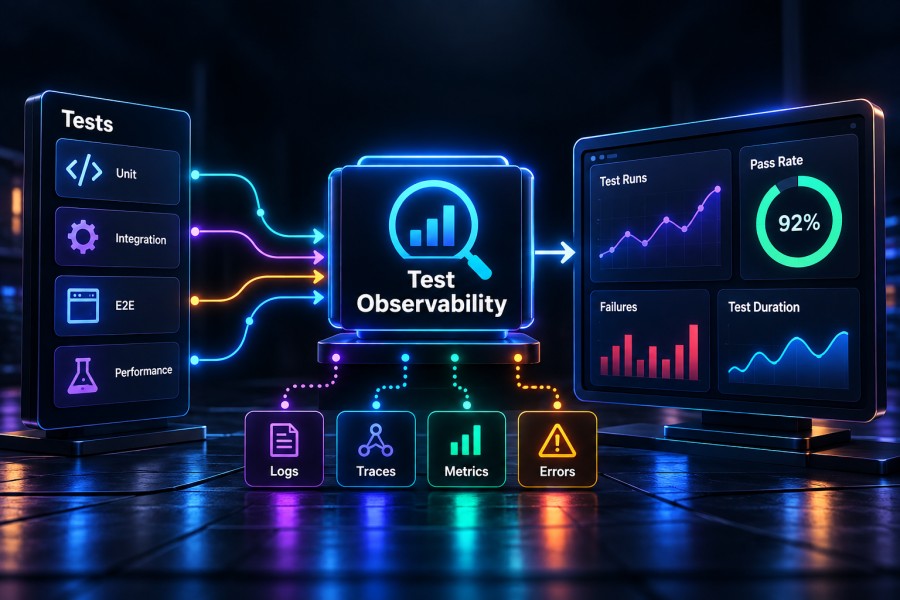
Test observability is the instrumentation of test execution workflows with telemetry signals, traces, structured logs, and performance metrics, so teams can diagnose test failures, understand test performance trends, and correlate flaky behavior with environmental or code changes. It is not test automation or continuous integration monitoring. Test automation runs the tests. CI monitoring tracks pipeline success rates. Test observability answers the deeper question: when a test fails or takes 3x longer than yesterday, what specifically changed and where in the stack did it break?
A test suite without observability produces binary outcomes: pass or fail, green or red. A test suite with observability produces evidence: this API test retried four times before succeeding, the retry delay pattern matches production timeout behavior on the auth service, the failure started after commit abc123 changed the connection pool settings, and the same test passed on worker 1 but failed on worker 3, which was under CPU load from a parallel job.
Test observability instruments five core areas of test execution: fixture setup and teardown, test runtime and retry behavior, test worker resource usage, test data generation and cleanup, and correlation between test results and application telemetry. This instrumentation happens at multiple layers. At the test runner level, it captures test start, end, duration, and outcome. At the fixture level, it tracks login flows, database seeding, mock server startup, and artifact uploads. At the infrastructure level, it correlates test runs with CI runner CPU, memory, network latency, and disk I/O. At the application level, it links test failures to actual errors or performance degradations in the code under test.
The output of test observability is not more dashboards. The output is faster root cause analysis when a test breaks, clearer signals when deciding whether to trust a flaky result, and actionable data for deciding which tests to fix, skip, or rewrite. It means a senior SDET can look at a dashboard and say: the checkout test suite got 40% slower this month because login fixture duration doubled, and login fixture duration doubled because the auth service now enforces rate limits in staging, and we never accounted for that in our test wait logic.
Why Test Observability Matters in 2026
Test observability matters because test suites have become production systems in their own right, running thousands of times per day, consuming significant CI resources, and directly gating release velocity. When a test suite is fast and deterministic, teams ship confidently. When a test suite is slow, flaky, or noisy, teams either bypass tests or waste hours debugging failures that do not represent real bugs. According to the 2024 Accelerate State of DevOps Report, elite performers have change failure rates below 5% and can restore service in under an hour, but these outcomes depend on test suites that surface real issues without false positives.
The shift to microservices and distributed systems has made test flakiness more common. A test that calls three services and a database now has four failure points instead of one. Network flakiness, race conditions, timing issues, resource contention, and environment drift all create intermittent failures that are hard to reproduce locally. Without observability, these failures get labeled as flaky, retried automatically, and ignored until they start failing consistently. With observability, the same failures get traced to specific causes: the auth service returned 503 under load, the database connection pool was exhausted, or the test fixture did not wait for an async operation to complete.
CI costs are rising as teams run more tests more frequently. A medium-sized engineering team might run 10,000 tests per day across 50 pull requests, consuming hundreds of CI runner hours per month. When test suites get slower, CI costs increase linearly. When tests become flaky and need retries, costs increase further. Test observability surfaces which tests are expensive, which ones retry frequently, and which ones contribute the most to overall suite runtime. This data drives decisions about which tests to optimize, parallelize, or move to nightly runs instead of running on every commit.
Debugging flaky tests without observability is folklore-driven guesswork. A developer sees a test fail, reruns it manually, sees it pass, and concludes it was a flake. The test fails again three days later on a different pull request. Another developer reruns it, it passes, and the pattern repeats. No one investigates because the failure is intermittent and unreproducible. With observability, the pattern becomes data: this test fails 15% of the time when run on worker 3, always during peak CI load hours, always with a timeout error, and always when the upstream auth service is under load. That data turns a mystery into a fix: increase the timeout or reduce test concurrency during peak hours.
Deployment confidence depends on test signal quality. If a test suite produces too many false positives, teams stop trusting it and start deploying without waiting for CI. If a test suite misses real regressions, teams lose confidence in the release process and slow down deployments. Test observability improves signal quality by surfacing which tests are noisy, which ones catch real bugs, and which ones fail due to environmental issues unrelated to code changes. This feedback loop helps teams maintain test suites that actually protect production.
Test observability also supports regulatory and compliance requirements in industries where test evidence must be retained and auditable. Healthcare, finance, and government teams often need to prove that specific tests ran, passed, and covered specific requirements. Observability platforms that store test traces with full retention provide this audit trail without requiring teams to build custom test reporting pipelines.
How Test Observability Works
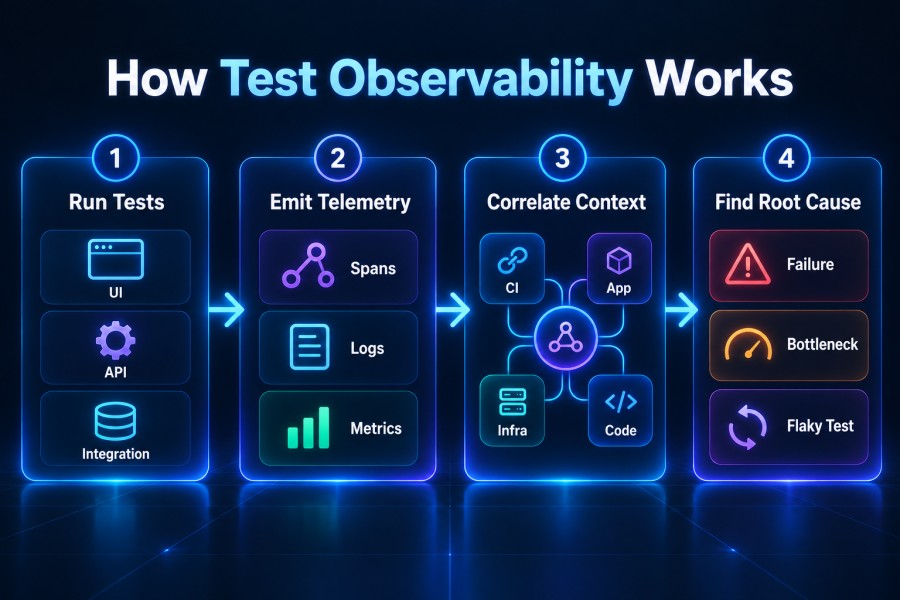
Test observability works by emitting telemetry from the test execution layer, not just from the application under test. Most teams already instrument their production applications with distributed tracing and log management, but the test suite itself runs uninstrumented, which means failures produce a stack trace or error message with no broader context about what else was happening during the run.
The workflow begins with adding spans to expensive or failure-prone test operations. A span is a unit of work with a start time, end time, and metadata. For test observability, spans should wrap fixture setup, API calls made during test execution, database transactions, external service interactions, and artifact generation. Each span includes attributes such as test file path, worker ID, environment name, git commit SHA, retry count, and pass or fail status. When a test fails, the span hierarchy shows exactly which operation failed and how long each step took.
Structured logs complement spans by capturing events that spans do not cover: locator failures in UI tests, console errors in browser tests, network errors during API calls, retry logic execution, and test data IDs. Unlike printf-style logs that dump unstructured text, structured logs use key-value pairs that can be queried and filtered. A structured log for a failed login fixture might include keys like fixture_name, user_id, environment, response_code, error_message, retry_attempt, and timestamp. This makes it possible to query all login failures in the last week, grouped by response code, filtered by environment equals staging.
Metrics track aggregate behavior over time: test suite duration, individual test duration percentiles, retry rate, failure rate, flaky test percentage, artifact upload time, worker CPU and memory usage, and queue wait time before a test starts. Metrics answer questions like: is the suite getting slower, are retries increasing, which tests are the slowest, and which workers are under resource pressure? Metrics are lower resolution than spans and logs but are cheaper to store and faster to query for trend analysis.
Correlation ties everything together. Test observability platforms correlate test failures with CI runner resource pressure, application errors logged during the test run, recent code changes, recent deployment events, and infrastructure changes. For example, a test that fails with a database timeout can be correlated with a spike in database connection pool exhaustion logged by the application under test during the same time window. This correlation surfaces root causes that are invisible when looking at test results in isolation.
The technical implementation typically uses OpenTelemetry or a vendor-specific SDK to emit spans and logs from the test runner. For Playwright, Cypress, Selenium, or Jest, this means wrapping test setup code, fixtures, and hooks with tracing instrumentation. For API tests in Postman, RestAssured, or Python requests, it means emitting spans for each HTTP call and logging request and response details. The telemetry is sent to an observability backend, CubeAPM, Datadog, Honeycomb, Grafana Tempo, or a self-hosted OpenTelemetry collector, where it is indexed, queried, and visualized.
Core Components of Test Observability
Test observability is built on five technical components: distributed tracing of test execution, structured logging of test events, metrics collection across test runs, infrastructure correlation, and root cause analysis dashboards. Each component solves a specific part of the test debugging problem.
Distributed Tracing for Test Execution
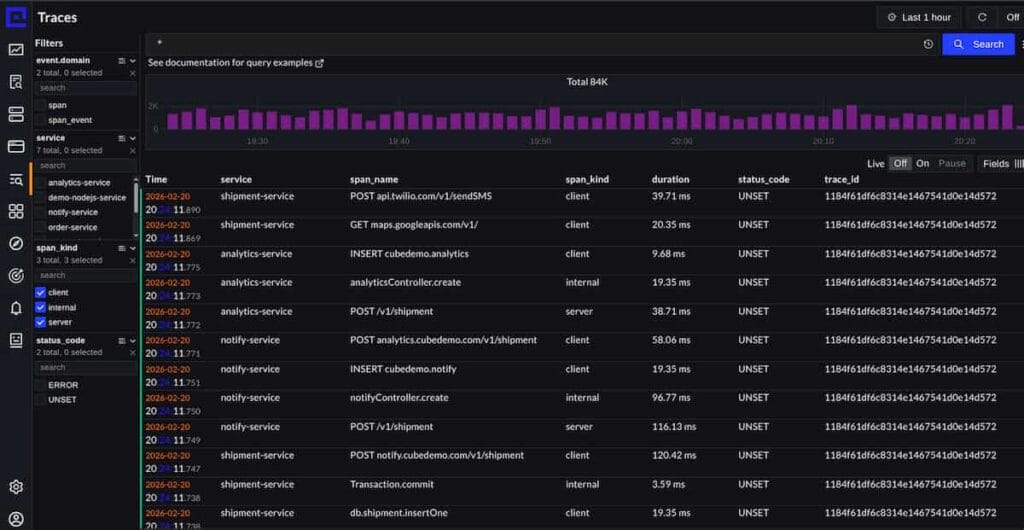
Distributed tracing instruments the test suite with spans that represent each unit of work: fixture setup, test execution, API calls, database queries, and cleanup. A span has a start time, end time, duration, status, and metadata. Spans are organized into traces, which represent the full execution path of a single test from start to finish. For a UI test that logs in, navigates to a page, fills a form, and submits, the trace would include spans for each step. When the test fails, the trace shows which span failed and how long each preceding span took.
Tracing makes it possible to answer questions like: how long does the login fixture take on average, which API call is the slowest, do retries add significant overhead, and does test duration vary by CI worker? Tracing also enables comparison: this test took 12 seconds yesterday but 45 seconds today, and the trace shows that the database seeding step took 35 seconds instead of the usual 3 seconds, pointing to a database performance issue.
OpenTelemetry is the standard protocol for distributed tracing. Test frameworks like Playwright, Cypress, and pytest can be instrumented with OpenTelemetry SDKs to emit spans. These spans are sent to an observability backend like CubeAPM, which indexes them and makes them searchable. The backend provides a trace view that visualizes the span hierarchy as a timeline, showing which operations ran in parallel, which ones blocked others, and where failures occurred.
Structured Logging of Test Events
Structured logs capture events that are not well represented as spans: locator failures, console errors, retry logic, network errors, and test data generation. Unlike plain text logs, structured logs use key value pairs that can be filtered and aggregated. A structured log entry for a failed API call might look like: {"event": "api_call_failed", "method": "POST", "url": "/api/checkout", "status_code": 503, "retry_attempt": 2, "test_id": "checkout_flow", "worker_id": "worker_3", "timestamp": "2026-01-15T10:23:45Z"}. This format allows querying all 503 errors, filtering by test ID, grouping by worker, and correlating with trace data.
Logs are critical for debugging flaky tests because they capture the exact sequence of events leading to a failure. When a test fails intermittently, the logs from failed runs can be compared to logs from successful runs to identify differences. For example, a flaky test might show that failed runs always include a connection_timeout log entry, while successful runs do not, pointing to a network or service availability issue.
Log volumes from test suites can be high, especially for UI tests that log every browser interaction. Observability platforms handle this by indexing logs with metadata and supporting fast full-text search. This makes it practical to store all logs from all test runs and search them later when debugging a failure.
Metrics Collection Across Test Runs
Metrics aggregate test behavior over time: test suite duration, test pass rate, retry rate, flaky test percentage, and per-test duration percentiles. Metrics are lower resolution than traces and logs but are faster to query and cheaper to store for long periods. A metrics dashboard might show: total test suite runtime increased 30% this month, the checkout test has a 15% retry rate, and 5% of tests are currently marked flaky.
Metrics are useful for spotting trends that would be hard to see in individual traces. For example, if test suite duration gradually increases over six months, that trend is clear in a metrics chart but would not be obvious from looking at individual test traces. Metrics also support alerting: if test suite runtime exceeds a threshold, if retry rate spikes, or if a specific test starts failing more than 10% of the time, the system can send an alert to the team.
Metrics should be broken down by dimensions like test file, test name, CI environment, git branch, and worker ID. This granularity makes it possible to identify which tests are contributing to slowness, which branches have higher failure rates, and which workers are under resource pressure.
Infrastructure Correlation
Test failures are often caused by infrastructure issues, not code bugs: CI runner out of memory, network latency to external services, database connection pool exhaustion, or disk I/O saturation. Infrastructure correlation links test failures to infrastructure metrics collected from the CI runner or the environment where the application under test is running. For example, a test that times out during database seeding can be correlated with a spike in database CPU usage or connection pool saturation.
This correlation requires collecting infrastructure metrics alongside test telemetry. For CI runners, this means tracking CPU, memory, disk I/O, and network latency. For the application under test, this means infrastructure monitoring for databases, APIs, and external services. When a test fails, the observability platform overlays infrastructure metrics onto the test trace timeline, making it possible to see if the failure coincided with resource pressure.
Infrastructure correlation is especially important for flaky tests. A test that fails only under high CI load is not flaky in the traditional sense; it is revealing a real concurrency or resource contention issue that also affects production. Identifying this pattern helps teams decide whether to fix the test, reduce concurrency, or increase infrastructure capacity.
Root Cause Analysis Dashboards
Root cause analysis dashboards aggregate traces, logs, and metrics to answer specific debugging questions: which tests are failing most frequently, what are the common error messages, which fixtures are slowest, do failures cluster by worker or environment, and did failures spike after a specific code change? These dashboards are purpose-built for test debugging, not general observability. They assume the user wants to answer: why is this test flaky, not what is wrong with my production system.
A well-designed root cause analysis dashboard surfaces patterns automatically. For example, it might show that 80% of failures in the last week occurred on worker 3, or that all failures of the checkout test include the error message connection refused, or that login fixture duration doubled after commit abc123. These patterns guide the investigation, turning a vague flaky test report into a specific hypothesis that can be tested and fixed.
Dashboards should also support ad-hoc exploration: filtering by test name, environment, time range, pass or fail status, and custom metadata. This flexibility allows teams to drill down into specific failure patterns without writing custom queries.
Best Practices for Implementing Test Observability
Implementing test observability is an instrumentation and workflow problem, not a tool selection problem. The tools are secondary to the questions you want to answer and the signals you choose to capture. Teams that succeed with test observability follow a few core practices: start with expensive fixtures, emit structured logs for retries and failures, track per-test duration trends, correlate failures with infrastructure load, and build dashboards around debugging workflows.
Start with Expensive Fixtures
The highest value instrumentation target is expensive fixtures: login flows, database seeding, environment setup, external service mocks, and artifact uploads. These operations often account for 50% or more of total test suite runtime, and they are common sources of flakiness. Wrapping them with spans immediately surfaces how long they take, whether they vary by environment, and whether they fail intermittently.
A practical starting point is to add spans to every fixture that takes longer than one second or that makes network calls. This requires minimal code changes and provides immediate visibility into where time is spent. For example, a login fixture that sets up user credentials, logs in via API, and stores a session token can be instrumented with three spans: create_user, login_api_call, and store_session. When the fixture fails, the spans show which step failed.
Emit Structured Logs for Retries and Failures
Retries are a common anti-pattern in flaky test suites: a test fails, the framework retries it automatically, it passes on the second attempt, and no one investigates. Structured logs for retries surface this hidden flakiness. Each retry should log the retry count, the error that triggered the retry, and the final outcome. This log data can be aggregated to calculate retry rates per test, identify tests that retry most frequently, and correlate retries with environmental factors like time of day or CI load.
Failures should log the full context: error message, stack trace, test data IDs, environment variables, and any relevant application logs from the same time window. This context makes it possible to reproduce the failure locally or in a staging environment.
Track Per-Test Duration Trends
Per-test duration trends reveal performance regressions before they become blocking issues. A test that takes 10 seconds this week but took 6 seconds last month is a signal that something changed: the code under test got slower, the test fixture got heavier, or the CI environment changed. Tracking duration percentiles (p50, p95, p99) is more useful than tracking averages because it surfaces outliers and variance.
Duration trends should be visualized per test, not just for the full suite. A suite-level duration chart shows that the suite got slower, but it does not show which tests are responsible. A per-test duration chart shows exactly which tests are contributing to the slowdown and helps prioritize optimization work.
Correlate Failures with Infrastructure Load
Test failures that occur only during high CI load or only on specific workers are often infrastructure-related, not code-related. Correlating failures with CI runner CPU, memory, network latency, and disk I/O makes this pattern visible. For example, a test that fails when CI runner CPU exceeds 80% is revealing a resource contention issue that might also affect production under load.
This correlation requires collecting infrastructure metrics from CI runners and overlaying them onto test failure timelines. When a test fails, the dashboard should show whether the failure coincided with high CPU, memory pressure, or network latency. If it did, the fix is often to reduce test concurrency, increase runner resources, or move resource-intensive tests to dedicated runners.
Build Dashboards Around Debugging Workflows
Dashboards should answer specific debugging questions, not display all available data. A flaky test dashboard should show: which tests fail intermittently, what is the failure rate per test, what are the most common error messages, and do failures cluster by time of day, environment, or worker? A performance dashboard should show: which tests are slowest, which fixtures account for the most runtime, and how has suite duration changed over time?
Each dashboard should support drill-down: clicking on a failed test should jump to a list of all failed runs, clicking on a failed run should jump to the trace and logs for that run, and clicking on a slow fixture should show its duration trend over time. This workflow makes it possible to go from summary to evidence in three clicks.
Tools and Implementation: Test Observability Platforms in 2026
Test observability can be implemented with OpenTelemetry and an observability backend, a dedicated test observability platform, or a hybrid approach that combines both. The choice depends on whether you want to build instrumentation yourself or adopt a vendor solution that instruments tests automatically.
OpenTelemetry and CubeAPM
OpenTelemetry is the open standard for distributed tracing and structured logging. It provides SDKs for instrumenting test frameworks and exporters for sending telemetry to observability backends. For test observability, this means adding OpenTelemetry spans and logs to your test runner, fixtures, and API call libraries. The telemetry is exported to an OpenTelemetry-compatible backend like CubeAPM, which indexes it and makes it searchable.
CubeAPM offers full-stack observability with APM, log management, and infrastructure monitoring in one platform. For test observability, CubeAPM ingests OpenTelemetry traces and logs from test runs, correlates them with application telemetry from the code under test, and provides dashboards for debugging flaky tests. The pricing model is simple: $0.15/GB of data ingested, with unlimited retention and no per-seat fees. For a team ingesting 500 GB of test telemetry per month, that is $75 per month total.
CubeAPM runs inside your own cloud or data center, which means test telemetry does not leave your infrastructure. This matters for teams with data residency or compliance requirements. The platform supports OpenTelemetry natively, so instrumentation is portable: if you later switch to a different backend, the instrumentation code does not change.
BrowserStack Test Observability
BrowserStack offers a dedicated test observability product that instruments Selenium, Playwright, and Appium tests automatically. It captures test runs, screenshots, video recordings, network logs, and console logs without requiring manual instrumentation. The platform provides dashboards for flaky tests, failure trends, and test duration. Pricing is per test run, which can become expensive for teams with large test suites.
BrowserStack Test Observability is useful for teams that want to adopt test observability without writing instrumentation code. The tradeoff is vendor lock-in: the telemetry is proprietary and cannot be exported to another backend.
Datadog CI Visibility
Datadog offers CI Visibility as part of its observability platform. It instruments CI pipelines and test runs, correlating test failures with application traces and infrastructure metrics. Datadog’s pricing model is per-host and per-test run, which can add up quickly for teams running thousands of tests per day.
Datadog CI Visibility is a good choice for teams already using Datadog for application monitoring. The integration is seamless, and test telemetry is correlated with application and infrastructure telemetry automatically. The downside is cost: Datadog’s pricing model is complex, and CI Visibility adds another billing dimension.
Honeycomb for Test Observability

Honeycomb is a high-cardinality observability platform that supports test observability through OpenTelemetry instrumentation. Teams instrument test runners with OpenTelemetry spans and send the data to Honeycomb, where it can be queried with Honeycomb’s flexible query language. Honeycomb excels at debugging flaky tests because it supports querying and grouping by any field in the span metadata.
Honeycomb’s pricing is based on event volume, not data volume, which can be favorable for test workloads that generate many small events. The platform is SaaS only, so test telemetry leaves your infrastructure.
Grafana with Loki and Tempo
Grafana can be used for test observability by combining Loki for logs, Tempo for traces, and Prometheus for metrics. This is a self-hosted open-source stack that gives teams full control over data retention and costs. The tradeoff is operational overhead: teams must run and maintain Loki, Tempo, and Prometheus themselves, and integrating the three systems requires custom configuration.
This approach is best for teams with existing Grafana infrastructure who want to avoid vendor lock-in and are comfortable with the operational complexity.
Migrating to Test Observability: Where to Start
Migrating to test observability does not require rewriting your test suite. Start by instrumenting one high-value area, validating that the telemetry is useful, and expanding incrementally. The goal is to answer one debugging question faster, not to instrument everything at once.
Step 1: Choose One Expensive Test or Fixture
Start with the test or fixture that causes the most debugging pain: the one that fails intermittently, takes too long, or blocks deployments when it fails. Instrument that test with spans and structured logs. Emit spans for each major operation: setup, execution, teardown. Emit logs for retries, errors, and test data IDs. Send the telemetry to an observability backend and build a simple dashboard that shows test duration, failure rate, and retry count.
This first instrumentation should take less than a day and should immediately surface patterns that were invisible before. For example, if the login fixture fails intermittently, the spans might show that failures always occur when the fixture takes longer than 10 seconds, and the logs might show that long fixture runs coincide with high database connection pool usage.
Step 2: Validate That the Telemetry Answers Debugging Questions
Before instrumenting more tests, validate that the telemetry is useful. Can you use the traces and logs to diagnose a flaky test faster than you could without them? Can you identify which step in the test is slow? Can you correlate failures with infrastructure load or code changes? If the answer is yes, expand the instrumentation to more tests. If the answer is no, adjust what you are capturing.
The most common mistake in test observability is capturing too much low-value telemetry and not enough high-value context. Low-value telemetry includes logs that repeat the same information in every test run. High-value context includes test data IDs, retry counts, error messages, and correlation with application or infrastructure events.
Step 3: Expand to the Full Test Suite
Once the instrumentation pattern is proven, expand it to the full test suite. This can be automated by wrapping test runners, fixtures, and API call libraries with OpenTelemetry instrumentation. For example, a Playwright test suite can be instrumented by adding an OpenTelemetry plugin that automatically wraps every test with a span and logs every locator failure.
Expanding to the full suite makes it possible to build dashboards that show suite-level trends: total duration, pass rate, retry rate, and flaky test percentage. These dashboards help teams prioritize which tests to optimize or fix.
Step 4: Correlate with Application and Infrastructure Telemetry
The final step is to correlate test telemetry with application and infrastructure telemetry. When a test fails, the dashboard should show whether the failure coincided with an error in the application under test, a spike in database latency, or high CPU usage on the CI runner. This correlation requires integrating the test observability backend with your application performance monitoring and infrastructure monitoring systems.
For teams using CubeAPM, this integration is automatic because CubeAPM already collects application and infrastructure telemetry. For teams using other backends, correlation requires configuring trace context propagation so that test spans are linked to application spans.
Conclusion
Test observability transforms test suites from black boxes into instrumented systems that explain their own behavior. It answers the questions that matter most to teams shipping software: why did this test fail, why is the suite slower this week, which tests are flaky, and can we trust this CI run? Without observability, these questions are answered through guesswork, manual reruns, and folklore. With observability, they are answered through data, traces, and correlation.
The best time to adopt test observability is before your test suite becomes a bottleneck. If tests are already flaky, slow, or unreliable, observability provides the data needed to fix them. If tests are fast and reliable, observability keeps them that way by surfacing regressions early. The investment is low, a few hours of instrumentation work, and the payoff is high: faster debugging, fewer false positives, and deployment confidence that is backed by evidence instead of hope.
Disclaimer: The information in this article reflects the latest details available at the time of publication and may change as technologies and products evolve. Features, pricing, and plan limits can change over time. Always verify the latest information directly with the vendor before making purchasing or deployment decisions. This review is based on CubeAPM’s independent research and analysis and does not constitute an official audit or endorsement. This article is intended for informational purposes only and is not meant to disparage any individual, company, or product. We encourage readers to verify current details directly with the relevant providers before making any decisions.
Frequently Asked Questions
What is test observability and how is it different from test automation?
Test automation runs tests automatically. Test observability instruments the test suite with traces, logs, and metrics so you can diagnose why tests fail, retry, or slow down. Automation tells you the outcome; observability tells you the cause.
Why do I need test observability if my CI pipeline already tracks pass/fail rates?
Pass/fail rates tell you that a test failed, not why it failed or whether the failure is meaningful. Test observability surfaces the root cause: which fixture timed out, which API returned an error, which worker was under load, or whether the failure is a flake.
How much does test observability cost?
Cost depends on the platform. CubeAPM charges $0.20/GB of telemetry ingested with no per-seat or per-run fees. BrowserStack and Datadog charge per test run or per host, which can add up quickly for large test suites. OpenTelemetry with a self-hosted backend has no software cost but requires infrastructure.
Can I use OpenTelemetry for test observability?
Yes. OpenTelemetry provides SDKs for instrumenting test frameworks with spans and structured logs. You emit telemetry from your test runner and send it to any OpenTelemetry-compatible backend like CubeAPM, Honeycomb, or Grafana Tempo.
What should I instrument first when adding test observability?
Start with the fixtures or tests that cause the most debugging pain: the ones that fail intermittently, take too long, or block deployments. Instrument them with spans and logs, validate that the telemetry helps you debug faster, then expand to the rest of the suite.
How does test observability help with flaky tests?
Test observability captures the context around flaky test failures: retry counts, error messages, test data IDs, worker load, and infrastructure metrics. This context reveals patterns like: this test always fails on worker 3, or failures coincide with database connection pool exhaustion, or the fixture times out under high CPU load.
Does test observability work for UI tests, API tests, and unit tests?
Yes. Test observability instruments the test execution layer, not the type of test. UI tests can emit spans for browser interactions and page loads. API tests can emit spans for HTTP calls. Unit tests can emit spans for expensive setup or teardown operations.