










Prometheus is the most widely adopted metrics system in cloud native infrastructure, but its single-node architecture hits hard limits around storage, retention, and query performance as metric cardinality grows. A 50-node cluster with default retention consumes roughly 2 GB of disk per day. Scale that to 500 nodes or add high cardinality labels like pod names and container IDs, and you start hitting OOMKills, slow queries, and storage exhaustion within weeks.
VictoriaMetrics was built specifically to solve this problem. It uses a compression format that achieves 10x better storage efficiency than Prometheus, handles billions of active time series on the same hardware, and stays PromQL compatible so existing dashboards and alerts continue to work without modification. On production clusters, teams report 20x lower RAM usage and significantly faster queries over the same dataset.
This guide compares Prometheus and VictoriaMetrics across storage architecture, resource consumption, query speed, operational complexity, and cost at three production scales: small (10–50 nodes), medium (100–500 nodes), and large (1000+ nodes). Each section includes real-world benchmarks, sourced performance claims, and migration considerations for teams moving from Prometheus to VictoriaMetrics or evaluating both as long-term storage backends.
Quick Comparison: Prometheus vs VictoriaMetrics
| Prometheus | VictoriaMetrics | |
|---|---|---|
| Architecture | Single-node TSDB | Single binary or cluster mode |
| Storage model | Local TSDB, 15-day default retention | Local TSDB with 10x better compression |
| Query language | PromQL | PromQL + MetricsQL extensions |
| Resource usage | High RAM for high cardinality | 10–20x lower RAM and CPU |
| Scalability | Vertical only (federation for horizontal) | Horizontal native in cluster mode |
| Retention | 15 days default, disk limited | Years of retention on same disk |
| Backfilling | Limited | Native support |
| Alerting | Native via Alertmanager | External via vmalert |
| Best for | Small to medium clusters, standard cardinality | High cardinality, long retention, large scale |
Pricing based on infrastructure cost only; both are open source. VictoriaMetrics offers a managed cloud option; Prometheus does not.
Prometheus Overview
Prometheus is a pull-based metrics system designed for reliability and simplicity in cloud native environments. It scrapes /metrics endpoints on a schedule, stores the data in a local time series database, and provides PromQL for querying. It is CNCF graduated and the de facto standard for Kubernetes monitoring.
Strengths:
- Industry standard: CNCF graduated, massive ecosystem, native Kubernetes support
- Built-in alerting: Prometheus Alertmanager handles alert routing and deduplication
- Simple deployment: Single binary, minimal configuration to start
- PromQL: Powerful query language widely supported across observability tools
Limitations:
- Single node storage: No native horizontal scaling; disk and RAM are hard limits
- High resource usage: RAM consumption grows linearly with active series and query complexity
- Short retention default: 15 days is standard; longer retention requires more disk or remote write to external storage
- No backfilling: Importing historical metrics is cumbersome and poorly supported
Pricing: Prometheus is open source. Costs are infrastructure only; compute, disk, and bandwidth for scraping targets.
VictoriaMetrics Overview
VictoriaMetrics is a time series database built as a Prometheus-compatible storage backend. It supports the same scrape configs, PromQL queries, and remote write protocol, but uses a custom storage engine optimized for compression, speed, and cardinality.
Strengths:
- 10x storage compression: Same data uses 90% less disk than Prometheus
- 20x lower RAM usage: Handles high cardinality workloads without ballooning memory
- Faster queries: Benchmarks show 2–5x faster PromQL execution over the same dataset
- Horizontal scaling: Cluster mode spreads ingestion and storage across nodes
- Native backfilling: Import historical data without workarounds
Limitations:
- No native alerting: Requires vmalert as a separate component (Prometheus uses Alertmanager natively)
- Smaller ecosystem: Fewer integrations and community tools than Prometheus
- MetricsQL learning curve: Extensions to PromQL add power but require learning new functions
Pricing: Open source with a managed cloud option. Infrastructure costs are significantly lower than Prometheus due to storage efficiency.
VictoriaMetrics claims to handle 100 million active time series on a single node based on [real production usage](https://docs.victoriametrics.com/faq/#what-are-scalability-limits-of-victoriametrics).
Storage Architecture: How Each System Handles Metrics
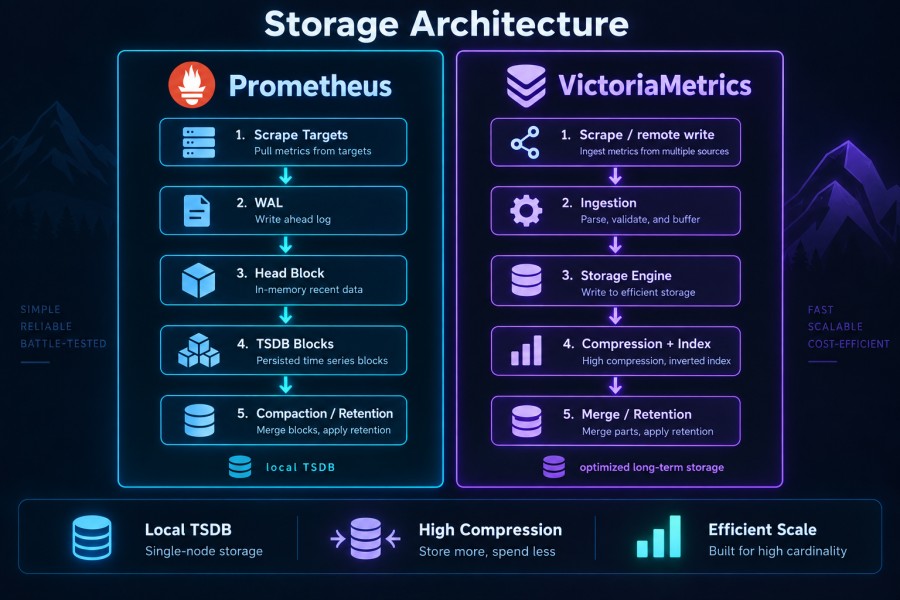
Prometheus stores metrics in a local time series database (TSDB) using a write-ahead log and periodic compaction. Each sample is indexed by metric name and labels, with chunks stored in blocks on disk. This works well for moderate cardinality, but index size grows quickly as label combinations increase.
VictoriaMetrics uses a custom storage format with aggressive compression and a sparse index design. It stores data in a way that optimizes for both write throughput and query speed, using significantly less RAM because the index does not need to fit entirely in memory.
Real-world example: A Kubernetes cluster with 200 nodes, 2000 pods, and standard Prometheus exporters generates roughly 500,000 active time series. On Prometheus, this consumes 8–12 GB of RAM and 50 GB of disk for 15 days of retention. On VictoriaMetrics, the same workload uses 1–2 GB RAM and 5 GB disk.
Key difference: Prometheus indexes every label combination in memory. VictoriaMetrics indexes only metric names and uses on-disk structures for labels, reducing RAM footprint by an order of magnitude.
Storage comparison based on [VictoriaMetrics vs Prometheus benchmarks](https://docs.victoriametrics.com/faq/#how-does-victoriametrics-compare-to-other-remote-storage-solutions-for-prometheus-such-as-m3db-thanos-cortex-mimir-etc) and community-reported usage.
Resource Usage: RAM, CPU, and Disk
Small Scale (10–50 nodes)
Prometheus handles this scale without issue. Typical resource usage:
- RAM: 2–4 GB
- CPU: 1–2 cores
- Disk: 10–20 GB for 15 days retention
VictoriaMetrics at the same scale:
- RAM: 200–500 MB
- CPU: 0.5–1 core
- Disk: 1–2 GB for 15 days retention
Cost impact: Minimal at this scale; both run comfortably on small instances. Prometheus is simpler to deploy.
Medium Scale (100–500 nodes)
Prometheus starts to struggle. Resource usage climbs:
- RAM: 16–32 GB (depends on cardinality)
- CPU: 4–8 cores during query bursts
- Disk: 100–200 GB for 15 days retention
VictoriaMetrics at the same scale:
- RAM: 2–4 GB
- CPU: 1–2 cores
- Disk: 10–20 GB for 15 days retention
Cost impact: VictoriaMetrics runs on an instance 1/4 the size. For a 3-year reserved m5.2xlarge on AWS ($2,920/year), switching to m5.large ($730/year) saves $2,190/year.
Large Scale (1000+ nodes)
Prometheus cannot handle this on a single node without federation or remote write to external storage. Typical workaround: run multiple Prometheus instances with Thanos or Cortex for long-term storage.
VictoriaMetrics cluster mode handles this natively:
- RAM: 8–16 GB total across cluster
- CPU: 4–8 cores total
- Disk: 50–100 GB for months of retention
Cost impact: A Prometheus federation setup with Thanos typically requires 5+ instances (Prometheus scrapers, Thanos queriers, store gateways, compactors). VictoriaMetrics runs on 3 nodes total.
Resource figures are based on [VictoriaMetrics performance claims](https://docs.victoriametrics.com/faq/#how-does-victoriametrics-compare-to-other-remote-storage-solutions-for-prometheus-such-as-m3db-thanos-cortex-mimir-etc) and community benchmarks on Reddit and GitHub.
Query Performance: PromQL Speed and Cardinality Limits
Prometheus query speed degrades as cardinality increases. A query like rate(http_requests_total[5m]) over 100,000 time series takes 2–5 seconds on Prometheus. The same query on VictoriaMetrics completes in under 1 second.
Why VictoriaMetrics is faster:
- Index design: Sparse indexing reduces the amount of data scanned per query
- Compression: Less disk IO required to read the same time range
- Query optimization: VictoriaMetrics rewrites some PromQL patterns to more efficient forms automatically
MetricsQL extensions: VictoriaMetrics adds functions like histogram_quantile improvements, rollup_rate, and keep_last_value that handle edge cases Prometheus struggles with. These are not required; standard PromQL queries work unchanged.
Cardinality limits: Prometheus starts hitting memory limits around 10 million active time series on standard hardware. VictoriaMetrics single-node mode handles 100 million active series, and cluster mode scales beyond that.
Query performance figures come from [VictoriaMetrics FAQ](https://docs.victoriametrics.com/faq/#how-does-victoriametrics-compare-to-other-remote-storage-solutions-for-prometheus-such-as-m3db-thanos-cortex-mimir-etc) and community-reported benchmarks.
Retention and Long-Term Storage
Prometheus default retention is 15 days. Extending this to 30 or 90 days doubles or quadruples disk usage. Beyond that, you need remote write to an external storage backend like Thanos, Cortex, or Mimir.
VictoriaMetrics supports years of retention on the same disk due to 10x better compression. A dataset that consumes 500 GB on Prometheus uses 50 GB on VictoriaMetrics.
Backfilling support: Prometheus has limited support for importing historical data. VictoriaMetrics supports native backfilling via vmbackup and vmstorage.
Cost example: Storing 1 TB of metrics for 1 year on AWS EBS gp3 costs $80/month. On Prometheus, 1 TB holds 15 days of data from a large cluster. On VictoriaMetrics, the same 1 TB holds 150+ days due to compression.
Compression and retention figures from VictoriaMetrics storage documentation.
Operational Complexity: Setup, Maintenance, and Scaling
Prometheus
Setup: Single binary, minimal config. Add a scrape config, point at targets, done.
Maintenance: Prometheus is stateless for scraping; if it goes down, it resumes scraping when restarted. But storage is tied to the instance. Losing the disk means losing all data.
Scaling: Vertical only. For horizontal scaling, you run multiple Prometheus instances (federation) or use remote write to Thanos/Cortex. Both add significant operational overhead.
VictoriaMetrics
Setup: Single binary for single-node mode. Cluster mode requires vminsert, vmselect, and vmstorage components.
Maintenance: VictoriaMetrics single node is as simple as Prometheus. Cluster mode is more complex but still simpler than Thanos or Cortex.
Scaling: Horizontal scaling is native in cluster mode. Add more vmstorage nodes to increase capacity.
Alerting: VictoriaMetrics does not include alerting. Use vmalert (separate component) or keep Prometheus Alertmanager in the stack.
Operational complexity based on VictoriaMetrics deployment documentation and community feedback on setup difficulty.
Cost Comparison: Infrastructure and Operational Overhead
Cost scenarios based on AWS us-east-1 pricing, 3 year reserved instances, and standard observability workloads.
Small Scale (10–50 nodes, 100k active series)
Prometheus:
- Instance: t3.medium (2 vCPU, 4 GB RAM) = $182/year
- Disk: 50 GB EBS gp3 = $4/month = $48/year
- Total: $230/year
VictoriaMetrics:
- Instance: t3.small (2 vCPU, 2 GB RAM) = $91/year
- Disk: 10 GB EBS gp3 = $0.80/month = $10/year
- Total: $101/year
Savings: $129/year (56%)
Medium Scale (100–500 nodes, 1M active series)
Prometheus:
- Instance: m5.2xlarge (8 vCPU, 32 GB RAM) = $2,920/year
- Disk: 500 GB EBS gp3 = $40/month = $480/year
- Total: $3,400/year
VictoriaMetrics:
- Instance: m5.large (2 vCPU, 8 GB RAM) = $730/year
- Disk: 100 GB EBS gp3 = $8/month = $96/year
- Total: $826/year
Savings: $2,574/year (76%)
Large Scale (1000+ nodes, 10M active series)
Prometheus with Thanos:
- 5x Prometheus instances (m5.xlarge each) = $7,300/year
- 2x Thanos queriers (m5.large each) = $1,460/year
- 2x Thanos store gateways (m5.large each) = $1,460/year
- S3 storage (1 TB/month) = $23/month = $276/year
- Total: $10,496/year
VictoriaMetrics cluster:
- 3x vmstorage nodes (m5.xlarge each) = $4,380/year
- 2x vmselect nodes (m5.large each) = $1,460/year
- 2x vminsert nodes (m5.large each) = $1,460/year
- Disk: 500 GB EBS gp3 per vmstorage = $120/month = $1,440/year
- Total: $8,740/year
Savings: $1,756/year (17%)
Infrastructure pricing from AWS public pricing as of April 2026. Actual costs vary by region, discounts, and Reserved Instance terms.
Disclaimer: This estimate models a production-ready, high-availability setup. Actual costs will vary based on specific workload characteristics, retention period, query patterns, and vendor discounts.
Alerting and Integrations
Prometheus
Prometheus includes Alertmanager natively. Define alert rules in Prometheus config, and Alertmanager handles routing, deduplication, and notification to Slack, PagerDuty, email, or webhooks.
Integration ecosystem: Massive. Prometheus exporters exist for every major system: databases, message queues, cloud services, application runtimes. Grafana, Datadog, New Relic, and most observability tools support Prometheus remote write.
VictoriaMetrics
VictoriaMetrics does not include alerting. Use vmalert (separate binary) to evaluate alert rules and send notifications to Alertmanager or directly to notification channels.
Integration ecosystem: Smaller than Prometheus but growing. VictoriaMetrics supports Prometheus remote write, so any tool that writes to Prometheus can write to VictoriaMetrics. Grafana works natively with VictoriaMetrics as a data source.
Key difference: Prometheus alerting is a single integrated system. VictoriaMetrics requires running vmalert separately, which adds a deployment step but gives more flexibility in where alerts are evaluated.
Alerting and integration details from VictoriaMetrics alerting documentation and Prometheus Alertmanager documentation.
Who Should Choose Each
Choose Prometheus if:
- You are running a small to medium cluster (under 100 nodes) with moderate cardinality
- You need a fully integrated scraping, storage, and alerting system in a single binary
- You value the massive ecosystem and community support
- You are just getting started with metrics and want the industry standard
- You do not need long-term retention (15–30 days is enough)
Choose VictoriaMetrics if:
- You are running a large cluster (500+ nodes) or have high cardinality workloads
- You need long term retention (months or years) without external storage backends
- You want to reduce infrastructure costs by 50–75% compared to Prometheus
- You are hitting Prometheus performance limits on queries, RAM usage, or disk space
- You are already using Prometheus but need better long-term storage than Thanos or Cortex
Choose CubeAPM if:
You need full stack observability (APM, logs, traces, infrastructure) in one platform, not just metrics. CubeAPM runs on your infrastructure like VictoriaMetrics but adds distributed tracing, log management, and real user monitoring alongside metrics. It supports OpenTelemetry natively and Prometheus remote write, so you can send VictoriaMetrics or Prometheus data to CubeAPM for unified query and correlation.
Key difference: VictoriaMetrics is a metrics-only TSDB. CubeAPM is a full observability platform that includes metrics but also correlates them with traces, logs, and infrastructure events.
Pricing: $0.20/GB ingested across all signal types (metrics, logs, traces). No per-host or per-user fees. For a 500-node cluster generating 10 TB/month total telemetry, CubeAPM costs $1,500/month vs. $3,400/year for Prometheus alone (not including logs or traces).
CubeAPM pricing and feature details from [CubeAPM pricing page](https://cubeapm.com/pricing/).
Migration Path: Moving from Prometheus to VictoriaMetrics
Migrating from Prometheus to VictoriaMetrics is low risk because VictoriaMetrics is Prometheus-compatible. Existing dashboards, alert rules, and queries continue to work without modification.
Step 1: Deploy VictoriaMetrics alongside Prometheus
Run VictoriaMetrics as a separate instance. Point Prometheus remote write to VictoriaMetrics. This doubles storage temporarily but lets you validate VictoriaMetrics before cutover.
Step 2: Validate queries and dashboards
Run the same PromQL queries against both Prometheus and VictoriaMetrics. Confirm results match. Check Grafana dashboards to ensure they work with VictoriaMetrics as the data source.
Step 3: Migrate scraping to vmagent or VictoriaMetrics
Replace Prometheus scraping with vmagent or configure VictoriaMetrics to scrape directly. Use the same scrape configs — VictoriaMetrics reads Prometheus config files natively.
Step 4: Cut over and decommission Prometheus
Once VictoriaMetrics is handling all scraping and queries, stop Prometheus. Archive the old Prometheus data if needed, or let retention expire naturally.
Timeline: Most teams complete this in 1–2 weeks. Zero downtime is achievable because Prometheus and VictoriaMetrics run in parallel during migration.
Gotcha: If you use Prometheus federation, you will need to reconfigure scrapers to point at VictoriaMetrics instead. Federation is not required with VictoriaMetrics because cluster mode handles horizontal scale natively.
Migration steps are based on VictoriaMetrics migration documentation and community migration reports on Reddit.
Verdict: Which Scales Better for Production?
Prometheus scales well vertically up to a point. For small to medium clusters with standard cardinality, it is simple, reliable, and widely supported. But beyond 100 nodes or 1 million active time series, resource usage climbs fast, and you start needing external storage solutions like Thanos or Cortex to handle retention.
VictoriaMetrics scales better horizontally and vertically. It handles 10–100x more data on the same hardware, reduces infrastructure costs by 50–75%, and supports years of retention without external dependencies. Query performance is faster, and the operational model is simpler than running Prometheus federation with Thanos.
If you are starting fresh: Use Prometheus to get familiar with metrics and PromQL. When you hit scale limits or need longer retention, migrate to VictoriaMetrics.
If you are already running Prometheus at scale: Evaluate VictoriaMetrics now. The storage savings alone justify the migration effort for most teams.
If you need more than just metrics: Consider a full observability platform like CubeAPM that handles metrics, logs, traces, and infrastructure in one system with predictable pricing and self-hosted deployment.
Disclaimer: The information in this article reflects the latest details available at the time of publication and may change as technologies and products evolve. Features, pricing, and plan limits can change over time. Always verify the latest information directly with the vendor before making purchasing or deployment decisions.
Frequently Asked Questions
Is VictoriaMetrics a drop in replacement for Prometheus?
Yes, for storage and querying. VictoriaMetrics reads Prometheus scrape configs, supports PromQL queries, and works with Grafana dashboards without modification. It does not include native alerting; use vmalert or keep Prometheus Alertmanager for that.
How much storage does VictoriaMetrics save compared to Prometheus?
VictoriaMetrics typically uses 10x less disk for the same dataset due to better compression. A workload that consumes 500 GB on Prometheus uses 50 GB on VictoriaMetrics.
Can I run VictoriaMetrics and Prometheus together?
Yes. Most teams run both during migration: Prometheus for scraping and short-term storage, VictoriaMetrics for long-term retention via remote write. Once validated, you can fully cut over to VictoriaMetrics.
Does VictoriaMetrics support Prometheus alerting rules?
Yes, via vmalert. It reads the same alert rule syntax Prometheus uses and sends notifications to Alertmanager or directly to Slack, PagerDuty, and other channels.
What is MetricsQL and do I need to learn it?
MetricsQL is VictoriaMetrics’ extension of PromQL. It adds functions for handling edge cases and improving query performance. Standard PromQL queries work without changes; MetricsQL is optional.
How do I migrate from Prometheus to VictoriaMetrics?
Deploy VictoriaMetrics alongside Prometheus, enable remote write from Prometheus to VictoriaMetrics, validate queries and dashboards, then cut over scraping to VictoriaMetrics or vmagent. Most teams complete this in 1 to 2 weeks with zero downtime.
Does VictoriaMetrics work with Grafana?
Yes. Add VictoriaMetrics as a Prometheus data source in Grafana. All existing PromQL queries and dashboards work without modification.