










Dynatrace’s DPU (Davis Platform Units) billing model, combined with host units and DEM units, makes cost forecasting nearly impossible. Teams frequently encounter bill shock as usage scales. OpenObserve offers a fundamentally different approach: simple ingestion-based pricing, open standards, and full deployment flexibility without the overhead of OneAgent or the opacity of unit-based billing.
Beyond pricing, two architectural differences define this comparison. Dynatrace locks most customers into SaaS unless they sign an enterprise contract and rely on proprietary DQL query language. OpenObserve runs on your infrastructure by default, uses standard SQL and PromQL, and is built natively on OpenTelemetry from day one.
This comparison covers pricing models, feature parity, deployment flexibility, query languages, and migration paths. If you need to model your current Dynatrace bill before reading further, the Dynatrace pricing calculator breaks down every cost dimension across hosts, coverage, and platform usage.
Quick Comparison: OpenObserve vs Dynatrace
| OpenObserve | Dynatrace | |
|---|---|---|
| Pricing model | $0.20/GB ingestion | DPUs + host units + DEM units |
| Per-seat cost | $0 unlimited users | Role-based, high |
| Query language | SQL / PromQL | DQL proprietary |
| OpenTelemetry | Native from day one | Partial, agent-first |
| Self-hosted option | Single binary, free 50 GB/day | Enterprise contract only |
| Data format | Apache Parquet (open) | Proprietary |
| Bring your own storage | S3, GCS, Azure, MinIO | Not available |
| Best for | Teams needing data sovereignty, predictable cost, open standards | Enterprises willing to pay for AI-assisted anomaly detection and proprietary integration ecosystem |
Pricing based on publicly available information as of April 2026. Enterprise discounts and negotiated rates are not reflected here.
OpenObserve Overview
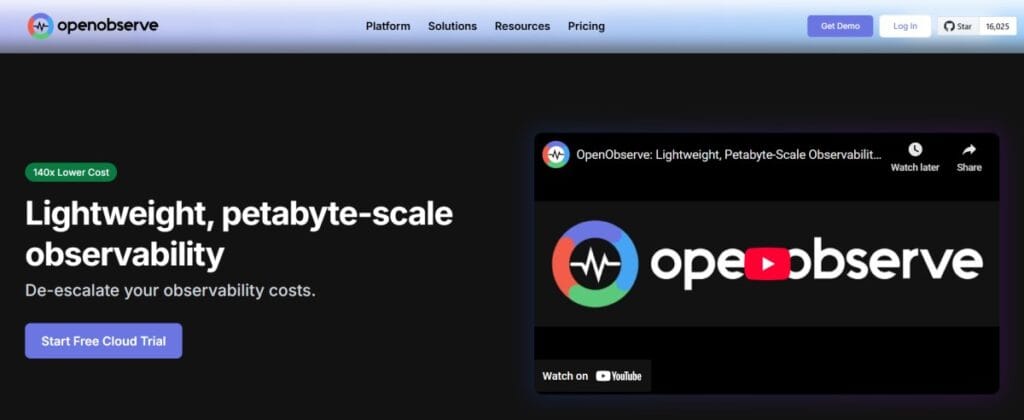
OpenObserve is an open-source observability platform covering logs, metrics, traces, dashboards, and alerts. It runs as a single binary on your infrastructure or in your cloud VPC. The project was designed specifically to replace proprietary SaaS platforms that charge per host, per seat, or via opaque unit-based billing.
OpenObserve uses OpenTelemetry natively, stores data in Apache Parquet format on S3-compatible storage, and supports SQL and PromQL for queries. There are no proprietary agents, no vendor lock-in on query syntax, and no data egress charges when running self-hosted.
The project has over 19,000 GitHub stars and is deployed in production environments handling petabytes of telemetry data monthly. Core use cases include replacing Datadog or New Relic for cost control, replacing Elastic for simpler operations, and replacing Splunk for teams moving off perpetual licensing.
Key strengths
Single ingestion-based pricing dimension with no surprises from metrics, hosts, or users. Full OpenTelemetry compatibility with no proprietary agents required. Self-hosted deployment with complete data ownership and no egress charges. Open data format (Apache Parquet) means your data is always portable.
Key limitations
Requires bring-your-own cloud or on-premises deployment. No autonomous anomaly detection comparable to Dynatrace Davis AI. SSO and RBAC are less mature than enterprise SaaS incumbents.
Dynatrace Overview
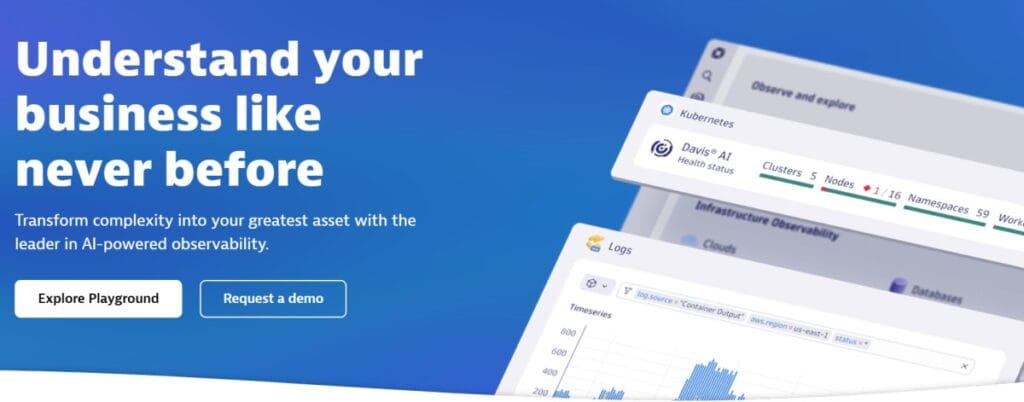
Dynatrace is an enterprise APM and observability platform that offers full-stack monitoring, distributed tracing, real user monitoring, log analytics, and AI-assisted root cause analysis via its Davis AI engine. Dynatrace is deployed primarily as SaaS, though on-premises options exist for large enterprise customers under specific contract terms.
Dynatrace’s defining feature is OneAgent, a proprietary instrumentation layer that auto-discovers services, instruments code without manual configuration, and captures full-stack telemetry. The platform uses DQL (Dynatrace Query Language), a proprietary syntax for querying telemetry data.
Dynatrace is widely used in large enterprises across financial services, healthcare, and telecommunications. The platform is recognized for its depth of AI-assisted diagnostics and its ability to handle complex hybrid cloud environments.
Key strengths
Davis AI provides anomaly detection and automated root cause analysis at enterprise scale. OneAgent offers auto-instrumentation across languages and frameworks with minimal configuration. It offers a broad integration ecosystem and mature enterprise features, including SAML, RBAC, and audit logs.
Key limitations
DPU-based pricing makes cost forecasting extremely difficult, and teams frequently encounter bill shock. DQL query language creates vendor lock-in and makes dashboards non-portable. SaaS-first architecture means telemetry data leaves your infrastructure by default, ruling it out for data residency and HIPAA use cases. On-premises deployment requires enterprise contract negotiation.
Feature-by-Feature Comparison
Logs
OpenObserve: Native log ingestion via OpenTelemetry, Fluent Bit, Logstash, and direct HTTP API. Logs are stored in Apache Parquet format and indexed automatically. SQL and full-text search are supported out of the box. No separate indexing charges. Unlimited retention at a flat ingestion rate. Log correlation with traces happens automatically when trace IDs are present.
Dynatrace: Log ingestion via OneAgent or OpenTelemetry Collector. Logs are processed via Grail data lakehouse and queryable via DQL. Log ingestion is billed separately under the DPU model. Log retention is tied to overall platform retention limits. Strong log-to-trace correlation when using OneAgent instrumentation.
Verdict: OpenObserve wins on cost predictability and query flexibility. Dynatrace wins on auto-discovery and AI-assisted log analysis for teams already invested in the platform.
Metrics
OpenObserve: Prometheus-compatible metrics ingestion. Supports PromQL queries. Stores metrics in Apache Parquet format alongside logs and traces for unified querying. No cardinality limits or cardinality-based pricing. Unlimited retention at flat ingestion rate.
Dynatrace: Metrics captured automatically via OneAgent or ingested via OpenTelemetry. Metrics stored in Grail and queried via DQL. Cardinality impacts DPU consumption. Strong built-in metric anomaly detection via Davis AI.
Verdict: OpenObserve wins on cost and cardinality freedom. Dynatrace wins on automated metric discovery and AI-powered anomaly detection.
Distributed Tracing
OpenObserve: Native OpenTelemetry tracing. Stores traces in Apache Parquet format. Service maps, span-level drill-down, latency percentiles, and error rate tracking included. Trace-to-log correlation is automatic when trace IDs are present. No sampling configuration required at ingest.
Dynatrace: PurePath distributed tracing captured automatically via OneAgent. Strong trace-to-code mapping with automatic baselining and anomaly detection. OpenTelemetry support available but OneAgent remains the primary instrumentation path.
Verdict: OpenObserve wins on OpenTelemetry-native simplicity and data portability. Dynatrace wins on auto-instrumentation depth and AI-assisted root cause analysis.
Alerting
OpenObserve: Alerting via PromQL queries or SQL queries. Supports Slack, PagerDuty, email, and webhook integrations. Custom alert templates available. No anomaly detection built in, alerts are threshold-based.
Dynatrace: Davis AI provides autonomous anomaly detection and alerting without manual threshold configuration. Problem detection correlates signals across metrics, logs, traces, and user sessions. Alert routing via multiple channels, including Slack, PagerDuty, ServiceNow, and email.
Verdict: Dynatrace wins decisively on AI-assisted alerting and autonomous problem detection. OpenObserve requires manual threshold configuration but offers full control and transparency.
Dashboards
OpenObserve: Dashboards created via Grafana-compatible interface or native OpenObserve UI. Supports SQL and PromQL queries. Dashboards stored as JSON and fully portable. No vendor lock-in on dashboard format.
Dynatrace: Dashboards created via native Dynatrace interface. Uses DQL for querying. Dashboards are not portable outside Dynatrace. Strong built-in visualization options and AI-suggested dashboards for common use cases.
Verdict: OpenObserve wins on portability and query language flexibility. Dynatrace wins on built-in visualization depth and AI-suggested dashboards.
Real User Monitoring
OpenObserve: RUM available via OpenTelemetry browser instrumentation. Captures page load times, Core Web Vitals, and user session data. Requires manual instrumentation setup.
Dynatrace: RUM via OneAgent browser injection. Captures session replay, user actions, Core Web Vitals, and full user journey mapping. Automatic instrumentation with no code changes required.
Verdict: Dynatrace wins decisively on RUM depth and ease of deployment. OpenObserve requires more manual setup and offers less session-level detail.
Synthetic Monitoring
OpenObserve: No built-in synthetic monitoring. Requires external tools for scripted transaction checks.
Dynatrace: Full synthetic monitoring included. Supports browser-based and API-based checks from multiple global locations. Scripted transaction tests and multi-step user journey simulation available.
Verdict: Dynatrace wins. OpenObserve does not offer synthetic monitoring natively.
Pricing Comparison
OpenObserve uses simple ingestion-based pricing: $0.50/GB of data ingested. No per-seat charges, no per-host charges, and no opaque unit conversions. You pay for data ingested, period.
Dynatrace uses a multi-dimensional pricing model built around DPUs (Davis Platform Units), host units, and DEM units. DPUs are consumed by log ingestion, metric cardinality, trace volume, and query execution. Host units are consumed by monitored infrastructure. DEM units are consumed by real user monitoring and synthetic checks.
The opacity of this model makes cost forecasting extremely difficult. A single traffic spike can triple DPU consumption in hours. Teams on Reddit have documented bills jumping from $900 to $8,000 in a single month after a production event changed how much telemetry was being processed.
Cost scenario: 30 TB monthly ingestion, 100 hosts, 20 users
This scenario models a mid-sized engineering team running a microservices environment with moderate retention requirements.
Assumptions:
- Monthly ingestion: 30 TB (20 TB logs, 7 TB traces, 3 TB metrics)
- Retention: 30 days, all signal types
- Hosts: 100
- Users: 20 full-platform
- Scope: Core observability only
OpenObserve:
- Data ingestion: 30,000 GB × $0.50 = $15,000
- Data transfer: 30,000 GB × $0.01 = $300
- User licenses: $0
- Total: $15,300/month
Dynatrace (estimated):
- Full stack monitoring: 100 hosts × $74/host = $7,400
- Log ingestion: 20 TB × ~$0.20/GiB = $4,096
- DPU consumption (traces, metrics, queries): ~$6,000
- DEM units (RUM, synthetics): ~$2,000
- Total: ~$19,500/month
This estimate models a production-ready setup with high availability. A smaller or simpler deployment may cost significantly less.
The cost difference widens as data volume or host count increases. At 100 TB/month, OpenObserve costs approximately $50,000/month while Dynatrace can exceed $60,000/month depending on DPU and DEM consumption.
Detailed pricing for both platforms is available at OpenObserve pricing and Dynatrace pricing.
Deployment Models
OpenObserve deploys as a single binary on any infrastructure. Supported deployment targets include AWS, GCP, Azure, on-premises data centers, and Kubernetes clusters. OpenObserve can run on a single VM for small teams or scale horizontally across multiple nodes for high availability. Storage uses S3, GCS, Azure Blob, or MinIO. No data leaves your infrastructure. Full air-gapped deployment supported.
Dynatrace deploys primarily as SaaS. All telemetry data is sent to Dynatrace-managed infrastructure unless you negotiate an on-premises Managed deployment under an enterprise contract. Managed deployments require significant setup and ongoing operational overhead. Most teams use SaaS, which means telemetry data leaves your cloud and incurs egress charges.
Verdict: OpenObserve offers full deployment flexibility by default. Dynatrace requires enterprise contracts for on-premises deployment.
OpenTelemetry Support
OpenObserve is built natively on OpenTelemetry from day one. All ingestion pipelines use OpenTelemetry Collector. No proprietary agents required. Full support for OTLP (OpenTelemetry Protocol) over HTTP and gRPC. Auto-instrumentation libraries for all major languages work out of the box.
Dynatrace supports OpenTelemetry but remains agent-first. OneAgent is still the primary instrumentation path and provides the deepest integration with Dynatrace features. OpenTelemetry ingestion is available, but some advanced features like auto-baselining and Davis AI anomaly detection work best with OneAgent telemetry.
Verdict: OpenObserve is fully OpenTelemetry native. Dynatrace supports OpenTelemetry but incentivizes OneAgent for full feature access.
Query Language and Data Portability
OpenObserve uses SQL and PromQL. Both are open standards. Dashboards and queries are fully portable to any SQL or PromQL-compatible platform. Data is stored in Apache Parquet format, an open columnar format that can be read by any data tool. If you decide to leave OpenObserve, your data and queries are yours.
Dynatrace uses DQL (Dynatrace Query Language), a proprietary syntax designed specifically for querying Grail. DQL is powerful but creates vendor lock-in. Every dashboard, alert, and saved query uses DQL. Migrating away from Dynatrace requires rewriting all queries and dashboards in a new syntax. Data is stored in a proprietary format accessible only via Dynatrace APIs.
Verdict: OpenObserve eliminates vendor lock-in. Dynatrace creates significant switching costs via DQL and proprietary data format.
Who Should Choose Each
Choose OpenObserve if:
You need full data sovereignty and cannot send telemetry outside your cloud or data center. You want predictable pricing based on ingestion volume with no per-seat or per-host charges. You prefer open standards (OpenTelemetry, SQL, PromQL) over proprietary query languages. You want to avoid vendor lock-in on dashboards, queries, and data format. You are comfortable deploying and managing infrastructure but want vendor support for upgrades and troubleshooting.
Choose Dynatrace if:
You need AI-assisted anomaly detection and autonomous root cause analysis at enterprise scale. You want auto-instrumentation with minimal configuration across complex hybrid environments. You have budget for premium pricing and are willing to accept DPU billing opacity. You prioritize feature depth and maturity over cost or data sovereignty. You need deep integration with Cisco and enterprise IT service management platforms.
Migrating from Dynatrace to OpenObserve
Migration from Dynatrace to OpenObserve requires three primary steps: replacing OneAgent with OpenTelemetry Collector, translating DQL queries to SQL or PromQL, and rebuilding dashboards in OpenObserve’s native UI or Grafana.
Step 1: Replace OneAgent with OpenTelemetry Collector
Deploy the OpenTelemetry Collector alongside your existing OneAgent setup. Configure exporters to point to OpenObserve. Your application code stays completely untouched. No re-instrumentation required. Run both systems in parallel while you validate data parity and build confidence.
For containerized workloads, use the OpenTelemetry operator for Kubernetes to handle automatic injection. For VM-based workloads, install the OpenTelemetry Collector as a systemd service or Docker container.
Step 2: Translate DQL queries to SQL and rebuild dashboards
Convert your Dynatrace DQL queries to standard SQL using OpenObserve migration guides. DQL FETCH, FILTER, and SUMMARIZE constructs map closely to SQL SELECT, WHERE, and GROUP BY. Most queries translate in 5 to 15 minutes once you understand the syntax mapping.
Rebuild critical dashboards in OpenObserve’s modern UI. OpenObserve supports Grafana-compatible dashboards if your team already has Grafana expertise. Migration teams typically prioritize the top 10 dashboards first, then expand coverage over weeks.
Step 3: Complete cutover and optimize costs
Gradually shift production workloads to OpenObserve, starting with non-critical services. Monitor performance, validate alerts, and decommission Dynatrace hosts progressively. Watch your observability bill drop, often by 70% to 90%, while retaining full visibility.
Most teams keep a Dynatrace read-only account during the transition period for historical data access, then let it expire once the new baseline is established in OpenObserve.
How CubeAPM Compares to Both
CubeAPM offers a third option for teams evaluating OpenObserve alternatives or Dynatrace replacements. Like OpenObserve, CubeAPM runs on your infrastructure and uses OpenTelemetry natively. Unlike OpenObserve, CubeAPM is fully managed—our team handles upgrades, patches, and Day 2 operations while your data never leaves your VPC.
CubeAPM uses the same predictable ingestion-based pricing as OpenObserve: $0.15/GB with unlimited retention and no per-seat charges. The difference is the deployment model. OpenObserve is self-hosted and open source. CubeAPM is self-hosted but managed, giving you data sovereignty without operational burden.
| Feature | OpenObserve | Dynatrace | CubeAPM |
|---|---|---|---|
| Pricing model | $0.50/GB | DPUs + host + DEM units | $0.20/GB |
| Deployment | Self-hosted OSS | SaaS (on-prem via contract) | Self-hosted, vendor-managed |
| Query language | SQL / PromQL | DQL proprietary | SQL / PromQL |
| OpenTelemetry | Native | Partial | Native |
| Day 2 operations | Your team | Dynatrace (SaaS) or your team (Managed) | CubeAPM team |
| AI anomaly detection | None | Davis AI included | Not included |
| Best for | Teams with ops capacity for self-hosting | Enterprises needing AI-assisted diagnostics | Teams wanting managed on-prem observability |
For teams that want OpenObserve’s cost model and data sovereignty but prefer managed operations, CubeAPM bridges the gap. Detailed feature comparison available at the CubeAPM platform overview.
Verdict
OpenObserve and Dynatrace serve fundamentally different use cases. Dynatrace is an enterprise-grade platform optimized for large organizations that need AI-assisted diagnostics, auto-instrumentation, and are willing to pay premium pricing for those capabilities. OpenObserve is optimized for teams that need data sovereignty, predictable cost, and open standards without vendor lock-in.
If your priority is cost control, data residency, or avoiding vendor lock-in, OpenObserve is the stronger choice. If your priority is AI-assisted anomaly detection, auto-instrumentation depth, and you have budget for premium pricing, Dynatrace remains a strong enterprise option.
For teams that want the cost model and data sovereignty of OpenObserve but prefer managed operations, CubeAPM offers a third path: self-hosted infrastructure with vendor-managed Day 2 operations.
Disclaimer: The information in this article reflects the latest details available at the time of publication and may change as technologies and products evolve. Features, pricing, and plan limits can change over time. Always verify the latest information directly with the vendor before making purchasing or deployment decisions.
Frequently Asked Questions
Does OpenObserve replace Dynatrace’s full APM and distributed tracing?
Yes for core APM use cases covering 90% of teams. OpenObserve provides distributed tracing via OpenTelemetry, including service maps, span-level drill down, latency percentiles, and error rate tracking. Dynatrace’s Davis AI anomaly detection and auto-baselining are not available in OpenObserve.
How does OpenObserve’s pricing compare to Dynatrace’s DPU model?
Dynatrace DPU billing makes cost forecasting extremely difficult and teams frequently encounter bill shock. OpenObserve uses simple ingestion-based pricing with no per-seat charges, no per-host charges, and no opaque unit conversions. Most teams see 70% to 90% cost reductions after switching.
Can I run OpenObserve on premises for data residency compliance?
Yes. OpenObserve deploys as a single binary on any infrastructure including on premises data centers and air-gapped environments. No telemetry data leaves your infrastructure. Full data sovereignty by design.
What happens to my historical Dynatrace data after migration?
Your historical data stays in Dynatrace as long as your subscription and retention windows are active. If you need history in OpenObserve, you can export it from Dynatrace and re-ingest it. Most teams keep a Dynatrace read-only account during the transition period, then let it expire once the new baseline is established.
Is OpenObserve enterprise ready for production workloads?
Yes. OpenObserve is deployed in production environments processing over 2 PB of data daily across thousands of deployments. Enterprise features include role-based access control, SAML and OIDC SSO, sensitive data masking, audit logs, and dedicated support SLAs.
How long does a typical Dynatrace to OpenObserve migration take?
Teams already on OpenTelemetry or willing to adopt it can start receiving data in OpenObserve within hours. Full migration including dashboard recreation and alert translation typically takes one to three weeks depending on environment complexity. Migration teams can help accelerate this for large deployments.
Does OpenObserve support the same integrations as Dynatrace?
OpenObserve uses OpenTelemetry Collector, which supports over 200 receivers, processors, and exporters. This covers most monitoring use cases. Dynatrace’s OneAgent offers deeper auto-discovery for proprietary protocols and legacy systems. For standard cloud native workloads, OpenObserve integration coverage is equivalent.