Monitoring Kubernetes HPA (Horizontal Pod Autoscaler) is critical as more than 96% of enterprises run Kubernetes, yet average CPU utilization sits at just 13%, highlighting wasted resources and unstable scaling practices. Without proper HPA monitoring, autoscaling often fails to match real workload patterns.
The pain point for teams is unpredictable scaling: pods spike and drop too often, readiness probes fail during surges, or clusters hit maxReplicas without warning. Also, HPA thresholds are a top cause of Kubernetes cost overruns and degraded SLAs. CubeAPM is the best solution for monitoring Kubernetes HPA. It unifies metrics, logs, and error traces, offering dashboards for replica trends, anomaly detection, and alerts to prevent scaling failures.
In this article, we’ll explain what Kubernetes HPA is, why monitoring matters, key metrics to track, and how CubeAPM simplifies HPA monitoring.
What is Kubernetes HPA?

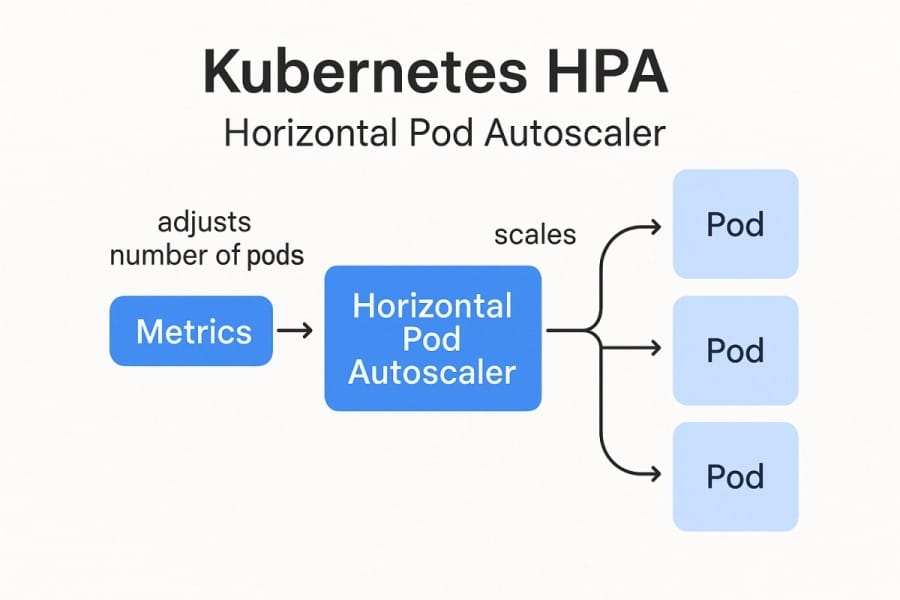
Kubernetes HPA (Horizontal Pod Autoscaler) is a controller that automatically adjusts the number of pod replicas in a deployment, replica set, or stateful set based on observed metrics such as CPU, memory, or custom application metrics. Instead of relying on static provisioning, HPA dynamically scales workloads up or down, helping applications stay responsive during spikes and cost-efficient during idle periods.
For businesses today, HPA offers significant benefits:
- Performance stability: Applications scale in real time to handle unpredictable traffic.
- Cost efficiency: Prevents over-provisioning by keeping pods closer to actual demand.
- Operational resilience: Avoids outages caused by under-provisioning during sudden load surges.
- Flexibility: Supports both resource metrics (CPU/memory) and business metrics (e.g., requests per second, queue depth).
Example: Using HPA for E-Commerce Checkout Spikes
Imagine an online store running Kubernetes for its checkout service. During normal hours, two pods handle steady traffic. But on Black Friday, traffic surges 10×. With HPA configured to scale on CPU usage and request latency, the system automatically grows from 2 pods to 20 in minutes, keeping cart submissions fast and error-free. Once traffic drops, HPA scales back down, saving thousands of dollars in infrastructure costs.
Why is Monitoring Kubernetes HPA Critical?
Control cloud spend by aligning replicas to real demand
Kubernetes clusters are famously under-utilized—Datadog reports median CPU utilization for Kubernetes workloads dropped to ~15.9% (2024), signaling persistent over-provisioning. Without HPA visibility, pods scale when they shouldn’t (or don’t scale when they must), inflating bills. Meanwhile, 84% of organizations say managing cloud spend is their top challenge (2025)—making precise autoscaling oversight a FinOps necessity.
Detect “stuck at maxReplicas” and capacity bottlenecks early
When HPA’s desiredReplicas sits at maxReplicas, you’re capacity-bound—latency and errors follow. Monitoring HPA status/conditions and the autoscaling/v2 object helps surface these limits in time to raise caps, add nodes, or tune thresholds.
Prevent scaling “flapping” with stabilization windows and new tolerance controls
Rapid up/down oscillation taxes your app and users. Kubernetes provides behavior controls—stabilizationWindowSeconds and scaling policies—to dampen noise; defaults include a 300-second scale-down window. Kubernetes v1.33 also introduced configurable tolerance (alpha), so small metric jitters don’t constantly recalculate replicas. Monitoring highlights when policies are too twitchy—and when to widen windows.
Validate custom metrics integrity—the signal that drives scaling
Modern HPAs often scale on multiple metrics (CPU, memory, RPS, queue depth, latency). Broken adapters, stale exporters, or missing timeseries cause bad decisions. Tracking HPA against autoscaling/v2 behavior in managed platforms (e.g., GKE) and watching metric freshness prevents silent failures that leave services underscaled.
Protect user experience during surges (readiness, startup, latency)
Scaling isn’t successful if new pods aren’t ready. Visibility into readiness/startup probe failures during HPA events keeps you from routing traffic to “warm-up” pods and avoids 5xx bursts on scale-in. Best-practice guidance consistently calls out probe configuration and graceful scale-down as critical to autoscaling resilience—monitor both alongside HPA actions.
Tie autoscaling to SLOs—not just infrastructure metrics
SRE guidance is clear: alert on user-visible impact (latency, errors), and correlate HPA actions to those signals. Monitoring HPA alongside service SLOs clarifies whether scaling policies actually protect experience—or merely move resource graphs.
Keep current with HPA feature changes and upgrades
Kubernetes continues to evolve HPA. Monitoring that surfaces behavior changes (e.g., tolerance, behavior defaults) helps teams avoid regressions after cluster upgrades and ensures policies keep pace with platform capabilities.
Key Metrics to Monitor for HPA
Monitoring Kubernetes HPA means tracking the signals that influence scaling, the results of scaling actions, and their impact on user experience. These are the most important categories and metrics to watch:
Resource Utilization Metrics
HPA was originally designed to scale workloads based on CPU and memory. These resource signals remain the foundation of most scaling strategies.
- CPU Utilization (%): The primary metric for HPA, calculated as the average CPU use across pods. It helps ensure workloads scale before processors saturate and degrade responsiveness. Tracking CPU utilization also shows whether requests and limits are realistic.
Threshold: Keep the target average between 50–70% utilization. - Memory Utilization (%): Memory-bound workloads often hit problems long before CPU rises, especially with JVM apps or databases. Monitoring memory allows teams to detect early OOM conditions and adjust autoscaling accordingly.
Threshold: Trigger scaling when pods exceed 70–80% memory usage. - Pod Resource Requests vs Limits: HPA makes decisions based on requests, not limits. If requests are misaligned with actual usage, scaling logic will be off, leading to over- or under-provisioning. Continuous monitoring ensures requests reflect reality.
Threshold: Requests should mirror real usage with ~20% headroom.
Application & Custom Metrics
Scaling only on CPU/memory is often too generic. Custom application metrics align autoscaling with real workload demand and business needs.
- Requests Per Second (RPS): A more workload-specific measure, RPS ensures scaling is tied to actual demand patterns. It prevents scenarios where high throughput stresses pods despite low CPU.
Threshold: Scale when RPS per pod exceeds 150–200 requests/sec. - Latency (p95/p99 response time): Latency directly reflects user experience. By monitoring high-percentile response times, teams can detect when scale-ups are required even before CPU climbs.
Threshold: Scale out if p95 latency exceeds 200–300 ms. - Queue Depth / Backlog Size: Asynchronous workloads rely on queues. Monitoring backlog ensures that new pods are added when existing pods can’t keep pace, preventing unprocessed tasks.
Threshold: Scale when the backlog per pod >100 messages. - Error Rate (%): Errors often spike when pods are overloaded or dependencies fail under pressure. Watching this metric during scaling events reveals if capacity is insufficient or misconfigured.
Threshold: Scale or alert if the error rate is>5% of requests.
HPA Controller Metrics
HPA itself exposes metrics and conditions that reveal whether scaling is timely, efficient, or blocked.
- Current vs Desired Replicas: A gap here means HPA wants more pods than the cluster currently provides. Monitoring it helps catch bottlenecks in scheduling or limits.
Threshold: Sustained mismatch for >5 minutes indicates trouble. - Scaling Events Frequency: Too many scaling events in a short time indicate “flapping.” This wastes resources, increases load on the scheduler, and destabilizes the app.
Threshold: More than 3 scaling events in 10 minutes is a red flag. - Conditions (AbleToScale, ScalingLimited): These reveal why scaling actions may not be happening. Monitoring them gives immediate clarity if HPA is throttled or blocked by policies.
Threshold: ScalingLimited true for >15 minutes needs action. - Stabilization Windows & Policies: These settings prevent scaling based on noisy metrics. Observing their effect ensures workloads scale smoothly without overreacting to jitter.
Threshold: Windows shorter than 300s often cause oscillations.
Pod & Deployment Health Metrics
Even if HPA adds replicas, scaling is wasted if new pods don’t run successfully.
- Readiness/Startup Probe Failures: New pods must pass health checks before serving traffic. If readiness fails frequently, scaling events provide no real benefit.
Threshold: >5% failures within 10 minutes is unhealthy. - CrashLoopBackOff / OOMKills: Frequent pod restarts show that new replicas aren’t stable. This points to misconfigured resources or app-level issues exposed by scaling.
Threshold: >3 restarts per pod in 15 minutes is critical. - Pod Pending Time: Pending pods indicate capacity or scheduling issues. Watching this helps ensure scaling isn’t stuck because nodes can’t host new replicas.
Threshold: Pods pending >2 minutes need investigation.
Cluster & Node Capacity Metrics
Scaling pods requires nodes with enough resources; without cluster capacity, HPA actions fail.
- Node CPU & Memory Pressure: If nodes are under constant pressure, new pods won’t start even if HPA triggers them. This reveals when the bottleneck is infrastructure, not configuration.
Threshold: Node allocatable CPU/Memory >85% is risky. - Unschedulable Pods: Pods stuck in Pending waste HPA scaling actions and directly impact application availability. Tracking them highlights when cluster autoscaler intervention is needed.
Threshold: >2 unscheduled pods for 5+ minutes shows capacity shortage. - Cluster Autoscaler Events: Monitoring node-level scaling events alongside HPA ensures both layers of scaling work together. Delays here can negate the benefits of HPA.
Threshold: Node provisioning >3 minutes delays HPA’s impact.
Business & SLO-Driven Metrics
Ultimately, autoscaling should protect business outcomes and user experience, not just infrastructure graphs.
- Service Latency vs SLA: This ties scaling decisions directly to end-user outcomes. It shows if HPA is really achieving its goal: protecting performance guarantees.
Threshold: p95 latency exceeding SLA (e.g., >250 ms) for >5 minutes. - Conversion Rates / Throughput: By aligning scaling with revenue or product KPIs, teams ensure that infrastructure reacts to what matters most: business performance.
Threshold: Drop >10% during scaling events needs investigation. - Availability (%): Ensures that scaling actions don’t cause outages or downtime. A dip in availability during scaling transitions signals deeper issues.
Threshold: Below 99.9% availability is unacceptable.
Telemetry Collection, Error Tracking & Alerting with CubeAPM
Unified Telemetry with Logs, Metrics & Traces

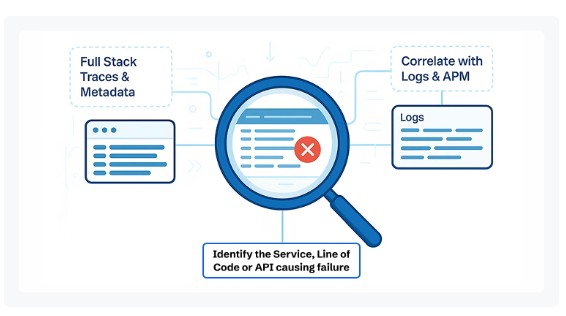
CubeAPM ingests all three pillars of observability—logs, metrics, and traces—into a single platform. For HPA monitoring, this means you can see:
- Metrics: CPU, memory, RPS, latency, replica counts, and scaling events.
- Logs: Kubernetes Events for scaling actions, readiness probe failures, and node scheduling issues.
- Traces: End-to-end request flow, showing if scaling lags behind user demand.
By correlating scaling decisions with application performance, CubeAPM lets you answer questions like: “Did latency spike because HPA was slow to add replicas, or because new pods weren’t ready?”
Real-Time Error Tracking

Scaling up isn’t successful if new pods fail. CubeAPM continuously monitors startup and readiness probe failures, CrashLoopBackOffs, and OOM kills that occur during HPA events. You get immediate visibility into:
- Pods are stuck in Pending because the cluster is out of capacity.
- Containers failing to start due to misconfigured images or insufficient resources.
- Applications that scale but throw errors because dependencies can’t keep up.
Instead of combing through kubectl describe outputs, CubeAPM surfaces these errors directly on dashboards, reducing MTTR.
Intelligent Alerting & Anomaly Detection

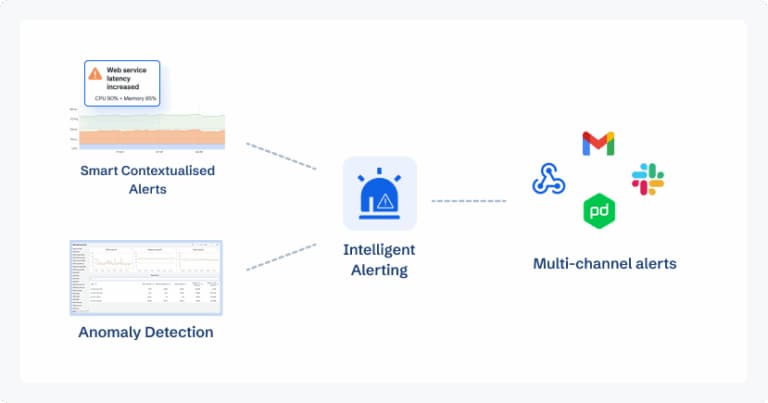
CubeAPM goes beyond static thresholds by detecting patterns and anomalies in HPA behavior. It helps you avoid scaling “flapping,” missed scale-outs, and max replica saturation by providing:
- Custom alert rules: e.g., “More than 3 scale events in 10 minutes” or “DesiredReplicas = maxReplicas for 15 minutes.”
- Anomaly detection: Spotting unusual replica count swings or metric spikes without manual tuning.
- SLO-based alerts: Triggered when scaling events correlate with latency or error budget violations.
This ensures your team responds to real issues—not noisy alerts.
How to Monitor Kubernetes HPA with CubeAPM

Step 1: Instrument Workloads with OpenTelemetry
CubeAPM supports OpenTelemetry for exposing resource metrics (CPU, memory) and custom metrics (latency, queue depth, error rate). Use OTel SDKs or exporters to send metrics & traces to CubeAPM.
Step 2: Install CubeAPM & Deploy Collector on Kubernetes
Use the official Helm chart to install CubeAPM in your cluster. Also deploy the OpenTelemetry Collector in both DaemonSet and Deployment modes to gather metrics, logs, and Kubernetes events.
Step 3: Configure CubeAPM (Dashboards, Defaults & Env Variables)
After installing, set configuration via config.properties, environment variables, or via the Helm chart values.yaml. Adjust base URLs, token, and session keys. Also, configure dashboards for HPA-relevant metrics.
Step 4: Enable Infra Monitoring & Logs for Kubernetes Components
Enable infra metrics such as CPU/memory per node/pod, Kubelet metrics, cluster events, and logs like readiness probe/logs for scaling actions. The collector and infra monitoring setup is key.
Step 5: Set Up Alerts (Email/Webhook/Slack) & Anomaly Detection
Create alert rules in CubeAPM for things like frequent scaling events, maxReplicas saturation, and pod readiness failures. Configure alert delivery channels (email, webhooks). Combine with anomaly detection to catch unusual behavior.
Step 6: Validate with Load / Real Traffic & Tune Policies
After setup, apply load tests or wait for real-traffic spikes. Observe how HPA behaves via CubeAPM: does desiredReplica catch up? Are pods ready and stable? Use those observations to tune thresholds, stabilization windows, and min/max replica settings.
Verification Checklist & Example Alert Rules
Effective HPA monitoring is not just about metrics—it’s about validating that the entire setup, from data collection to alerting, works as intended. Here’s a checklist and practical alert rules to help you achieve production readiness.
Verification Checklist
- Metrics Server is running and healthy: Confirm the Kubernetes Metrics Server is installed and accessible so HPA can query CPU and memory usage. Without it, HPA scaling will fail silently.
- Custom metrics are configured: Ensure Prometheus or another exporter feeds application-specific metrics (RPS, latency, queue depth) to the HPA adapter. Test queries to verify freshness.
- CubeAPM Collector is deployed: Deploy the OTel-based collector as both a DaemonSet and a Deployment to gather node, cluster, and pod-level telemetry. Confirm logs, metrics, and traces reach CubeAPM.
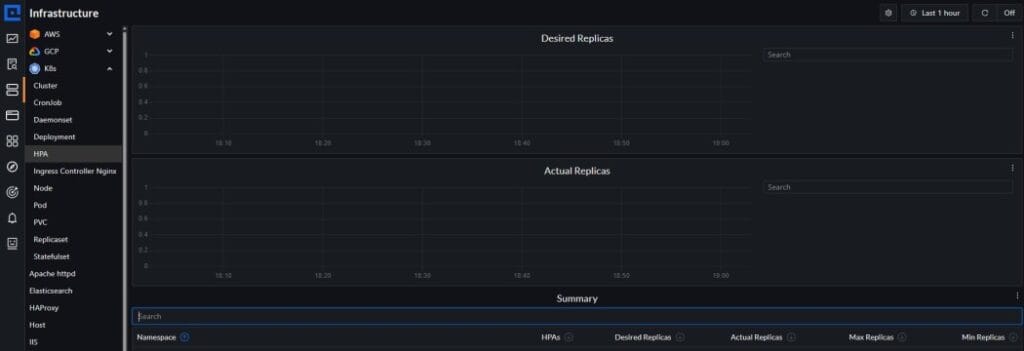
- Dashboards are active: Check that CubeAPM dashboards visualize current vs desired replicas, scale-up/scale-down events, CPU/memory utilization, and pod readiness metrics.
- Alert rules are tested: Simulate stress tests (CPU spike, failing probes) to confirm CubeAPM alerts fire at the right time and escalate correctly.
- Policies are tuned: Validate stabilization windows, min/max replica settings, and scaling thresholds based on real workload traffic patterns, not defaults.
Example Alert Rules
Scaling Loop Alert: Detects frequent up/down oscillation that destabilizes apps
- alert: HPAFlapping
  expr: increase(kube_hpa_status_current_replicas[10m]) > 3
  for: 5m
  labels:
    severity: warning
  annotations:
    description: "Deployment {{ $labels.deployment }} scaled more than 3 times in 10 minutes."
Max Replicas Saturation Alert: Ensures you know when demand hits configured capacity limits
- alert: HPAMaxReplicaSaturation
  expr: kube_hpa_status_desired_replicas == kube_hpa_spec_max_replicas
  for: 15m
  labels:
    severity: critical
  annotations:
    description: "Deployment {{ $labels.deployment }} has been stuck at maxReplicas for 15m."
Pod Readiness Failure Alert: Catches scale-outs where pods fail to become healthy
- alert: HPAPodReadinessFailures
  expr: (sum(kube_pod_container_status_ready{condition="false"}) by (deployment))
        / (count(kube_pod_container_status_ready) by (deployment)) > 0.05
  for: 10m
  labels:
    severity: high
  annotations:
    description: "More than 5% of new pods for {{ $labels.deployment }} are failing readiness."
Pending Pod Alert: Detects scheduling issues that prevent new replicas from starting
- alert: HPAPendingPods
  expr: sum(kube_pod_status_phase{phase="Pending"}) by (deployment) > 2
  for: 2m
  labels:
    severity: warning
  annotations:
    description: "Deployment {{ $labels.deployment }} has pods stuck in Pending for >2 minutes."
Latency & Error Correlation Alert: Links user impact directly with scaling events
- alert: HPALatencyErrorBudget
  expr: (histogram_quantile(0.95, rate(http_request_duration_seconds_bucket[5m])) > 0.25)
        or (rate(http_requests_total{status=~"5.."}[5m]) / rate(http_requests_total[5m]) > 0.05)
  for: 5m
  labels:
    severity: critical
  annotations:
    description: "Latency or error rate exceeded SLA while HPA is scaling in {{ $labels.deployment }}."
Conclusion
Monitoring Kubernetes HPA (Horizontal Pod Autoscaler) is essential for maintaining reliable performance, cost efficiency, and user satisfaction in dynamic workloads. Without proper visibility, scaling can either lag behind demand or overshoot, leading to wasted resources and poor user experiences.
CubeAPM makes HPA monitoring seamless by unifying metrics, logs, and traces into a single platform. It highlights replica trends, readiness issues, and scaling anomalies, while providing intelligent alerting that ensures teams respond before problems impact customers.
With CubeAPM, businesses can confidently manage autoscaling, reduce costs, and maintain high availability. Start monitoring Kubernetes HPA with CubeAPM today and take control of your scaling decisions.
Disclaimer: The information in this article reflects the latest details available at the time of publication and may change as technologies and products evolve.
FAQs
1. Can Kubernetes HPA scale based on multiple metrics at the same time?
Yes. Starting with the autoscaling/v2 API, HPA can evaluate multiple metrics—such as CPU, memory, and custom metrics (like request latency or queue depth)—and trigger scaling decisions when any defined threshold is exceeded.
2. How often does Kubernetes HPA check metrics for scaling decisions?
By default, HPA queries metrics roughly every 15 seconds, but the actual timing depends on the Metrics Server or custom metrics adapter. This interval ensures scaling reacts quickly without overwhelming the API server.
3. What’s the difference between HPA and Kubernetes Cluster Autoscaler?
HPA adds or removes pods within workloads based on metrics, while Cluster Autoscaler adjusts the number of nodes in a cluster when pods can’t be scheduled. Monitoring both together is critical for seamless autoscaling.
4. Can HPA work with external cloud metrics like AWS CloudWatch or GCP Stackdriver?
Yes. By configuring a custom metrics adapter, HPA can consume external metrics from cloud monitoring tools. This lets teams scale workloads based on signals such as queue depth in SQS or Pub/Sub lag.
5. What are common pitfalls when monitoring HPA in production?
Some common mistakes include missing resource requests in pod specs, not tracking ScalingLimited conditions, ignoring readiness probe failures, or failing to correlate scaling with business KPIs like latency and throughput. Monitoring these avoids blind spots.


