Komodor is a cloud-native operations platform valued for its Kubernetes troubleshooting and change intelligence. However, it can be costly, requires strong Kubernetes expertise to use effectively, and debugging issues often still takes significant manual effort.
CubeAPM is the best alternative to Komodor, delivering cloud-native observability with more predictable pricing, easier onboarding, and simpler debugging, without requiring deep Kubernetes expertise to be effective.
In this article, we’ll explore the top 7 Komodor alternatives that offer deeper observability, native OTEL support, self-hosting options, and more predictable pricing for growing teams.
Top 7 Komodor Alternatives
- CubeAPM
- Dynatrace
- Honeycomb
- Middleware
- Splunk Appdynamics
- Datadog
- New Relic
Why Look for Komodor Alternatives?
1. High Cost At Scale
Many users note that Komodor becomes expensive as environments grow, making it less accessible for smaller teams or cost-conscious organizations running multiple clusters.
“This is a great tool, though its costs are higher than those of other options available on the market.” (G2 User Review)
2. Steep Learning Curve
Komodor assumes strong Kubernetes knowledge, which can slow adoption for teams without deep cloud-native or platform engineering expertise.
“Komodor is a good platform. However, it may be complex for new users who have never worked with Kubernetes before.” (G2 User Review)
3. Overwhelming UI
Komodor’s interface presents a dense stream of logs, events, and deployment data—all valuable, but often too much at once. For new or lean teams, the information overload can slow down triage instead of speeding it up. Additionally, the platform offers limited flexibility in tailoring alerts to specific workflows, which can lead to noise and missed signals in high-velocity environments.
“The interface looks overflown with a lot of information. Additionally, I would prefer to see more customized alerts and notifications to adjust with my team’s needs.” — G2 Reviewer
Criteria for Suggesting Komodor Alternatives
To ensure fair and useful recommendations, we considered tools that meet at least four out of these six evaluation criteria:
1. OpenTelemetry-Native Support
Tools should natively ingest, visualize, and route OTEL-formatted telemetry—logs, metrics, traces, and events.
2. Full MELT Coverage (Metrics, Events, Logs, Traces)
The platform should provide out-of-the-box support for all four pillars of observability, ideally with RUM and synthetic monitoring.
3. Sampling Intelligence and Storage Efficiency
Advanced tools apply smart trace sampling to retain high-value data (e.g., traces with errors or latency) while keeping costs low.
4. Fast, Responsive Support
We favored platforms that offer Slack, chat, or dedicated dev support channels with fast SLAs, not just email-based tickets with 3-day turnarounds.
Komodor Overview
Known For
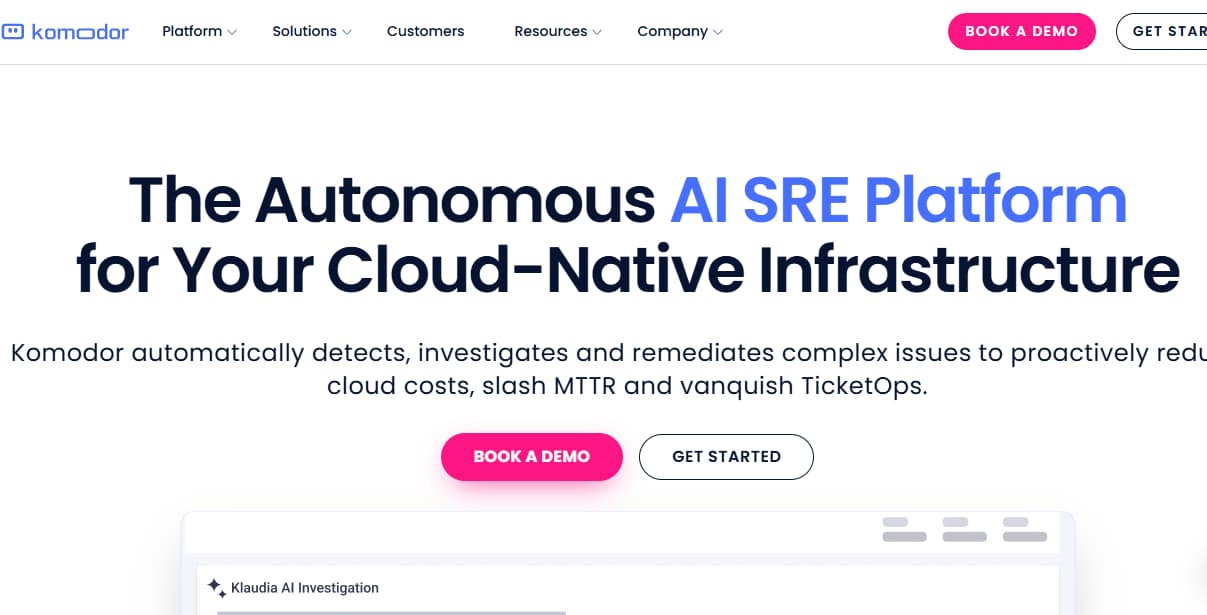
Komodor is best known as a Kubernetes-native troubleshooting and incident response platform. It provides a centralized, timeline-based view of everything happening in your cluster—deployments, config changes, alerts, and service health—helping teams quickly identify what changed and why an issue occurred. It’s widely used by SRE and DevOps teams managing multi-cluster, microservices environments.
Standout Features
- Timeline View: Visualizes real-time and historical deployments, alerts, and code/configuration changes across services in a single timeline.
- Service Dependency Mapping: Automatically maps inter-service relationships, making it easier to understand the upstream/downstream impact of failures.
- Slack and CI/CD Integrations: Integrates seamlessly with collaboration and automation tools, making incident workflows more efficient.
Key Features
- Change Intelligence: Tracks every deployment, config update, and error across clusters, displaying detailed diffs for easy rollback or root-cause diagnosis.
- Service Health Dashboards: Provides real-time visibility into pod status, service health, and cluster activity, eliminating the need to manually run kubectl.
- Log and Event Correlation: Allows users to overlay logs and Kubernetes events with deployments and alerts for quick troubleshooting.
Pros
- Faster Incident Resolution
- Unified Kubernetes Visibility
- Enhanced Collaboration
Cons
- High cost as usage grows
- Steep learning curve
- Debugging still requires significant effort
Best For
Komodor is ideal for platform engineering, DevOps, and SRE teams operating Kubernetes-based microservices. It works best in environments where fast change tracking and incident triage are more critical than deep telemetry analysis or end-to-end tracing. It’s especially useful for teams without existing observability pipelines who need quick operational visibility into Kubernetes behavior.
Pricing & Customer Reviews
- Free tier: Available with limited features for small teams
- Teams: Custom pricing, 50 Nodes, 25 Users;
- Enterprise: Custom pricing, Unlimited Users
- Rating: 4.5/5 (G2)
Top 7 Komodor Alternatives
1. CubeAPM

Known For
Full-stack OpenTelemetry-native observability platform offering APM, logs, metrics, RUM, synthetics, and error tracking with flat pricing and high-performance ingestion.
Key Features
- Smart Trace Sampling: Dynamically retains traces with latency spikes or error events, reducing storage cost by over 70%
- Full MELT Coverage: Includes distributed tracing, infrastructure metrics, log management, real user monitoring, synthetics, and error tracking
- Self-Hosted or Cloud: Offers both SaaS and on-premises deployment options for teams needing data sovereignty or compliance flexibility
- OpenTelemetry-First Design: Seamlessly integrates with OTEL Collector and supports native OTEL pipelines
- High Compatibility: Compatible with Datadog, Prometheus, New Relic, and Elastic agents
Standout Features
- Flat-Rate Pricing: Predictable billing regardless of data volume or user count
- Real-Time Slack/WhatsApp Support: Direct access to core engineers with minute-level TAT
- Compliance Ready: Data stays within your cloud for low latency and compliance with data localization laws
Pros
- 60–70% cheaper than traditional APMs
- Extensive integrations ecosystem, 800+ integrations
- No vendor lock-in with OTEL and Prometheus support
- Built for both cloud-native and air-gapped environments
- Fast ingestion, low latency, and unlimited retention
Cons
- Not suited for teams looking for off-prem solutions
- Strictly an observability platform and does not support cloud security management
Best For
Engineering teams seeking a scalable, OpenTelemetry-native observability suite with predictable pricing, fast support, and flexible deployment options.
Pricing & Customer Reviews
- Flat pricing of $0.15/GB ingested
- Rating: 4.7/5 (G2)
CubeAPM vs Komodor
CubeAPM provides cloud-native observability with correlated traces, metrics, and logs that simplify debugging and reduce costs, while requiring less Kubernetes-specific expertise than Komodor; this makes it easier for teams to onboard, troubleshoot issues faster, and scale without the complexity and expense often associated with Kubernetes-centric tools.
2. Dynatrace
Known For
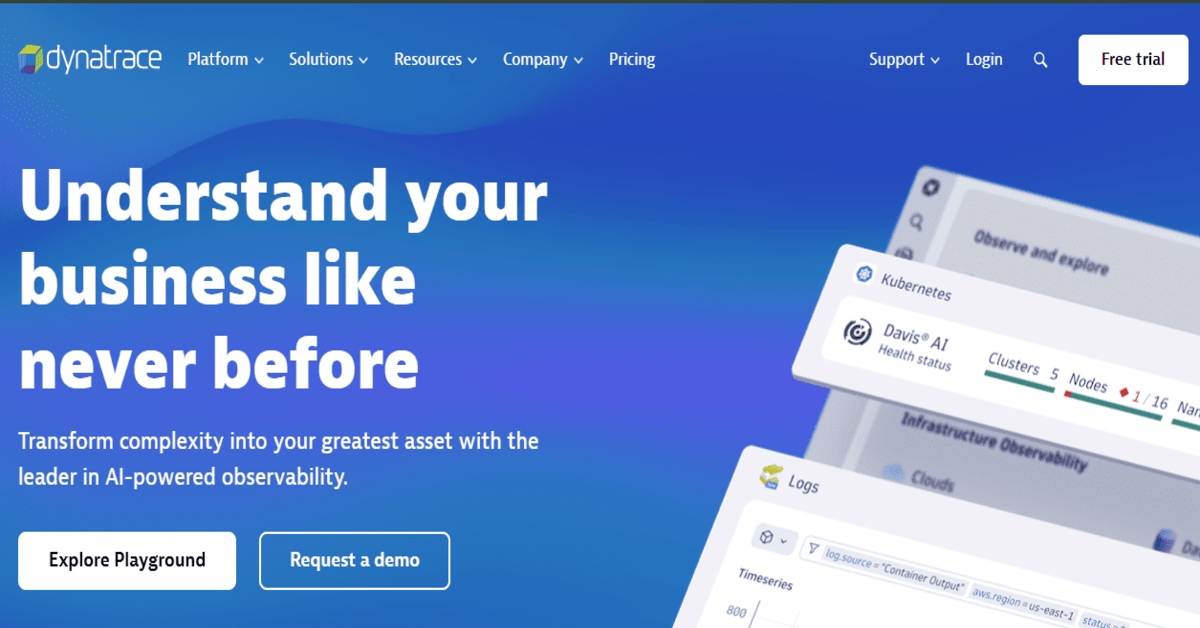
Dynatrace is an AI-driven observability and application performance monitoring platform designed for large-scale enterprises, known for deep automation and full-stack dependency mapping.
Key Features
- Davis AI Engine: Built-in AI engine automates anomaly detection, RCA, and impact analysis across services and infrastructure
- Code-Level Visibility: Deep tracing into Java, .NET, Node.js, and PHP with automated root cause analysis
- Full-Stack Context: Auto-discovers services, containers, and infrastructure with real-time topology mapping
- Cloud-Native Support: Integrates with Kubernetes, OpenShift, AWS, Azure, GCP, and hybrid environments
- Smartscape & PurePath: Service maps and distributed traces that capture end-to-end user requests automatically
Standout Features
- Autonomous Cloud Monitoring: Self-discovering agents that auto-instrument new services as they scale
- Business Analytics Integration: Ties observability data to digital experience, conversions, and SLAs
- Grazie Workflow Engine: Automates remediation and alerting pipelines across toolchains
Pros
- Highly automated setup with minimal manual configuration
- Extremely detailed service dependency maps
- Reliable root-cause analysis with AI-powered suggestions
- Suited for highly dynamic and complex environments
Cons
- Premium pricing, often higher than competitors
- Requires training to fully leverage advanced capabilities
- Overwhelming UI limits usability
Best For
Large enterprises managing microservices at scale who need automated observability, high fidelity traces, and proactive alerting without manual tuning.
Pricing & Customer Reviews
- Infrastructure Monitoring: $29 / mo per host
- Full-Stack Monitoring: $58 / mo per 8 GiB host
- Rating: 4.5/5 (G2)
Dynatrace vs Komodor
Dynatrace provides broad, AI-driven full-stack observability across applications, infrastructure, and Kubernetes, while Komodor is more focused on Kubernetes change intelligence and troubleshooting, making Dynatrace better suited for teams needing wider cloud and application visibility.
3. Honeycomb
Known For
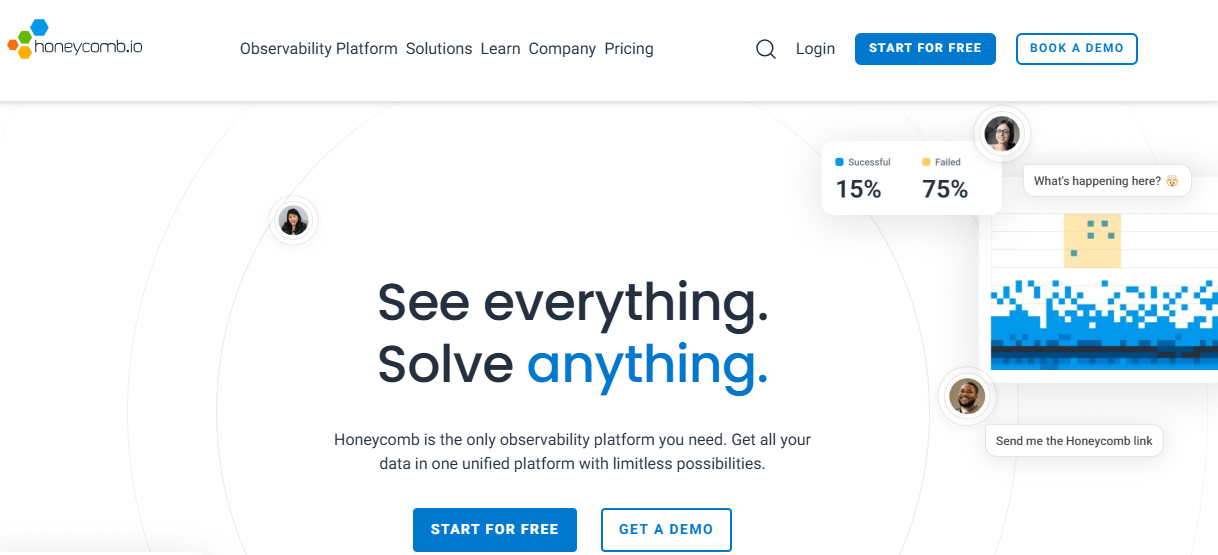
An observability platform purpose-built for high-cardinality, event-based debugging and performance analysis, particularly in distributed systems and modern microservices environments.
Key Features
- Event-Based Telemetry: Accepts structured events instead of traditional metrics for more granular debugging
- Columnar Storage Engine: Allows high-speed querying across billions of events with rich dimensions
- BubbleUp Debugging: Highlights outlier patterns and lets users drill down into problematic subsets instantly
- OpenTelemetry Native: Offers native OTEL support and SDKs, with built-in OTLP ingestion
- Service Maps & Traces: Visualizes spans, traces, and relationships across services in real time
Standout Features
- High-Cardinality Querying: Supports queries across wide dimensions like user ID, endpoint, error type without pre-aggregation
- BubbleUp: Automatically detects anomalies in trace sets and surfaces the contributing fields
- Modern UX: Extremely fast query builder with interactive visual feedback during exploration
Pros
- Best-in-class performance for debugging complex distributed systems
- Powerful for SREs who prefer deep, trace-first exploration over dashboards
- Built-in support for OpenTelemetry with fast ingestion
- Ideal for identifying patterns in large datasets (e.g., spike analysis)
Cons
- Missing features, users desire more in-product control over quota management
- Steep learning curve for new users unfamiliar with Honeycomb’s data model
- Expensive, especially when data volumes grow
Best For
Engineering teams with mature observability practices, especially those operating large-scale microservices who want to debug production using traces and rich dimensions—not just metrics.
Pricing & Customer Reviews
- Free Tier: 20 million events/month
- Pro Tier: $130/month per 100 million events
- Rating: 4.6/5 (G2)
Honeycomb vs Komodor
Honeycomb delivers deep, event-centric observability across telemetry for real-time debugging in distributed systems, whereas Komodor specializes in Kubernetes change visibility and troubleshooting.
4. Middleware
Known For
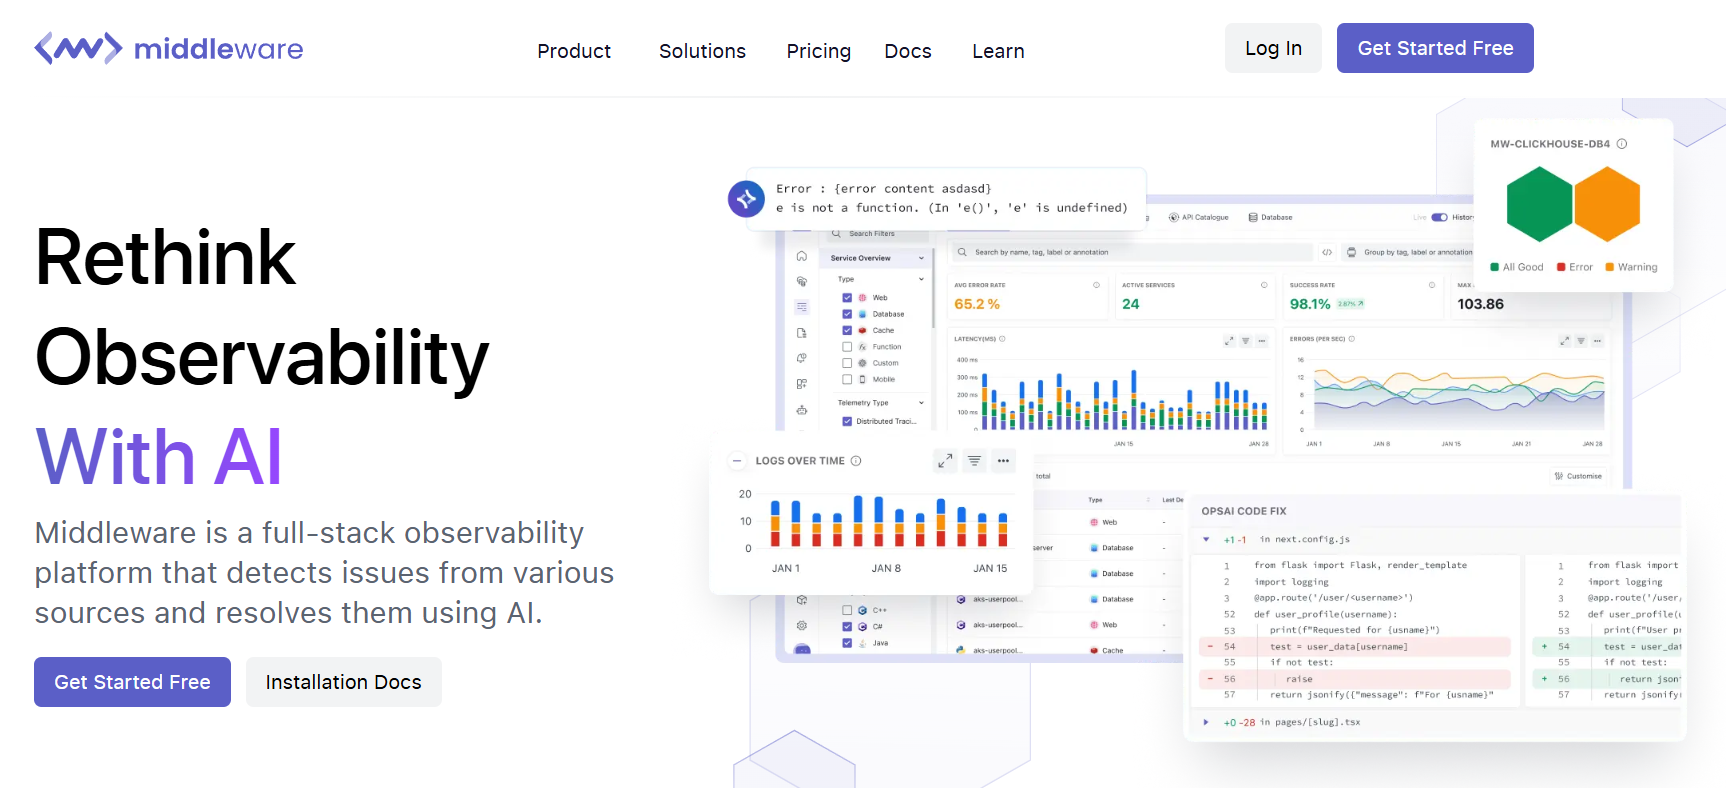
A lightweight and cost-effective observability platform focused on performance monitoring, infrastructure metrics, and application health—especially for fast-growing teams needing simple setup and fast insights.
Key Features
- APM & Tracing: Offers performance monitoring for APIs, services, and backend systems with built-in transaction tracing
- Real User Monitoring (RUM): Tracks frontend performance, Core Web Vitals, and user behavior metrics in real time
- Infrastructure Monitoring: Agent-based monitoring for servers, containers, and VMs with resource usage breakdowns
- Log Collection: Centralized logging for event aggregation and error troubleshooting
- Alerts & Anomaly Detection: Threshold-based and rule-based alerts with Slack and email integration
Standout Features
- All-in-One UI: Combines metrics, logs, traces, and RUM in a single, accessible dashboard
- Quick Deployment: Auto-detection of services and infra components for quick onboarding
- Cost Visibility: Transparent pricing with minimal billing surprises—ideal for startups and lean teams
Pros
- Easy to deploy and scale without dedicated observability staff
- Affordable for small and mid-sized teams
- Covers most key MELT components out-of-the-box
- Clean UI with minimal learning curve
Cons
- Users have reported integration issues with Middleware, adding a layer of complexity
- Configuration complexity slows down setup
- Initial learning curve is steep, especially for beginners
Best For
Startups and SMBs that need simple, affordable observability across app performance, infrastructure, and frontend UX—without heavy customization or complex setup.
Pricing & Customer Reviews
- Free Tier: Up to 100GB of data
- Pay as you go: $0.3 GB of metrics, logs, traces; 30-day retention.
- Enterprise: Custom pricing
- Rating: 4.7/5 (G2)
Middleware vs Komodor
Middleware provides full-stack cloud observability by unifying metrics, logs, and traces for application and infrastructure monitoring, while Komodor focuses on Kubernetes change intelligence and operational troubleshooting in cloud-native environments.
5. Splunk AppDynamics
Known For
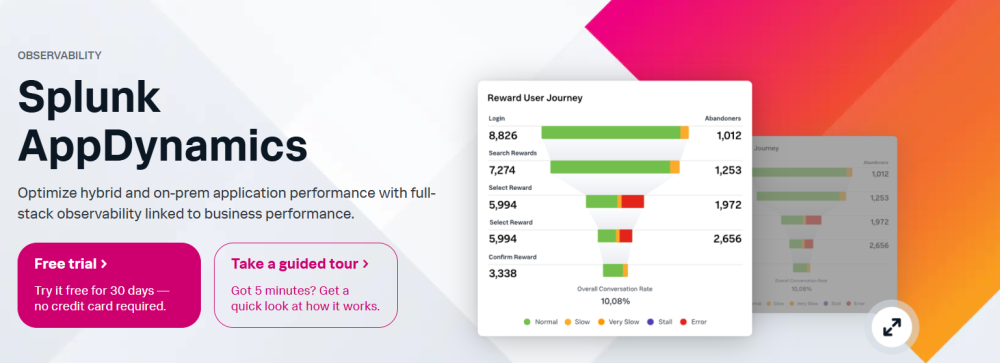
Splunk AppDynamics is an enterprise-grade application performance monitoring and infrastructure visibility platform, now part of the Cisco + Splunk ecosystem. Known for deep code-level tracing, business transaction monitoring, and real-time infrastructure correlation.
Key Features
- Application Performance Monitoring (APM): Tracks every business transaction across microservices with deep method-level tracing
- Infrastructure Monitoring: Correlates application behavior with CPU, memory, disk, and network metrics
- Business IQ Dashboards: Connects application metrics with business KPIs like conversions, revenue, or cart abandonment
- Alerting & Anomaly Detection: Baseline-based alerting with historical comparison and health rules
- Hybrid & Multi-Cloud Support: Deployable on-premises, SaaS, or hybrid environments with deep integrations for AWS, Azure, GCP
Standout Features
- Business Transaction Monitoring: Visualizes and tracks key user workflows across the entire backend stack
- Dynamic Baselines: Auto-learns normal behavior patterns and detects anomalies in real time
- Tie-in with Splunk: Offers strong downstream analytics for logs and events via Splunk integrations
Pros
- Rich visualizations and performance correlation
- Granular tracing down to database calls and async tasks
- Business and technical users can share common dashboards
- Flexible deployment across cloud and on-prem environments
Cons
- Pricing is complex and enterprise-focused
- High learning curve for full platform adoption
Best For
Large enterprises that prioritize performance monitoring tied to business outcomes, and require deep backend tracing with strong compliance and hybrid deployment support.
Pricing & Customer Reviews
- APM: $33/month/CPU core
- Infrastructure Monitoring: starts at $6/month.CPU core
- RUM: $0.06/month/1000 tokens
- Rating: 4.3/5 (G2)
Splunk AppDynamics vs Komodor
Splunk AppDynamics delivers full-stack application performance monitoring with end-to-end visibility across applications, services, and infrastructure, while Komodor focuses on Kubernetes change intelligence and operational context for cloud-native debugging. AppDynamics is suited for broad performance analysis across complex distributed systems, whereas Komodor is optimized for tracking Kubernetes changes and aiding incident investigation.
6. Datadog
Known For
Datadog is widely adopted observability platform offering end-to-end telemetry monitoring—spanning APM, infrastructure, logs, synthetics, RUM, and security analytics—in one interface.
Key Features
- Comprehensive Telemetry Coverage: Supports logs, metrics, traces, synthetics, RUM, and security events across cloud and hybrid environments
- Dashboards and Correlation: Unified UI to correlate different telemetry types with drag-and-drop dashboards
- Massive Integration Ecosystem: 900+ built-in integrations with cloud providers, runtimes, databases, containers, and orchestration platforms
- Live Container and Network Monitoring: Real-time service maps and flame graphs with live container metrics
- Security Monitoring Add-on: Optional features for threat detection, posture management, and attack surface analysis
Standout Features
- Unified Observability + Security: Allows teams to monitor infrastructure and application security in a single tool
- Auto-Instrumentation Support: Easy setup with SDKs and auto-instrumentation for many languages
- Extensive Marketplace: Pre-built widgets and dashboards make it easy to extend and customize views
Pros
- Industry-leading support for cloud-native, hybrid, and multi-cloud environments
- Mature APM with deep tracing capabilities and runtime visibility
- Strong visualizations and collaboration features
- Scales well for large enterprises
Cons
- High costs across telemetry types as usage grows
- Sudden cost spikes due to overages, unplanned usage, or unmonitored services
- Complex initial setup and configuration
Best For
Large organizations with mature DevOps/SRE practices and enterprise budgets, looking for a one-stop platform that blends observability and security at scale.
Pricing & Customer Reviews
- APM (Pro Plan): starting at $35/host/month
- Infra Monitoring (Pro Plan): starting at $15/host/month
- Rating: 4.3/5 (G2)
Datadog vs Komodor
Datadog provides broad full-stack observability across applications, infrastructure, logs, metrics, and Kubernetes, while Komodor is more focused on Kubernetes change intelligence and operational context for troubleshooting cloud-native environments.
7. New Relic
Known For
New Relic is a full-stack observability platform offering monitoring for applications, infrastructure, logs, browser performance, synthetics, and more—all unified under a single UI with a usage-based pricing model.
Key Features
- APM & Distributed Tracing: Tracks application performance down to the line of code, with support for multiple languages
- Logs, Metrics, Traces in One UI: Centralized observability with a unified query language (NRQL)
- Infrastructure Monitoring: Monitors hosts, containers, and Kubernetes clusters with real-time telemetry
- Browser & Mobile Monitoring: Real user monitoring with Core Web Vitals and frontend performance data
- Synthetics & Alerts: Proactive checks on APIs and sites, with dynamic alert policies and anomaly detection
Standout Features
- All-in-One Platform: Offers one of the most complete MELT stacks out of the box
- OpenTelemetry Support: Ingests OTEL traces and metrics, though native OTEL usage is not as seamless as OTEL-first platforms
- Custom Dashboards & NRQL: Flexible dashboarding using their proprietary query language
Pros
- Covers nearly every telemetry type in one platform
- Clean UI with strong correlation between metrics and traces
- Marketplace with 500+ quickstart integrations
- Competitive for teams needing quick onboarding
Cons
- Usage-based pricing can spike costs rapidly at scale
- Steep learning curve for NRQL and dashboard configuration
- Overwhelming UI for new users
Best For
Teams looking for a quick-start, all-in-one observability suite that supports multiple telemetry types with minimal initial setup—especially for startups and mid-sized teams comfortable with usage-based pricing.
Pricing & Customer Reviews
- Free tier: 100GB/month
- Pro Plan: $0.40/GB ingested beyond the 100GB free limit
- Pro Plan: $349/month for full platform user
- Rating: 4.4/5 (G2)
New Relic vs Komodor
New Relic delivers full-stack observability with unified telemetry (metrics, logs, traces, events) across applications, infrastructure, and Kubernetes with powerful analytics and dashboards, while Komodor focuses specifically on Kubernetes change intelligence and operational context for troubleshooting cloud-native environments.
Conclusion
While Komodor offers valuable Kubernetes-native troubleshooting capabilities, it falls short in terms of affordability as usage grows. As modern teams increasingly demand MELT coverage and cost transparency, alternatives like CubeAPM, Datadog, and New Relic present compelling options—each catering to different scales and priorities.
Suppose you’re looking for a lightweight, OTEL-native platform with full MELT support, predictable pricing, and the option to self-host. In that case, CubeAPM stands out as the most complete and cost-efficient alternative to Komodor. For larger enterprises, tools like Dynatrace and Splunk AppDynamics bring powerful automation and deep tracing capabilities, while Honeycomb and Middleware offer unique strengths for debugging and startup-friendly observability.
Ultimately, the right Komodor alternative depends on your team’s scale, tech stack, compliance needs, and budget flexibility. This guide gives you a clear roadmap to choose a solution that’s built for the future of observability.
Disclaimer: The information in this article reflects the latest details available at the time of publication and may change as technologies and products evolve.
FAQs
1. What are the best full-stack observability alternatives to Komodor?
Many teams look for platforms that go beyond Kubernetes troubleshooting and provide full MELT observability—e.g., CubeAPM (complete OTEL-first stack with flat pricing), Datadog (broad integration ecosystem), Dynatrace (AI-driven tracing), Honeycomb (high-cardinality trace debugging), and Splunk AppDynamics (enterprise-level APM with business context).
2. Do any tools offer self-hosting options like Komodor?
Yes—CubeAPM and Splunk AppDynamics both offer self-hosted or hybrid options. This is crucial for teams needing flexibility for compliance, air-gapped deployments, or data sovereignty. Most legacy SaaS tools, however, remain cloud-only.
3. Which alternatives are the most cost-effective compared to Komodor?
CubeAPM is among the most cost-effective options, with flat-rate pricing and smart sampling to reduce storage costs. Middleware also offers a budget-friendly entry point for startups. Legacy platforms like Datadog or Dynatrace can become expensive, especially under usage-based billing models.
4. Are there Komodor alternatives that natively support OpenTelemetry?
Absolutely—CubeAPM, Honeycomb, and New Relic offer native or smooth integration with OpenTelemetry pipelines, making them great choices for teams standardizing on OTEL-based telemetry flows.
5. What should I consider when choosing an alternative to Komodor?
Key factors include:
- Telemetry coverage: Do you need MELT support or just Kubernetes events
- Deployment flexibility: Do you require self-hosting or SaaS is fine?
- Cost model: Do you prefer flat pricing or can manage usage-based billing?
- Advanced features: Is AI-driven analysis or business-metric integration important?
- Ease of setup: Some tools like Honeycomb prioritize self-serve onboarding, while enterprise tools may require training.


