The main difference between Datadog, Amazon CloudWatch, and CubeAPM is how they balance deployment model, pricing behavior, and control over telemetry data at scale.
Datadog prioritizes convenience through a fully managed SaaS experience with broad integrations. Amazon CloudWatch is optimized for AWS-native visibility with usage-based pricing tied to individual services. CubeAPM is designed as a self-hosted, OpenTelemetry-based platform that keeps observability data in your own environment with predictable, ingestion-based costs.
Teams evaluating modern observability platforms often end up comparing Datadog, Amazon CloudWatch, and CubeAPM because all three cover metrics, logs, and traces, but approach the problem from very different architectural and pricing models.
This article breaks down Datadog vs Amazon CloudWatch vs CubeAPM across core features, pricing behavior, deployment models, and real-world use cases.
Datadog vs Amazon CloudWatch vs CubeAPM Comparison
This comparison is based on publicly available documentation and typical production usage patterns. The actual pricing, sapling, and retention behavior may vary depending on workload characteristics and system configuration.
| Feature | CubeAPM | Datadog | CloudWatch |
| Known for | Unified MELT, self-hosting, OTel-native, predictable cost | Large enterprise SaaS ecosystem with 900+ integrations. | Native AWS monitoring for logs, traces, events, metrics, alarms |
| Multi-Agent Support | Yes (OTel, New Relic, Datadog, Elastic, etc.) | Yes (Datadog Agent, OTel, third-party agents) | Yes, but AWS-centric (CloudWatch Agent, ADOT for OTel, X-Ray) |
| MELT Support | Full MELT coverage | Full MELT coverage | Full MELT coverage |
| Deployment | Self-hosted with vendor-managed | SaaS-only | Fully managed AWS service (SaaS) |
| Pricing | Ingestion-based pricing of $0.15/GB | APM: $31/host/ month; Infra: $15 /host/month; Logs: $0.10/GB | Logs: $0.50/GB; Traces : $0.15/GB; Metrics: $0.30/custom metric/ month (10k metrics) |
| Sampling Strategy | Smart sampling – automated, context- aware | Head-based, tail-based, adaptive | Fixed-percentage and rate-limited (for traces not logs/metrics) |
| Data Retention | Unlimited Retention (no extra cost) | 15-30d based on plan | Metrics: 15m; Traces: 30d; Logs: configurable (storage billed) |
| Support Channel & TAT | Slack, WhatsApp; response in minutes | Community-based; email & chat (on paid); TAT: <2-48 hrs | Forum, email, chat, phone, TAT: 1d to 15 min (plan-based) |
Datadog vs Amazon CloudWatch vs CubeAPM: Feature-by-Feature Breakdown
Known for
CubeAPM is positioned as a unified observability platform built on OpenTelemetry that runs inside your own cloud or data center, designed to provide metrics, logs, and traces from applications and infrastructure with predictable costs and data control. Its official product messaging emphasizes self-hosting flexibility and full-stack visibility across key telemetry signals.
Datadog is a cloud-based observability and monitoring platform that integrates a broad set of capabilities, including infrastructure monitoring, application performance monitoring (APM), logs, and security signals, into a single SaaS service. According to the Datadog website, it aims to give teams a unified view of their systems and applications at scale with extensive vendor integrations.
Amazon CloudWatch is the native AWS monitoring and observability service that collects and tracks operational data such as metrics, logs, and application traces from AWS resources and applications. Its official documentation describes CloudWatch as providing visibility into performance, resource utilization, and operational health across AWS services with built-in dashboards, alarms, and analytics tools.
Multi-Agent Support
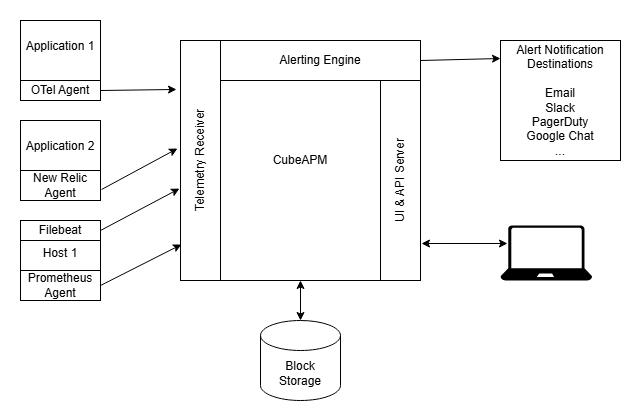
CubeAPM supports a broad, vendor-agnostic ingestion model built around OpenTelemetry. According to its documentation, CubeAPM can ingest data from OpenTelemetry collectors as well as existing Datadog, New Relic, Prometheus, and Elastic agents, allowing teams to migrate incrementally without re-instrumenting applications or running parallel observability stacks. This design is intended to reduce migration friction while standardizing telemetry in a single backend.
Datadog primarily relies on the Datadog Agent as its core data collection mechanism, which supports metrics, logs, and traces from hosts, containers, and managed services. Datadog also provides official support for OpenTelemetry ingestion, particularly for traces and metrics, but its documentation positions the Datadog Agent as the recommended and most fully supported path for production use. Third-party agent ingestion is more limited compared to OpenTelemetry-native backends.
Amazon CloudWatch supports multiple data collection methods, but they are tightly aligned with AWS tooling. CloudWatch ingests telemetry through the CloudWatch Agent, AWS SDKs, and AWS Distro for OpenTelemetry, while distributed tracing is handled through AWS X-Ray. Although OpenTelemetry is supported via ADOT, CloudWatch does not natively ingest arbitrary third-party vendor agents, making its multi-agent support AWS-centric rather than ecosystem-agnostic.
MELT Support
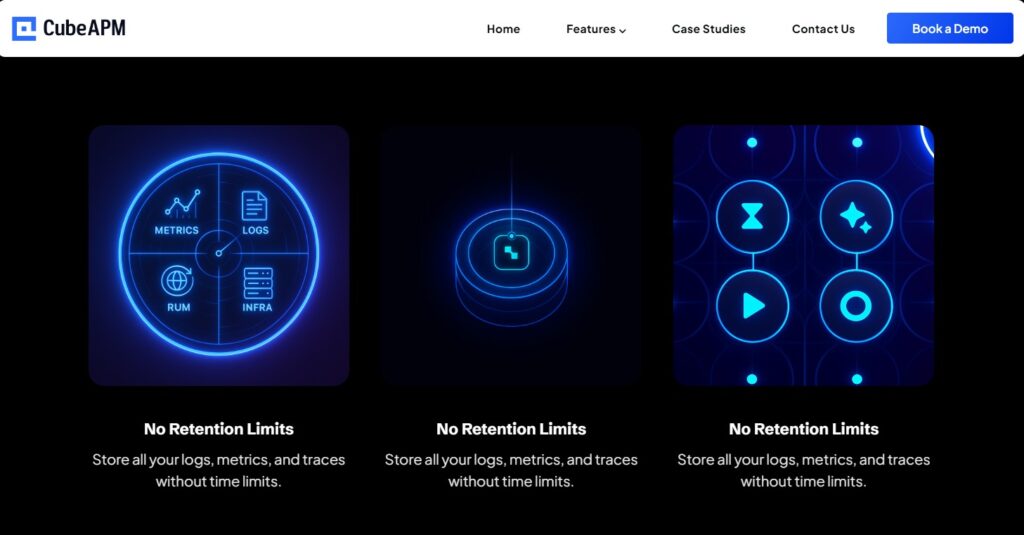
CubeAPM provides native support for all four MELT signals through a single backend built on OpenTelemetry. According to its documentation, CubeAPM ingests metrics, logs, and traces using OpenTelemetry collectors and correlates them at the platform level to support end to end request analysis, infrastructure context, and faster incident investigation. Events are derived from telemetry and system activity rather than handled as a separate service.
Datadog supports full MELT coverage within its SaaS platform, combining infrastructure metrics, application traces, logs, and events into a unified observability experience. Datadog documentation describes built-in correlation between logs, metrics, and traces, allowing teams to pivot across signals during debugging and performance analysis from a single interface.
Amazon CloudWatch also supports all MELT signals, but through multiple AWS services rather than a single backend. Metrics and logs are handled by CloudWatch Metrics and CloudWatch Logs, events are delivered through Amazon EventBridge, and traces are collected using AWS X-Ray and surfaced through CloudWatch ServiceLens. AWS documentation presents these components as an integrated observability experience, even though data is stored and processed across distinct services.
Deployment Model
This section explains where each platform runs, who operates the backend, and how much control teams have over infrastructure, data location, and operations.
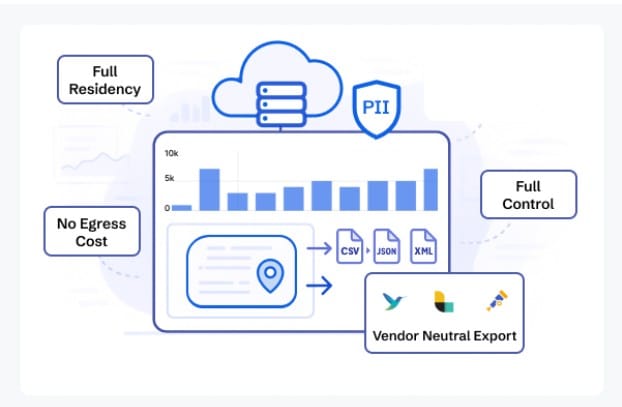
CubeAPM supports self-hosting on a customer’s on-premise infrastructure or on the cloud, while being operated and managed by the CubeAPM team. All telemetry data is stored and processed within the customer’s infrastructure, which allows teams to meet data residency, compliance, and internal security requirements while avoiding the operational overhead of running the observability stack themselves.
Datadog operates entirely as a SaaS platform, where data collection happens via agents installed on customer workloads, but all processing, storage, and querying occur in Datadog-managed infrastructure. Datadog documentation describes this model as fully managed, with customers selecting a Datadog site or region but not managing the underlying backend systems themselves.
Amazon CloudWatch is a fully managed AWS service that runs natively within the AWS platform. CloudWatch backends are operated by AWS, while customers optionally install the CloudWatch Agent, AWS Distro for OpenTelemetry, or X-Ray SDKs on their resources to send telemetry. AWS documentation emphasizes that CloudWatch is tightly integrated with AWS services and uses AWS regions, IAM, and APIs for access and control.
Pricing for Small, Mid, and Large Teams
*All pricing comparisons are calculated using standardized Small/Medium/Large team profiles defined in our internal benchmarking sheet, based on fixed log, metrics, trace, and retention assumptions. Actual pricing may vary by usage, region, and plan structure. Please confirm current pricing with each vendor.
| Approx. cost for teams (size) | Small (~30) | Mid-Sized (~125) | Large (~250) |
| CubeAPM | $2,080 | $7,200 | $15,200 |
| Datadog | $8,185 | $27,475 | $59,050 |
| Amazon CloudWatch | $2,387 | $8,375 | $18,750 |
CubeAPM Costs in Detail
CubeAPM uses a predictable pricing model based primarily on telemetry data ingestion volume. The published CubeAPM pricing shows an ingestion-based rate of $0.15 per GB of data processed (logs, metrics, and traces), which simplifies cost calculus as telemetry scales. This ingestion-only approach means teams pay according to volume of telemetry sent to the platform rather than host count or multiple pricing dimensions.
Pricing for different team sizes:
- Small teams (~ 30): $2,080
- Mid-sized teams (~ 125): $7,200
- Large teams (~250): $15,200
Amazon CloudWatch Cost in Detail
Amazon CloudWatch pricing is usage-based and broken out by signal type. According to the official AWS CloudWatch pricing page and metrics billing documentation, CloudWatch logs ingestion costs $0.50 per GB, CloudWatch custom metrics cost $0.30 per metric per month for the first 10,000 metrics, and distributed tracing through AWS X-Ray is priced at approximately $5 per 1 million traces recorded after the AWS free tier (with the first 100,000 traces free each month). CloudWatch may also incur additional charges for features such as dashboards, alarms, and Insights queries, as defined in the AWS pricing documentation.
Here’s how pricing looks for different team sizes:
- Small teams: $2,387
- Mid-size teams: $8,375
- Large teams: $18,750
Datadog Cost in Detail
Datadog uses a modular pricing structure where different observability products are metered on different units. According to official Datadog pricing pages, infrastructure monitoring typically starts at around $15 per host per month for the Pro plan and higher on Enterprise plans. APM hosts are priced at $31 per host per month, with options up to $40 per host for advanced tiers. Logs billed separately at $0.10 per GB ingested. The total cost also depends on additional services such as logs and custom metrics, which are billed according to product usage.
Pricing for different team sizes:
- Small teams: $8,185
- Mid-size teams: $27,475
- Large teams: $59,050
For more details on how Datadog pricing changes at scale, refer to our Datadog Pricing Calculator page.
These cost differences usually become visible as telemetry volume grows, particularly in systems with steady traffic, many services, or high-cardinality data. At that point, observability spend moves from a predictable line item to something that fluctuates with usage, making cost tracking and forecasting part of the day-to-day operational conversation.
Sampling Strategy
Sampling controls how much telemetry is retained, which requests remain visible during incidents, and how observability costs behave as traffic grows.

CubeAPM applies automated, context-aware Smart Sampling across traces. Sampling decisions consider request characteristics such as latency and errors, allowing higher value traces to be retained without requiring manual rule configuration. This approach is designed to reduce data volume while preserving diagnostically useful traces, with logs and metrics remaining unaffected by trace sampling.
Datadog supports multiple sampling approaches that can be combined based on use case. Official documentation describes support for head-based sampling at the agent level, tail-based sampling through APM pipelines, and adaptive sampling to help control trace volume automatically. These mechanisms give teams flexibility, but require explicit configuration to balance cost and trace completeness, especially in high-throughput environments.
Amazon CloudWatch relies on rule-based sampling for distributed tracing through AWS X-Ray. Sampling rules are defined as fixed percentages with rate limits and are evaluated early in the request lifecycle, before the full request context is known. CloudWatch does not apply native sampling to logs or metrics, so any reduction in volume for those signals must be handled upstream through application logic, agents, or exporters.
Data Retention
Data retention determines how long teams can investigate historical incidents, analyze long term trends, and correlate past behavior across services.
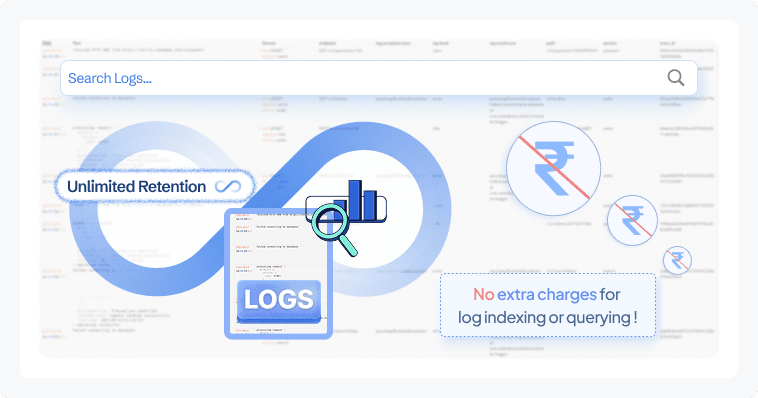
CubeAPM provides unlimited data retention for metrics, logs, and traces, with data stored inside the customer’s own infrastructure. Retention limits are not enforced at the platform level, and there are no additional charges tied to keeping data longer. This allows teams to retain full historical telemetry for audits, incident reviews, and long-term performance analysis without managing retention tiers.
Datadog retention policies vary by signal type and plan. Official documentation states that logs and traces are retained for a limited default period, typically between 15 and 30 days, depending on the product and subscription tier, with longer retention available at additional cost. Metrics retention also varies based on resolution and plan, which means historical visibility depends on both configuration and pricing choices.
Amazon CloudWatch retention is signal-specific and governed by service-level limits. CloudWatch Logs can be retained indefinitely if configured, but log storage is billed per GB per month. CloudWatch Metrics are retained for up to 15 months, depending on resolution, and AWS X-Ray traces are retained for 30 days with no option to extend retention. These limits are defined in AWS documentation and apply uniformly across accounts.
Support Channels and TAT
Support structure and response time influence how quickly teams can resolve production issues, especially during incidents.
CubeAPM provides direct support access to its engineering team through real-time channels such as Slack and WhatsApp. According to CubeAPM documentation and product material, this model is designed to enable faster issue resolution during onboarding and production incidents, with response times typically measured in minutes rather than hours. Support is integrated as part of the platform experience rather than being a separately tiered add-on.
Datadog publishes response time targets by support tier. Under Standard Support, which is included with paid Datadog plans, Datadog documents response targets of under 2 hours for business critical issues, under 12 hours for degraded service, and under 48 hours for general issues.
For customers on Premier Support, Datadog states response targets of under 30 minutes for business critical issues, under 4 hours for degraded service, and under 12 hours for general issues. Access to chat and faster SLAs depends on the selected support plan.
Amazon CloudWatch support is delivered through AWS Support plans. Customers on AWS Business Support receive response targets of up to 30 minutes for business critical system down issues and up to 1 hour for production system down issues.
AWS Enterprise Support reduces the response target for business critical issues to 15 minutes. Less severe cases have response targets of up to 4 hours for system impaired and up to 24 hours for general guidance. These response times apply across AWS services, including CloudWatch, and are defined by the AWS Support plan level.
If you want to compare features and pricing in detail, chcek out our CubeAPM vs Datadog page.
How Teams Typically Decide Between Datadog, Amazon CloudWatch, and Self-Hosted Observability
By the time teams compare platforms like Datadog, Amazon CloudWatch, and self-hosted alternatives, the decision is rarely driven by features alone. It usually reflects how different stakeholders weigh operational risk, cost behavior, and control as systems grow.
Who is involved
Engineering teams evaluate how easily a platform integrates with existing services, how much operational overhead it introduces, and whether it improves debugging and incident response. Finance teams focus on pricing models, cost predictability, and how observability scales with traffic and retention.
Security and compliance teams assess where telemetry data is stored, how access is controlled, and whether deployment models meet regulatory or internal policy requirements. In practice, the final decision often balances all three perspectives rather than optimizing for a single one.
What questions block decisions
Several questions tend to slow down or stall observability decisions. Teams ask:
- How costs behave during traffic spikes or incidents,
- Whether long-term data retention is affordable, and
- How much effort is required to migrate from existing tooling
- Whether adopting a platform limits future flexibility across clouds, agents, or data pipelines
These questions usually cannot be answered from pricing pages or feature lists alone.
Why comparisons alone aren’t enough
Side-by-side comparisons are useful for narrowing options, but they rarely reflect how observability platforms behave under real production load.
Differences in sampling defaults, retention limits, and billing dimensions often only become clear after running production traffic for weeks. As a result, many teams validate their choice through pilots, cost simulations, or limited rollouts before committing at scale.
Datadog vs Amazon CloudWatch vs CubeAPM: Use cases
This section maps each platform to the situations where teams most commonly choose it in practice. These use cases are based on product documentation, published capabilities, and patterns observed from demos, sales discussions, and user adoption behavior.
Choose CubeAPM if:
CubeAPM is typically chosen when teams want full stack observability without giving up control over data, cost predictability, or existing instrumentation.
- You need self-hosted observability with strict data residency or compliance requirements, such as regulated industries or regions where telemetry data must remain inside your cloud or data center. This is based on CubeAPM’s documented deployment model and customer usage patterns.
- You want an OpenTelemetry-native platform that can ingest telemetry from existing Datadog, New Relic, Prometheus, or Elastic agents, allowing gradual migration without re-instrumenting applications. This is based on CubeAPM documentation and demo setups.
- You are running microservices architectures and need end-to-end distributed tracing across services, databases, and message queues, with long-term trace retention for post-incident analysis.
- You care about predictable observability costs at scale, especially in environments with high telemetry volume. Based on CubeAPM pricing pages and sales data, ingestion-based pricing and unlimited retention simplify forecasting compared to multi-dimensional pricing models.
- You want to reduce MTTR by retaining high-value traces using context-aware sampling, particularly during incidents when error and latency spikes matter more than average traffic.
- You run Java-based applications such as Spring Boot, Micronaut, or large JVM services and need deep visibility into request latency, database calls, and inter-service dependencies without aggressive trace drops. Based on demo data, CubeAPM is often evaluated by Java-heavy backend teams migrating from traditional APMs.
- You are a startup or mid-sized team looking for full-stack observability that is lightweight to deploy, without managing a complex open-source stack or committing to long-term SaaS cost growth.
Choose Datadog if:
Datadog is commonly selected when teams prioritize convenience, breadth of integrations, and a fully managed SaaS experience.
- You want a fully managed SaaS observability platform with minimal operational overhead and fast onboarding across infrastructure, applications, and managed services.
- You rely on a wide ecosystem of integrations, especially across multiple cloud providers, SaaS tools, and managed databases. This is based on Datadog’s published integration catalog.
- You prefer centralized visibility across teams using a single hosted platform, even if data is stored outside your own infrastructure.
- You are comfortable with host-based and usage-based pricing and have internal processes to monitor observability spend as environments grow. This is based on Datadog’s published pricing model.
- You need built-in support for infrastructure monitoring, APM, logs, synthetics, and RUM in one SaaS platform without managing collectors or storage.
- You operate at a scale where managed convenience outweighs cost predictability, especially for fast-moving product teams.
Choose Amazon CloudWatch if:
Amazon CloudWatch is typically chosen when workloads are tightly coupled to AWS and teams want native monitoring with minimal external dependencies.
- Your infrastructure runs primarily or entirely on AWS, and you want observability that is deeply integrated with AWS services, IAM, and regions.
- You need native metrics, logs, alarms, and basic tracing for AWS resources without introducing a third-party platform.
- You prefer pay-as-you-go pricing aligned with AWS usage, and your telemetry volume remains within predictable bounds. This is based on AWS CloudWatch pricing documentation.
- You rely on AWS-native tooling such as CloudWatch Alarms, EventBridge, and AWS X-Ray for operational visibility and alerting.
- You want to avoid deploying or managing additional observability backends outside AWS.
- You are an early-stage or AWS-first team where basic observability requirements are met by native services, and advanced correlation or long-term retention is not a priority.
Conclusion
Datadog, Amazon CloudWatch, and CubeAPM all address core observability needs, but they differ in how they balance deployment model, pricing behavior, and long-term operational control. Datadog emphasizes managed convenience and ecosystem breadth, while CloudWatch aligns closely with AWS-native monitoring and usage-based billing.
CubeAPM stands out for teams that want full-stack observability with OpenTelemetry at the core, predictable ingestion-based pricing, and control over data location and retention. For organizations evaluating observability at scale, these differences matter more than feature lists alone.
To see how CubeAPM fits your environment, you can explore a demo or review the platform in action.
Disclaimer: The information in this article reflects the latest details available at the time of publication and may change as technologies and products evolve.
FAQs
1. Can these platforms be used together during a migration?
Yes. Teams often run Datadog or Amazon CloudWatch alongside CubeAPM during transitions. Based on CubeAPM documentation, it can ingest telemetry from OpenTelemetry collectors and existing vendor agents, which allows parallel validation before fully switching tools.
2. How do these tools compare for multi-cloud or hybrid environments?
Datadog is commonly used in multi-cloud setups due to its SaaS model and wide integration support. CloudWatch is best suited for AWS-centric environments and is less flexible outside AWS. CubeAPM is often evaluated for hybrid or multi-cloud deployments where teams want consistent observability across environments while keeping data within their own infrastructure.
3. Which platform is better for long-term historical analysis?
CloudWatch and Datadog impose signal-specific retention limits unless additional costs are incurred. CubeAPM supports long-term retention without platform-enforced limits, which can be useful for audits, capacity planning, and post-incident reviews, based on its documented retention behavior.
4. How much operational overhead is involved in running these platforms?
CloudWatch and Datadog minimize operational overhead since they are fully managed services. CubeAPM runs in the customer’s environment, but based on product documentation, backend operations are vendor-managed, reducing the need for teams to maintain observability infrastructure themselves.
5. Which option works best for teams standardizing on OpenTelemetry?
All three support OpenTelemetry to varying degrees, but CubeAPM is designed as an OpenTelemetry-native platform. Datadog and CloudWatch support OpenTelemetry ingestion, though their ecosystems and tooling remain centered around their own agents and services.


