VMware Aria Operations for Applications (formerly Tanzu Observability by Wavefront) is VMware’s high-performance observability platform designed for real-time analytics across complex, containerized environments. However, users complain about its pricing, UI, and integration.
CubeAPM is the best VMware Aria Operations for Applications alternative, offering a cost-efficient and easy-to-deploy and use platform. This modern, developer-first observability platform delivers native OTEL support, full MELT coverage (metrics, events, logs, and traces), and a Smart Sampling engine that reduces data volume by 50% without losing high-value signals.
In this article, we’ll cover the top best VMware Aria Operations for Applications alternatives, based on pricing, features, deployment, user feedback, and more.
7 Best VMware Aria Operations for Applications Alternatives
- CubeAPM
- Datadog
- New Relic
- Dynatrace
- Grafana
- Elastic Observability
- Amazon CloudWatch
Why Look for VMware Aria Operations for Applications Alternatives?
High Pricing
G2 reviewers frequently point out that VMware’s observability and operations tools come with a high total cost, especially once licensing, data ingestion, and enterprise contracts are factored in. Pricing is not published officially, which is often described as opaque and not transparent, making it difficult for teams to predict long-term costs.
User Interface Issues
Another recurring theme in G2 feedback is usability. Reviewers mention that the UI can feel complex and less intuitive, with a noticeable learning curve for new users. Navigation, dashboard configuration, and overall responsiveness are areas where users report friction, which can slow down onboarding and day-to-day troubleshooting compared to more streamlined observability platforms.
Integration Challenges
G2 reviews also highlight integration challenges, particularly when connecting VMware tools with other VMware products or external systems. Users note that integrations can require additional configuration effort and may not always work smoothly across environments. This integration friction often pushes teams to look for alternatives that offer simpler, more consistent integrations, especially with modern standards and third-party observability tools.
Criteria for Selecting VMware Aria Operations for Applications Alternatives
1. OTEL Support
A strong alternative should natively ingest OTEL-formatted metrics, logs, and traces without requiring proprietary proxies or heavy configuration. This ensures interoperability across different telemetry pipelines and reduces vendor lock-in.
2. Full MELT Coverage
Look for platforms that unify Metrics, Events, Logs, and Traces in a single interface. This eliminates the need for multiple disconnected tools, improving root cause analysis and reducing alert fragmentation.
3. Flexible Deployment
Self-hosting, BYOC (Bring Your Own Cloud), and SaaS options give teams control over compliance, data residency, and operational security, critical for regulated industries or organizations with air-gapped requirements.
4. Transparent Pricing
Alternatives should have clear, predictable pricing based on straightforward metrics like data volume or hosts. This helps avoid cost spikes common with multi-factor billing models.
5. Ease of Use
Choose platforms with plug-and-play integration for your existing stack—Kubernetes, CI/CD tools, and public cloud providers—so you can reduce onboarding time and avoid extensive manual tuning.
6. Advanced Features
Built-in anomaly detection, context-aware alerts, and incident workflows reduce MTTR by getting the right information to the right teams faster.
7. Support Quality
Look for vendors with responsive, multi-channel support (chat, Slack, email) and a strong user community. This ensures faster troubleshooting and access to shared best practices.
VMware Aria Operations for Applications Overview
Known for
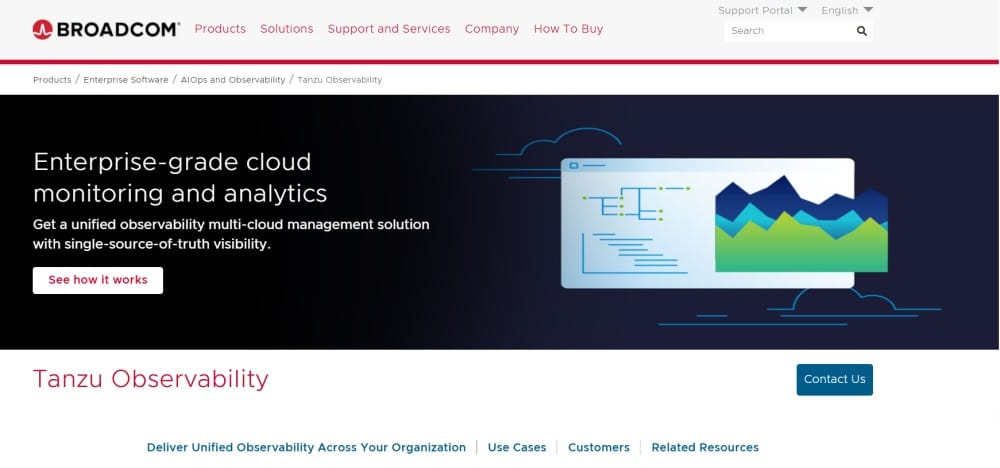
VMware Aria Operations for Applications (Tanzu Observability), a Broadcom subsidiary, is known as an enterprise-grade, real-time analytics platform useful for high-scale observability across cloud-native environments. It can handle millions of high-cardinality time series metrics with second-level granularity. Large enterprises use it for monitoring Kubernetes, microservices, and distributed infrastructure at scale. It excels in environments that demand advanced mathematical analytics, custom dashboarding, and streaming metrics ingestion.
Standout Features
- High-Cardinality Metrics Processing: Purpose-built to process millions of unique time series per second, with minimal performance impact.
- Wavefront Query Language (WQL): Offers a powerful proprietary DSL for querying streaming metric data with high flexibility.
- Ingestion: The tool ingests telemetry data in real-time and offers clean dashboards along with live analytics.
- Automatic Metric Aggregation: Dynamically rolls up high-cardinality metrics to optimize storage and performance.
- Global Time Series Visualizations: Rich, customizable dashboards that support real-time correlation across multi-cloud environments.
Key Features
- Metrics-First Observability: Specializes in metrics ingestion and alerting with multi-dimensional tags and filters.
- Custom Dashboards & Visualizations: Drag-and-drop UI to build detailed visualizations from custom queries.
- Cloud integration: VMware integrates deeply with Kubernetes, AWS, vSphere, HCP, and Azure.
- Alerting & Anomaly Detection: Threshold-based, rate-of-change, and AI-driven alerts for real-time operations.
- Agent Support & SDKs: Multiple agents and open-source SDKs for pushing metrics from custom applications.
- Third-party Integrations: Works with Telegraf, StatsD, collectd, Prometheus exporters, and more.
- Multi-Tenant Support: Role-based access controls and space-level isolation for enterprise environments.
Pros
- Scales well for massive telemetry workloads with high-cardinality metric streams.
- Advanced analytical capabilities through Wavefront Query Language (WQL).
- Flexible integrations with cloud-native stacks and VMware infrastructure.
- Real-time dashboarding with customizable visualizations and alerts.
Cons
- Integration can be challenging
- Complex pricing based on time series count, dashboards, and ingestion volume
- UI issues
Best for
Large enterprises and teams operating across Kubernetes and multi-cloud infrastructures who need advanced, real-time analytics on high-cardinality metrics and are already invested in the VMware ecosystem. Best suited for organizations with dedicated SRE teams who can manage the query complexity and costs associated with enterprise-grade telemetry analysis.
Pricing & Customer Reviews
- Pricing: VMware hasn’t published the exact pricing, but it follows a consumption-based model measured in Point Per Second (PPS) – 1 PPS per metric, 7 PPS per histogram, and 22 PPS per trace span (span logs are free). The cost depends on data type, volume, and query activity.
- PeerSpot rating: 4.0/5 (14 reviews)
- Praised for: Real-time metric processing, custom dashboards, and scale performance
- Criticized for: High cost, lack of OTEL-native support, steep learning curve, and poor pricing transparency
7 Best VMware Aria Operations for Applications Alternatives
1. CubeAPM
Known for
CubeAPM is an OpenTelemetry-native observability platform built to deliver full MELT (Metrics, Events, Logs, Traces) coverage without the high complexity or unpredictable costs of traditional enterprise APM tools. It stands out for its self-hosting flexibility, flat-rate transparent pricing, and intelligent trace sampling that optimizes data relevance while keeping ingestion costs low. Designed for modern cloud-native environments, CubeAPM bridges the gap between open-source flexibility and enterprise-grade features, making it a go-to choice for organizations seeking performance, compliance, and cost control in one platform.
Standout Features
- Full OpenTelemetry Support: Seamlessly ingests OTEL-compliant telemetry without vendor lock-in.
- Unified MELT Stack: Integrates metrics, logs, traces, RUM, and synthetics into a single interface.
- Intelligent Trace Sampling: Uses adaptive sampling algorithms to retain the most valuable traces while reducing noise.
- Self-Hosting Capability: Deploy in private cloud, on-prem, or air-gapped environments for compliance and data residency needs.
- Transparent Pricing: Predictable costs without extra fees for users, dashboards, or data retention.
Key Features
- Infrastructure & APM Monitoring: Deep insights into applications, services, and underlying infrastructure.
- Real User Monitoring (RUM): Tracks end-user interactions and performance in real time.
- Error Tracking: Detects, aggregates, and prioritizes application errors for faster debugging.
- Synthetic Monitoring: Simulates transactions to proactively detect availability and latency issues.
- Custom Dashboards: Flexible visualizations tailored to teams and stakeholders.
- Log Management: Centralized ingestion, search, and correlation across application and infrastructure logs.
Pros
- Fully OTEL-native architecture
- Predictable, transparent pricing
- 800+ integrations support
- No egress charges
- Complete MELT observability in one platform
- Supports self-hosting for compliance-heavy industries
- Intelligent trace sampling for cost efficiency
Cons
- No cloud security management features
- Not suitable for SaaS-focused teams
Best for
CubeAPM is best suited for teams seeking a unified observability stack with maximum control over deployment, cost, and data. It’s ideal for organizations standardizing on OpenTelemetry, operating in regulated industries, or managing large-scale, cloud-native workloads where both performance insight and cost predictability matter.
Pricing & Customer Reviews
- Pricing: $0.15 per GB of data ingested; no fees for user seats, dashboards, or retention
- G2 Score: 4.7/5
- Praised for: cost-effectiveness, OTEL-native design, and self-hosting flexibility
CubeAPM vs VMware Aria Operations for Applications
CubeAPM offers broader MELT coverage, native OTEL support, and flat-rate transparent pricing, avoiding the complexity and cost unpredictability of VMware Aria’s multi-metric billing. It also supports self-hosting, which Aria lacks, making CubeAPM the better fit for compliance-driven teams.
2. Datadog
Known for
Datadog delivers a comprehensive observability and security suite in a unified SaaS platform, popular with modern engineering teams handling cloud-native and hybrid infrastructures. It’s especially recognized for its seamless telemetry correlation and extensive integrations across services, logs, metrics, and more.
Standout Features
- Plenty of Integrations: Supports over 750 services, making setup smooth in diverse environments.
- Observability & Security Workflows: Combines metrics, logs, traces, RUM, and security analytics in one interface.
- AI-Driven Root Cause Analysis: “Watchdog AI” automatically detects anomalies and surfaces relevant incidents.
- Developer & UX-Centric UI: Includes dashboards, notebooks, and session replay for full end-to-end tracing.
Key Features
- Full MELT Stack: Integrated metrics, logs, traces, events, RUM, synthetics, and dashboards.
- Application-Level Insights: Code-level profiling, trace correlation, and CI/CD observability.
- Infrastructure Deep Dive: Auto-deployment detection, tag-based views, and compliance checks.
- Observability Pipelines: Stream, filter, and transform logs pre-ingestion to optimize cost and compliance.
- Data Pipeline Intelligence: Visibility into both streaming and batch data flows.
- RUM & Synthetic Monitoring: Live user tracking, synthetic testing, and replay features.
Pros
- Offers both observability and security
- Large library of integrations
- AI automation for anomaly detection
- Powerful dashboard customization
- Rich tooling for both developers and ops teams
Cons
- High pricing for small teams
- SaaS-only, no self-hosted option
Best for
Datadog is ideal for scaling teams running microservices or serverless stacks across multiple clouds, where unified observability and security are essential. It’s particularly valuable for DevOps and SecOps teams that want automated detection, broad integrations, and rich visualization tools.
Pricing & Customer Reviews
- APM: starts at $31/host/month
- Logs: $0.1/GB + $1.7/M events for 15 days retention
- Infra: starting at $15/host/month
- G2 rating: 4.4/5
- Praised for: broad integrations, intuitive dashboards, and real-time observability
- Criticized for: pricing, lack of self-hosting
Datadog vs VMware Aria Operations for Applications
Datadog offers broader capabilities across observability and security with deep integrations and UX monitoring, while Aria focuses on dense metric analytics with a custom query engine. Datadog is the stronger choice for teams that prioritize quick setup, multi-signal insights, and integrated security.
3. Dynatrace
Known for
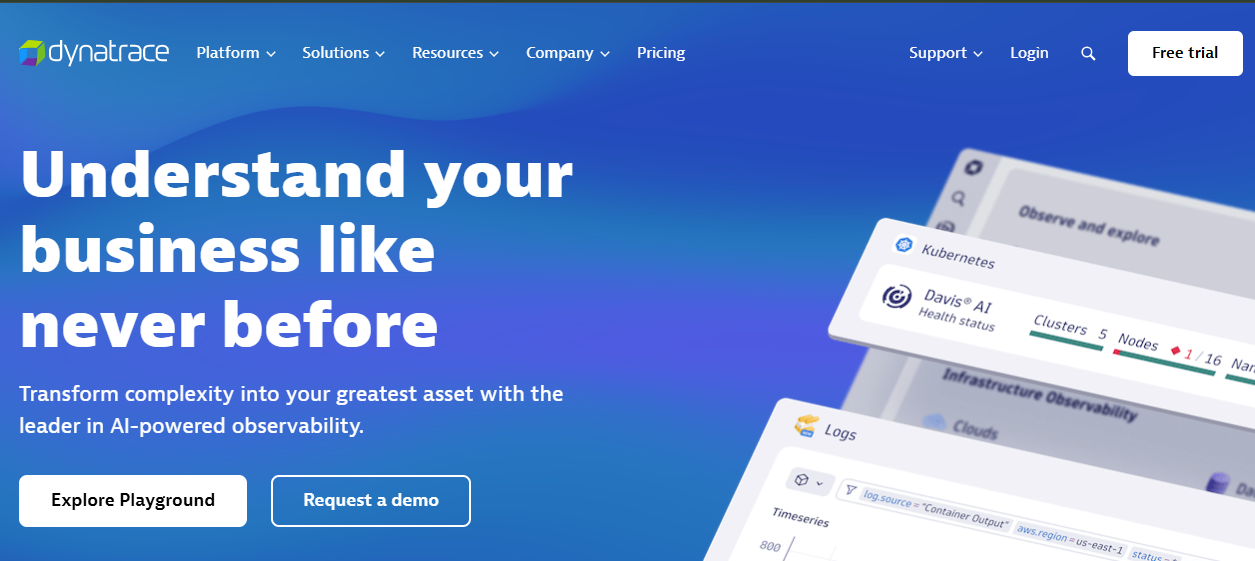
Dynatrace is an enterprise-grade, AI-first observability platform famous for combining full-stack observability, automated root-cause analytics, and robust security controls into a single pane. Its “OneAgent” auto-instruments microservices, infrastructure, and user sessions, while its Davis AI engine delivers context-aware insights, making it highly appealing to large-scale operations teams managing complex hybrid and multicloud environments.
Standout Features
- Automatic Topology Mapping: The Smartscape module dynamically visualizes services, hosts, and cloud components in real time.
- AI-Powered Root Cause Analysis: Davis AI correlates anomalies across metrics, logs, traces, and user sessions to pinpoint problems instantly.
- Built-In Application Security: Includes runtime application protection and automated threat detection as part of monitoring.
- Frontend-to-Backend Insight: Combines Real User Monitoring (RUM) with synthetic tests to surface user-experience degradation proactively.
Key Features
- Unified Observability Stack: Supports metrics, logs, traces, RUM, synthetic monitoring, and security telemetry—all linked through Dynatrace’s deep data model.
- Automatic Layered Instrumentation: OneAgent requires minimal manual setup, instantly discovering and monitoring services, containers, hosts, and apps.
- High-Performance Data Analytics: Powered by Grail, a scalable, index-less lakehouse with fast query capabilities and support for causal AI.
- Contextual Automation and Remediation: AutomationEngine allows conditional workflows—like auto-remediation or alerting—driven by observability insights.
Pros
- End-to-end coverage across observability and security layers
- Hands-off instrumentation and real-time system mapping
- AI-driven problem detection and diagnostics
- Scalable cloud-native analytics platform
- Strong support for hybrid and regulated environments
Cons
- Can be costly as usage grows
- Learning curve
Best for
Dynatrace excels in environments where operations scale across cloud-native, hybrid, or multicloud architectures and need tight automation, security integration, and AI-enhanced diagnostics. Large enterprises or SRE teams managing critical uptime or compliance regimes will benefit most from Dynatrace’s sophisticated, autonomous capabilities.
Pricing & Customer Reviews
- Pricing: infra costs $0.08/hour per 8 GiB host (approx $57.60/host/month); usage-based pricing varies for infrastructure units, synthetic checks, and application security modules.
- G2 rating: 4.5/5
- Praised for: comprehensive AI-driven observability, automation, and real-time diagnostics
- Criticized for: high cost, steep learning curve
Dynatrace vs VMware Aria Operations for Applications
While both platforms offer enterprise-ready observability, Dynatrace brings automation and AI-driven diagnosis to the forefront, whereas Aria excels in high-resolution metric aggregation and custom query analytics. Dynatrace is better suited for teams prioritizing autonomous operations, proactive insights, and security-integrated monitoring at scale.
4. New Relic
Known for
New Relic is an intelligent, AI-enhanced observability platform that unifies full-stack telemetry with developer-centric tools to drive resilience and productivity. It’s noted for embedding AI-powered insights, extensive integration support, and innovative features like eBPF-based application performance monitoring and business observability—all in a highly scalable SaaS environment.
Standout Features
- AI-Powered Observability Platform: Combines compound and agentic AI to surface actionable insights and automate observability workflows.
- Extensive Integration Library: Offers over 780 pre-built integrations to connect quickly with popular cloud, infrastructure, and application tools.
- Agentless Kubernetes Monitoring (eAPM): Uses eBPF for zero-code Kubernetes observability—no instrumentation overhead required.
- Business & Developer Innovation Tools: Includes Pathpoint Plus for user journey modeling and AI-enabled automation across GitHub Copilot and ServiceNow workflows.
Key Features
- Unified MELT Stack with AI Automation: Ingests metrics, logs, traces, frontend RUM, synthetics, and security signals in one AI-driven interface.
- Code-Level Performance Profiling: Offers deep insights and distributed tracing across applications via APM 360 and Transaction 360 tools.
- Cloud Cost Intelligence & Pipeline Control: Teams can manage telemetry spend and control data ingestion with built-in rules and dashboards.
- Service Architecture Intelligence: Visualizes team ownership, service dependencies, and reliability via custom scorecards and dashboards.
Pros
- Rich AI integrations that automate ops workflows
- Broad compatibility across technologies and clouds
- Agentless observability for Kubernetes workloads
- Developer-centered tools for debugging and instrumentation
- Combines telemetry, security, and cost insights in one pane of glass
Cons
- Complex pricing
- No self-hosting or on-prem support; SaaS-only
Best for
New Relic is an excellent fit for large engineering organizations and digital-native enterprises seeking a unified, AI-powered observability platform. It shines for teams that need scalable, intelligent monitoring across front-end, back-end, infrastructure, security, and business workflows, and prefer to work within an advanced SaaS ecosystem.
Pricing & Customer Reviews
- Free: for 100 GB/month ingestion and 1 free full-access user
- Paid: Ingestion-based pricing of $0.40/GB
- G2 rating: 4.4/5
- Praised for: AI insights, integration breadth, and unified telemetry coverage
- Criticized for: Pricing complexity, SaaS-only architecture
New Relic vs VMware Aria Operations for Applications
New Relic elevates traditional observability by layering AI-driven automation, business-centric detection, and no-code instrumentation across experience, application, and infrastructure layers. While VMware Aria offers granular metric analytics and stream processing, New Relic delivers more modern ML tools, broader telemetry sources, and faster developer feedback loops.
5. Grafana

Known for
Grafana is celebrated as the epicenter of open-source observability, known for its unmatched flexibility in crafting custom dashboards that can pull data from virtually any source. It’s the go-to visualization and correlation layer for teams building observability pipelines using Prometheus, Loki, Tempo, or any other telemetry engine, whether self-hosted or cloud-native.
Standout Features
- Composable Data Visualization: Lets you blend metrics, logs, traces, and more from diverse sources into one dynamic, actionable dashboard.
- Open and Extensible Architecture: Supports an expansive ecosystem of plugins and integrations, empowering users to mold observability pipelines to their needs.
- Flexible Deployment Models: Offers choices for cloud-hosted, enterprise-managed, or fully self-hosted deployments to fit operational needs.
- Alerting and Incident Orchestration: Includes rule-based alerting with advanced routing, silencing, and on-call integrations.
Key Features
- Visualization First: Rich time-series charts, heatmaps, geomaps, tables, and annotations that encourage fast insight discovery.
- Native MEL Stack Support: Seamlessly pairs with Prometheus for metrics, Loki for logs, and Tempo for tracing.
- Configuration as Code: Dashboards, alerts, and data sources can be defined in YAML/JSON and versioned via Git workflows.
- Advanced Access Controls: Offers robust role-based access control, user authentication, and audit logs for governance.
- Marketplace Ecosystem: A rich library of pre-built dashboards, plugins, and templates saves setup time and enhances flexibility.
- AI & Cost Insights: Grafana Cloud adds anomaly detection, cost monitoring, and SLO management with minimal manual configuration.
Pros
- 100% open-source with strong OTEL alignment
- Great for custom dashboards and data visual storytelling
- Supports flexible hosting models (OSS, Enterprise, Cloud)
- Extensive plugin and integration ecosystem
- Ideal for self-driven observability architectures
Cons
- Setup complexity
- Support (beyond community-level) is gated behind paid tiers
Best for
Grafana is ideal for platform teams and DevOps engineers who prefer building observability stacks tailored to their environment, relying on open standards and full vendor neutrality. It shines for organizations that want visual flexibility and data ownership more than end-to-end managed observability workflows.
Pricing & Customer Reviews
- Free: Fully self-managed, no cost.
- Grafana Cloud Free: for 10K active series, 50 GB logs/traces, and ingress for RUM, synthetics, and testing.
- Pro & Enterprise Plans: Pro starts at $19/month; Enterprise: around $25,000/year
- G2 rating: 4.5/5
- Praised for: visual power, deployment flexibility, and plugin ecosystem
- Criticized for: Difficult setup
Grafana vs VMware Aria Operations for Applications
Grafana empowers users to craft observability pipelines from open tools like Prometheus, Loki, and Tempo with fully customizable dashboards. For teams wanting full control, vendor-independent dashboards, and infrastructure observability on their own terms, Grafana provides unmatched flexibility, though at the cost of setup complexity.
6. Elastic Observability
Known for
Elastic Observability is the go-to solution for organizations that prioritize powerful search, log analytics, and AI-driven insights across their telemetry data. Built atop Elasticsearch and its rich query language, the platform delivers scalable observability with deep customization and real-time anomaly detection, backed by the flexibility and control favored by DevOps teams and SREs.
Standout Features
- Search-Centric Telemetry Ingestion: Ingests logs, metrics, and traces with full-text search and structured query support through Elasticsearch’s powerful querying engine.
- AI-Powered Observability: Uses machine learning and LLM-based assistants to surface anomalies, propose root causes, and reduce manual triage.
- Native OpenTelemetry Support: Embraces OTLP-based data ingestion and offers production-ready telemetry pipelines without proprietary constraints.
- Elastic Search AI Lake: Scales analysis to petabytes with low-latency search and tiered retention, balancing performance and cost.
Key Features
- Full Observability: Brings together logs, metrics, traces, RUM, synthetic monitoring, APM, and infrastructure insights under one umbrella.
- Extensive Integrations: Connects with hundreds of data sources, including Kubernetes, cloud environments, databases, and CI/CD pipelines.
- Advanced Visualization & Querying: Leverages dashboards, ad-hoc analytics with ES|QL, and machine learning-powered insights from Discover and Kibana.
- Smart Storage Tiers: Automatically moves older or less-used telemetry to warm/cold storage, optimizing storage cost without losing access.
- Enhanced User Experience Insights: Captures RUM, synthetic transactions, and full-stack context in real time to understand user impact.
Pros
- Exceptional search performance over large, unstructured data
- Highly customizable dashboards and alerting
- AI and anomaly detection baked into the platform
- OTEL-compliant and open-source-friendly
- Efficient, large-scale data storage with tiered architecture
Cons
- Complex setup
- Steep learning curve
- Premium support is charged 5-15% of the billing
Best for
Elastic Observability is best suited for engineering organizations that demand full control of their observability data, have scale-oriented telemetry needs, and are comfortable managing their observability infrastructure. It’s particularly valuable when rich search, AI-based anomaly detection, and extensibility are key priorities.
Pricing & Customer Reviews
- Hosted: Starts $99/month
- Serverless: $0.15/GB of data ingested
- Synthetics: $0.0123/test run
- G2 rating: 4.2/5
- Praised for: high-performance log search, flexible dashboards, and rich integrations
- Criticized for: steep learning curve, setup complexity
Elastic Observability vs VMware Aria Operations for Applications
Elastic brings unmatched search power, machine learning insights, and flexible data storage architecture. Aria excels at high-frequency metric analytics via WQL dashboards, but Elastic shines with its full-text search, AI-based root cause suggestions, and open architecture, but at the cost of more hands-on management.
7. Amazon CloudWatch
Known for
Amazon CloudWatch is AWS’s native observability service—tightly integrated into the broader AWS ecosystem—for real-time monitoring of applications, infrastructure, logs, and custom metrics. It shines with instant visibility into AWS resource health, automated alarms, and seamless multi-account insights, making it the backbone for operational observability in cloud-native AWS environments.
Standout Features
- Native AWS Data Aggregation: Captures metrics and logs from EC2, Lambda, RDS, containers, and other AWS services without additional setup.
- Intelligent Operational Insights: Leverages anomaly detection and integrated investigations via Application Signals and Operations Bridge to accelerate incident response.
- Cross-Account Observability: Enables unified monitoring across multiple AWS accounts with centralized dashboards and log queries.
- Metric Streaming: Sends real-time metric data continuously to external analytics tools, data lakes, or SIEMs.
Key Features
- Dashboarding & Alarms: Build consolidated views combining metrics, logs, and events; configure thresholds, composite alarms, and high-resolution alerts.
- Log Analytics & Live Tail: Ingest, store, and query logs with Logs Insights; includes live tailing and metric extraction for urgent debugging.
- Application Signals & ServiceLens: Automatically trace requests, visualize service dependencies, and correlate backend performance with frontend errors and RUM.
- Network & Serverless Monitoring: Offers Container Insights, Lambda Insights, and network health visuals for deep layer observability.
- Feature Experimentation Tools: Includes Evidently for A/B testing, supported by RUM and canary metrics to validate releases.
Pros
- Deep integration with AWS services
- No setup required for AWS-native dashboards and alarms
- Centralizes operational data across accounts
- Powerful log insights and anomaly detection
- Real-time network and application performance visibility
Cons
- Expensive at scale
- Slow performance under load
Best for
Amazon CloudWatch is best for organizations fully committed to AWS, particularly SRE and DevOps teams needing out-of-the-box observability for AWS services, real-time alarms, and centralized insights across accounts. It suits environments where ease of integration and native AWS support outweigh the need for open standards or feature-rich telemetry.
Pricing & Customer Reviews
- Free tier
- Metrics: $0.30/metric/month
- Logs: $0.50/GB ingested
- Synthetics: $0.0012/run.
- Application Signals: Starts at $0.35/GB
- G2 rating: 4.3/5
- Praised for: strong log analytics, real-time visibility for containers and serverless, built-in anomaly detection
- Criticised for: pricing, customization
CloudWatch vs VMware Aria Operations for Applications
CloudWatch offers unmatched AWS-native monitoring and deep resource integration, whereas VMware Aria focuses on high-resolution metric analytics and query flexibility. CloudWatch is the practical choice when monitoring primarily AWS workloads; Aria offers more sophisticated analytics and dashboards, especially for hybrid and containerized infrastructures.
Conclusion: Should You Choose VMware Aria Operations for Applications
VMware Aria Operations for Applications, while powerful in high-cardinality metric analysis, struggles with opaque pricing, integration issues, and UI challenges.
CubeAPM solves this with a simple, predictable pricing of $0.15/GB of ingested data, an effortless and high-performing UI. It integrates with 800+ technologies seamlessly and offers a fully OTEL-native platform, smart trace sampling, and self-hosting support. Book a free demo with CubeAPM.
Disclaimer: The information in this article reflects the latest details available at the time of publication and may change as technologies and products evolve.
FAQs
1. Why are teams moving away from VMware Aria Operations for Applications?
Many teams cite complex and unpredictable pricing, integration difficulty, and UI issues as major drawbacks.
2. What are the best alternatives to VMware Aria Operations for Applications?
Top alternatives include CubeAPM, Datadog, Dynatrace, New Relic, Grafana, Elastic Observability, and Amazon CloudWatch. CubeAPM stands out for its cost transparency, OTEL-native architecture, and full MELT support.
3. Is CubeAPM a good alternative to VMware Aria Operations for Applications?
CubeAPM is a good alternative with features, such as transparent pricing, full OTEL and MELT support, and a self-hosting option, making it scalable, affordable, and compliant with data sovereignty requirements.
4. Does VMware Aria support OpenTelemetry?
Yes, it supports OpenTelemetry ingestion. It requires Wavefront exporters or a proxy to connect OTEL data to your application.
5. Is there a self-hosting solution available as an alternative to VMware Aria Operations for Applications?
Yes. Tools like CubeAPM support self-hosted or BYOC deployments, enbaling full control over data residency, privacy, and compliance.


