SessionStack powers AI-driven digital experience analytics with powerful session replay, real-time UX monitoring, co-browsing, privacy-first PII masking, and seamless integration into web and hybrid apps.
Yet the platform isn’t without friction—users report lagging UX for long session replays, difficulty locating specific recordings, and a lack of built‑in analytics like heatmaps, error aggregation, and performance correlation, making it harder to resolve issues swiftly.
Enter CubeAPM, which is the best SessionStack alternative—delivering full OpenTelemetry (OTEL) support, holistic MELT observability, smart sampling for optimized storage, both SaaS and self-host deployment, transparent, cost-effective pricing, and responsive support—bridging SessionStack’s replay limitations with unified, scalable observability.
In this article, we’ll explore top SessionStack alternatives, evaluating observability breadth, OTel readiness, cost predictability, deployment flexibility, and scalability.
7 Best SessionStack Alternatives
- CubeAPM
- Dynatrace
- Datadog
- New Relic
- Sentry
- SigNoz
- Splunk Appdynamics
Why Are People Looking for SessionStack Alternatives?
Limited Search & Navigation
While SessionStack provides filters (date/time ranges) and custom metadata tagging via its JavaScript Identity API, many users find the process of locating a specific session—especially within long or complex recordings—more tedious than expected. Reviews on G2 mention that finding the right session or pinpointing the exact moment of interest can require extra manual effort.
Sluggish Performance on Long Sessions
SessionStack’s replay interface can take longer to load or navigate when dealing with very long sessions or those containing a high number of user interactions, common in e-commerce, SaaS, or enterprise applications. Users have specifically noted that loading such sessions can be slower than expected, adding friction to daily review cycles. While this does not appear to affect shorter recordings, for high-traffic or complex web apps, it can slow down triage and QA workflows (Capterra)
Criteria for Suggesting SessionStack Alternatives
1. Full MELT Coverage
Alternatives should deliver complete Metrics, Events, Logs, and Traces visibility, going beyond frontend events and replay. This ensures developers, SREs, and product teams can diagnose issues from user action through the backend root cause without juggling multiple tools.
2. Native OpenTelemetry (OTel) Support
With OTel now widely adopted, the ideal alternative should ingest OTLP data natively and operate as an OTel backend. This eliminates proprietary data lock-in and allows seamless instrumentation across frontend, backend, and infrastructure.
3. Predictable & Transparent Pricing
Alternatives should avoid unpredictable, session-based overages. Instead, transparent and predictable models—whether volume-based, host-based, or flat-rate—help businesses budget accurately and avoid bill spikes during high-traffic or incident periods.
4. Flexible Deployment Options
Strong alternatives offer both SaaS and self-host/BYO-cloud deployments. This is essential for regulated industries needing regional hosting, on-premise installs, or air-gapped environments for compliance and data sovereignty.
5. Intelligent Data Sampling
To handle large telemetry volumes cost-effectively, alternatives should support smart sampling, especially at the trace level. This ensures critical diagnostic data is preserved while minimizing unnecessary storage costs.
6. Customer Support Quality & Channels
Alternatives should provide multi-channel support—including live chat, email, documentation, and sometimes phone—backed by responsive SLAs. This is vital for teams relying on fast resolution during outages or onboarding.
7. Desired Observability Features
Alternatives should unify RUM, replay, APM, logs, infrastructure monitoring, and synthetics in one platform. Correlating these in a single pane of glass speeds MTTR and improves cross-team collaboration.
8. Positive & Consistent Online Reviews
Strong G2, Capterra, and TrustRadius ratings, backed by detailed customer feedback, are a reliable indicator of product maturity, vendor responsiveness, and feature reliability. Teams should prioritize vendors with consistently high scores across review platforms.
SessionStack Overview
Known for
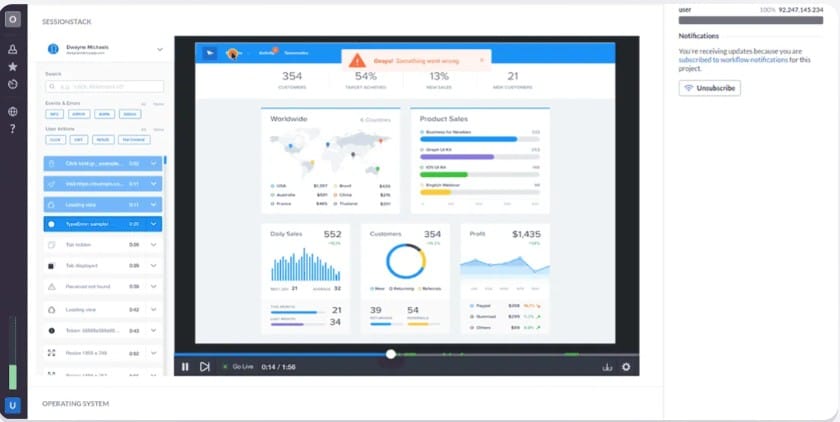
SessionStack is a digital experience analytics platform that comes with features such as session replay, live co-browsing, and frontend error monitoring. It helps product, UX, and support teams understand user behavior, resolve issues faster, and improve customer experience without impacting app performance.
Standout Features
- Good Performance: Records user sessions in real time without slowing down the application.
- Live Co-Browsing: Enables support agents to join a user’s active session for real-time guidance without downloads or plugins.
- Privacy features: Offers PII masking, IP blocking, and selective recording to comply with GDPR and CCPA standards.
- Useful Integrations: Connects with tools like Zendesk, Intercom, and Slack for faster support workflows.
- Error & Session Linkage: Correlates frontend JavaScript errors with exact replay footage for precise debugging.
Key Features
- Session Replay: Captures every user interaction—clicks, form inputs, navigation, and DOM changes—for accurate reproduction of user experiences.
- Frontend Error Monitoring: Detects and logs JavaScript errors, with stack traces linked to replays.
- Co-Browsing Mode: Allows real-time screen sharing with the ability to guide and interact within the user’s session.
- Event Timeline: Provides a chronological breakdown of actions, requests, and errors within a session.
- Selective Recording: Record only relevant sessions (e.g., those with errors) to save storage and focus on critical issues.
- Secure Data Handling: Offers encrypted data transfer and EU-based secure storage to meet compliance requirements.
Pros
- Easy-to-use interface with quick onboarding
- Offers replay, co-browsing, and error tracking
- Strong privacy and security controls for compliance
- Real-time co-browsing without third-party plugins
- Integrations with major support and collaboration tools
Cons
- Session search and filtering can feel tedious at scale
- Session-based pricing may lead to cost spikes during traffic surges
Best for
SessionStack is best for product managers, UX designers, support teams, and frontend engineers who need high-fidelity session replay, live co-browsing, and client-side error monitoring in one platform. It’s particularly suited for SaaS, e-commerce, and customer support environments where understanding the user’s journey in detail is key, but less ideal for organizations seeking full-stack MELT observability or OpenTelemetry integration.
Pricing & Customer Reviews
- Pricing: Custom quote-based, session-volume dependent (no public rate card).
- G2 rating: 4.8/5 (50+ reviews)
- Praised for: Easy setup, minimal performance impact, strong privacy controls, and effective live co-browsing for support.
- Criticised for: performance issues with longer sessions and a lack of transparent pricing.
Top 7 SessionStack Alternatives
1. CubeAPM

Known for
CubeAPM is a full-stack observability platform known for offering native support for OpenTelemetry and MELT coverage, real user monitoring (RUM), and smart sampling. It’s useful for teams that value predictable pricing, deployment flexibility, and compliance-ready data control. It bridges the gap between frontend UX monitoring and deep backend visibility.
Standout Features
- Smart Trace Sampling: Dynamically retains only the most valuable traces (e.g., linked to latency spikes or errors) to cut storage needs without losing diagnostic detail.
- Deployment Flexibility: Offers SaaS, self-hosted, and BYO-cloud deployment to meet compliance and data residency requirements.
- Full MELT Pipeline: Correlates RUM, replay, traces, logs, and metrics in a single view for faster root-cause analysis.
- Transparent Pricing Model: Predictable, volume-based pricing that avoids the overage risks of per-session models.
- Security & Compliance: End-to-end encryption, RBAC, audit logs, and masking options for sensitive data.
Key Features
- RUM: CubeAPM offers real user monitoring (RUM), which includes tracking user interactions and errors in your application.
- Full MELT Observability: End-to-end telemetry ingestion for metrics, events, logs, and distributed traces.
- Custom Dashboards & Alerts: Build tailored visualizations and alert rules for proactive monitoring.
- Synthetics & API Monitoring: Simulate user journeys and test endpoints to catch performance regressions early.
- Integrations & API Access: Works seamlessly with CI/CD pipelines, incident management, and chat platforms.
Pros
- 800+ integrations
- Native OpenTelemetry support
- Complete MELT coverage in one platform
- Flexible deployment options, including self-host
- Cost-efficient with predictable pricing with no egress charges
- Strong data privacy and compliance controls
Cons
- Not suitable for companies looking for SaaS-only platforms
- Doesn’t offer cloud security management features
Best for
CubeAPM is best for engineering, DevOps, and SRE teams that need a single observability platform combining RUM, replay, and backend monitoring, with compliance-friendly deployment and cost predictability. Ideal for organizations adopting OpenTelemetry or replacing fragmented toolchains with one unified solution.
Pricing & Customer Reviews
- Pricing: $0.15/GB of data ingested
- Score: 4.7/5
- Praised for: Full MELT support, high ingest performance, and excellent cost predictability.
CubeAPM vs SessionStack
While SessionStack focuses on frontend session replay and error monitoring, CubeAPM delivers frontend-to-backend observability with full MELT coverage, OTel-native ingestion, and smart sampling, making it better suited for teams seeking unified visibility and predictable scaling.
2. Dynatrace
Known for
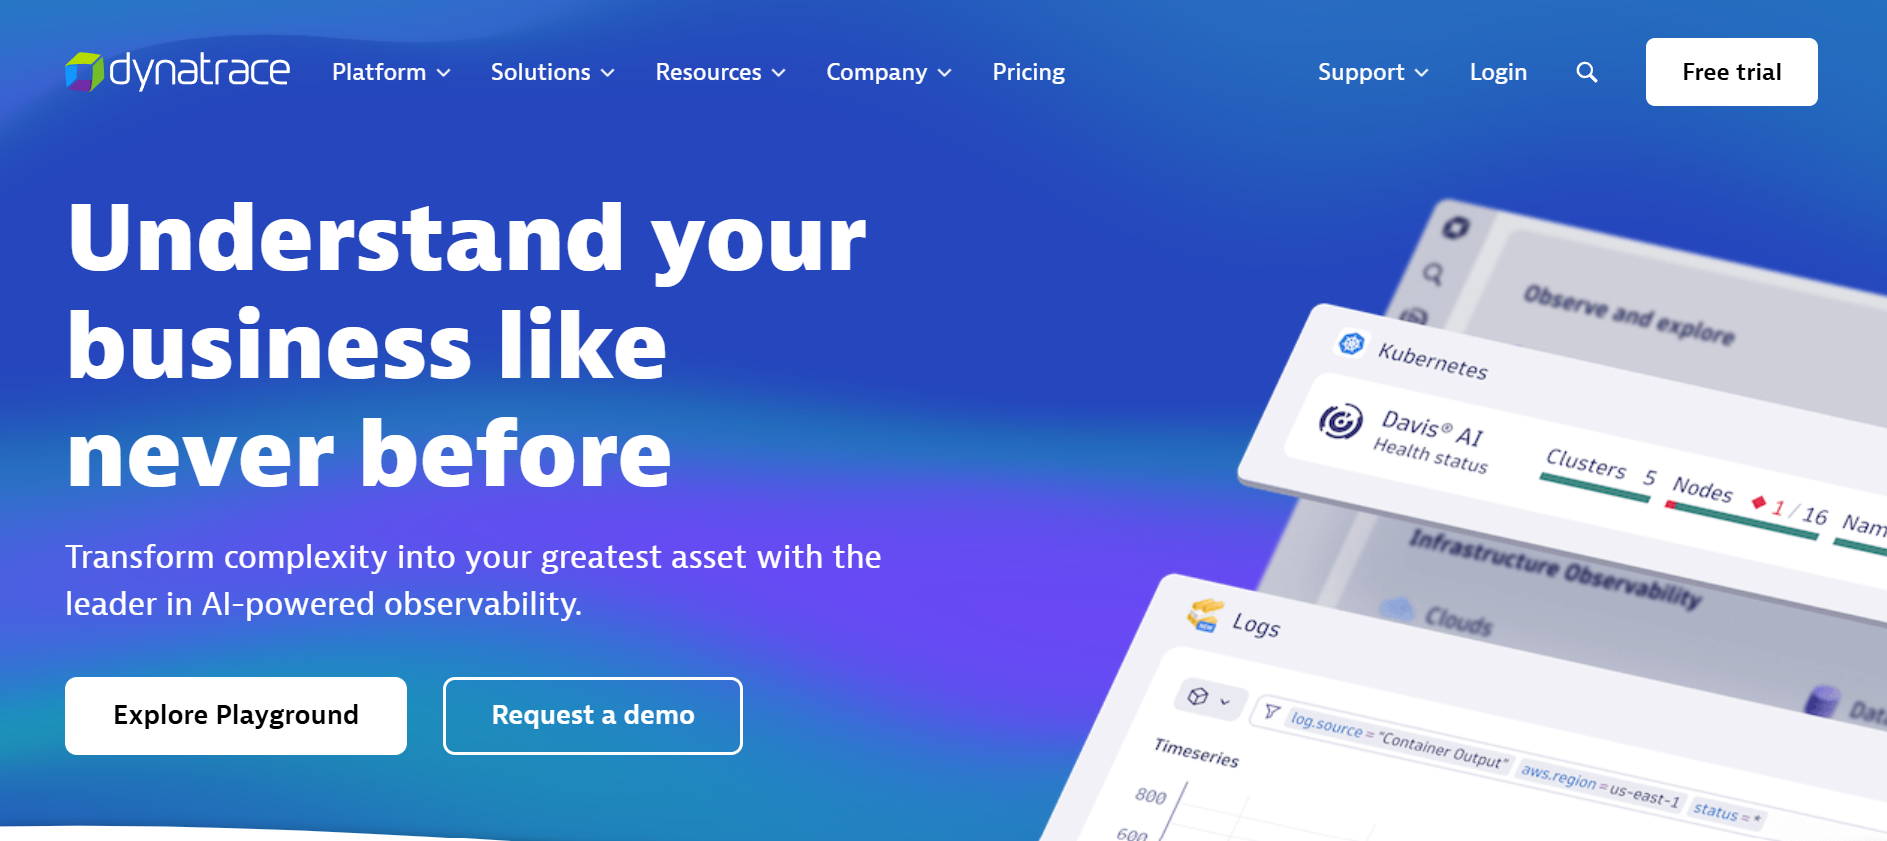
Dynatrace is an enterprise-grade AI-powered observability platform, delivering unified monitoring across applications, infrastructure, user experience, security, and business analytics—especially for modern cloud-native environments. It comes with the Davis AI engine, dynamic topology mapping, and many other features.
Standout Features
- Root cause analysis: Automatically correlates anomalies and pinpoints precise root causes across services using causal AI.
- Smartscape: Visualizes service topology in containers, application layers, infrastructures, etc., in real time.
- Autodiscovery & instrumentation (OneAgent): Deploys automatically to instrument full-stack telemetry with minimal manual setup.
Key Features
- Full-stack observability: Unifies frontend, backend, infrastructure, logs, traces, and metrics—including synthetic and real user monitoring.
- Code-level profiling & tracing (PurePath): Offers deep visibility into function-level performance issues and errors across microservices.
- Developer tools: Dynatrace offers useful tools for developers, such as live debugging, dashboards, IDE plugins, etc.
- Grail: Dynatrace offers log analytics, querying, anomaly detection, and insights.
- Platform extensibility: Custom app building, automation workflows, and a rich extension ecosystem.
Pros
- AI-powered root-cause analysis simplifies troubleshooting
- Fully automated, zero-config instrumentation
- Comprehensive observability across all layers
- Deep code-level insights for developers
- Robust extensibility via apps and automation
Cons
- Steep learning curve due to vast feature set
- Higher cost and complexity can overwhelm small teams
Best for
Dynatrace is best for large enterprise SRE, DevOps, and platform engineering teams that need fully automated, AI-enhanced observability across a modern cloud-native stack—including security, deployment analytics, and performance—organized within a single robust platform.
Pricing & Customer Reviews
- Pricing: full-stack monitoring starts at $0.08/hour per 8 GB host
- G2 rating: 4.5/5
- Praised for: seamless full-stack monitoring, Davis AI’s auto diagnosis, and proactive problem detection
- Criticised for: complexity (learning curve and UI clutter), steep cost for smaller teams
Dynatrace vs SessionStack
Where SessionStack addresses UI-level replay and frontend errors, Dynatrace delivers complete observability with AI-driven diagnostics, infrastructure, tracing, and log insights—ideal for teams seeking deep, automated, full-stack visibility rather than just user replay.
3. Datadog
Known for
Datadog is known as a comprehensive monitoring and security platform that unifies application performance monitoring, infrastructure visibility, log management, real user monitoring, and security analytics. It’s widely adopted for its breadth of integrations, extensive dashboarding, and scalability across multi-cloud and hybrid environments.
Standout Features
- Rich library: 700+ built-in integrations with cloud providers, databases, containers, CI/CD tools, and more.
- Full-stack monitoring: Datadog tracks metrics, logs, traces, RUM, and security telemetry, which means full-stack observability.
- Alerting and anomaly detection: AI/ML-driven alerts with dynamic thresholds and anomaly detection capabilities.
Key Features
- Full-stack observability: Covers backend metrics, distributed tracing, logs, RUM, synthetics, and network monitoring.
- Custom dashboards & analytics: Flexible, interactive dashboards to visualize performance and business KPIs.
- Security monitoring: Detects threats and vulnerabilities across infrastructure and applications.
- Synthetics & API testing: Simulates user journeys and tests endpoints to catch performance regressions.
- Collaboration tools: Native integration with Slack, Jira, PagerDuty, and other workflow tools for faster incident resolution.
Pros
- Comprehensive feature set covering observability and security
- Large integration ecosystem
- Strong visualization and dashboarding capabilities
- Scales well for large, complex environments
- Active development with frequent feature updates
Cons
- Pricing can become unpredictable at scale
- No self-hosting; only SaaS
Best for
Datadog is best for organizations that need a single, scalable platform to consolidate observability and security workflows across applications, infrastructure, and cloud environments. It’s ideal for teams operating at scale that want broad coverage and integration flexibility, though cost management becomes critical as telemetry volumes grow.
Pricing & Customer Reviews
- Pricing: APM starts at $31/host/month; logs: $0.1/GB, Infra: $15/host/month
- G2 rating: 4.4/5
- Praised for: many integrations, observability coverage, powerful visualizations
- Criticised for: High pricing
Datadog vs SessionStack
While SessionStack focuses on frontend replay and error tracking, Datadog delivers a vast observability and security ecosystem spanning metrics, traces, logs, RUM, synthetics, and threat detection—better suited for teams seeking an all-in-one, enterprise-grade monitoring solution.
4. New Relic
Known for
New Relic is known as a unified observability platform that combines application performance monitoring, infrastructure visibility, log management, real user monitoring, and synthetics in one place. It’s designed for engineering teams that want a single platform to instrument, analyze, troubleshoot, and optimize their entire stack.
Standout Features
- All-in-one observability: Offers APM, logs, metrics, traces, RUM, synthetics, and infrastructure data.
- OpenTelemetry: Takes OTLP data directly, supporting vendor-neutral instrumentation strategies.
- Powerful query engine: Provides custom analytics, dashboards, and alert conditions with a flexible query language.
Key Features
- Full-stack APM: Tracks application performance down to code-level transactions and database queries.
- Infrastructure monitoring: Monitors servers, containers, and cloud services with real-time health metrics.
- Log management: filters and correlates logs, and offers search functionality for traces and metrics.
- Synthetic monitoring: Simulates user interactions and API calls to proactively detect issues.
- Alerting and incident management: Intelligent alerting rules with integrations into team communication and ticketing tools.
Pros
- Unified platform with broad observability coverage
- OpenTelemetry support for flexible instrumentation
- Intuitive dashboards and visualizations
- Strong analytics with NRQL for custom insights
- Integrates well into CI/CD and DevOps workflows
Cons
- Pricing can climb with large ingestion volumes
- Some advanced features require deeper NRQL knowledge
Best for
New Relic is best for teams looking for a single pane of glass to manage application, infrastructure, and user experience monitoring, especially those embracing OpenTelemetry. It’s well-suited for organizations that want to consolidate multiple tools into one platform without sacrificing flexibility or analytics depth.
Pricing & Customer Reviews
- Pricing: Ingestion-based pricing of $0.35/GB + $418/user/month for full access
- G2 rating: 4.4/5
- Praised for: comprehensive observability features, excellent visualizations, and strong OpenTelemetry support
- Criticised for: steep costs at higher ingestion rates
New Relic vs SessionStack
While SessionStack focuses on user session replay and frontend error tracking, New Relic provides end-to-end observability with APM, infrastructure, logs, RUM, synthetics, and OTEL-native data ingestion, offering a much broader monitoring scope.
5. Sentry
Known for
Sentry is best known as a robust error monitoring and performance observability platform. It excels at capturing runtime exceptions, logging error context, and helping developers quickly identify and resolve performance bottlenecks and crashes across web, mobile, and backend applications.
Standout Features
- Error Context & Stack Tracing: Instantly surfaces detailed stack traces and environment data linked to user sessions.
- Session Replay & Visual Context: Offers a replay-like view of user navigation, complete with DOM inspection, network requests, and console logs.
- Tracing for Slow Transactions: Detects performance issues and traces slow requests to root causes, like API or database calls.
Key Features
- SDK Support: Offers many SDKs for JavaScript, Python, and mobile platforms to simplify app instrumenting.
- Performance Monitoring: Captures frontend and backend transaction metrics, durations, and traces for awareness of slow flows.
- User Session Context: Ties errors and performance data to individual user interactions for deeper context.
- Integrations: Seamlessly connects with tools like GitHub, Slack, and other incident workflows.
- Alerting & Workflow Automation: Custom alert rules to notify teams via preferred communication channels.
Pros
- Exception tracking with rich context enhances developer productivity
- Easy to set up UI
- Integrated tracing reduces friction in linking performance issues to errors
- Lightweight instrumentation with broad language and framework support
Cons
- Some users report alert configuration complexity
Best for
Sentry is best for software development teams focused on improving application stability and performance, particularly those prioritizing fast error detection, detailed tracing, and contextual debugging workflows across multiple platforms.
Pricing & Customer Reviews
- Pricing: Team: $26/month, Business: $80/month, Enterprise: custom
- G2 rating: 4.5/5
- Praised for: comprehensive error diagnostics, user-friendly UI, and quick integration
- Criticised for: alert noise
Sentry vs SessionStack
Both tools offer frontend visibility via session context, but while SessionStack shines in visual replay and support workflows, Sentry brings richer error analytics and performance tracing—making it better suited for engineering-driven root-cause debugging and reliability workflows.
6. SigNoz

Known for
SigNoz is an open-source observability platform that offers APM, logs, metrics, traces, exceptions, and alerting with OTEL native support. It’s great for teams that want flexibility, more transparency in pricing, and no vendor lock-ins
Standout Features
- Full OpenTelemetry support: Supports full OTLP ingestion and semantic conventions to preserve fidelity without proprietary data transformations.
- Open-source & self-host or managed: Offers a choice between fully managing your observability stack or using Arc-powered SigNoz Cloud.
- High-performance ClickHouse backend: Optimized storage engine for high-scale observability data with fast querying and visualizations.
Key Features
- Unified visibility: Combines metrics, traces, logs, dashboards, and alerts in one place.
- Trace Explorer and Flamegraphs: Dive deep into request flows with span-level breakdowns.
- Infrastructure and application monitoring: Captures core system metrics alongside service-level telemetry.
- Custom alerting & anomaly detection: Trigger notifications based on static thresholds or dynamic conditions.
- DIY queries & dashboards: Build custom data exploration using SQL, PromQL, or ClickHouse query syntax.
Pros
- OpenTelemetry-native architecture gives full signal fidelity
- Open-source flexibility with self-host or cloud deployment
- Cost-efficient storage via ClickHouse design
- Strong correlation across logs, traces, and metrics
- No vendor lock-in; fully mutable and extensible
Cons
- Smaller ecosystem and fewer integrations compared to commercial incumbents
- Limited official customer reviews, reducing public visibility
Best for
SigNoz is best for engineering organizations that value full control over their observability stack, prefer OpenTelemetry-first architecture, and want a unified, high-performance solution that avoids vendor lock-in—especially those comfortable with open-source hosting or exploring flexible cloud options.
Pricing & Customer Reviews
- Pricing: free, paid starts $0.30/GB of logs ingestion
- G2 rating: 4.6/5
- Praised for: OpenTelemetry support and cost-efficiency
- Criticised for: limited external reviews, smaller ecosystem, and infrastructure management overhead
SigNoz vs SessionStack
While SessionStack focuses on frontend replay and error visibility, SigNoz delivers full-stack observability—metrics, traces, logs, alerts—with OpenTelemetry-native ingestion and flexible deployment, making it far more suitable for teams building complete observability pipelines with code-level insights.
7. Splunk AppDynamics
Known for
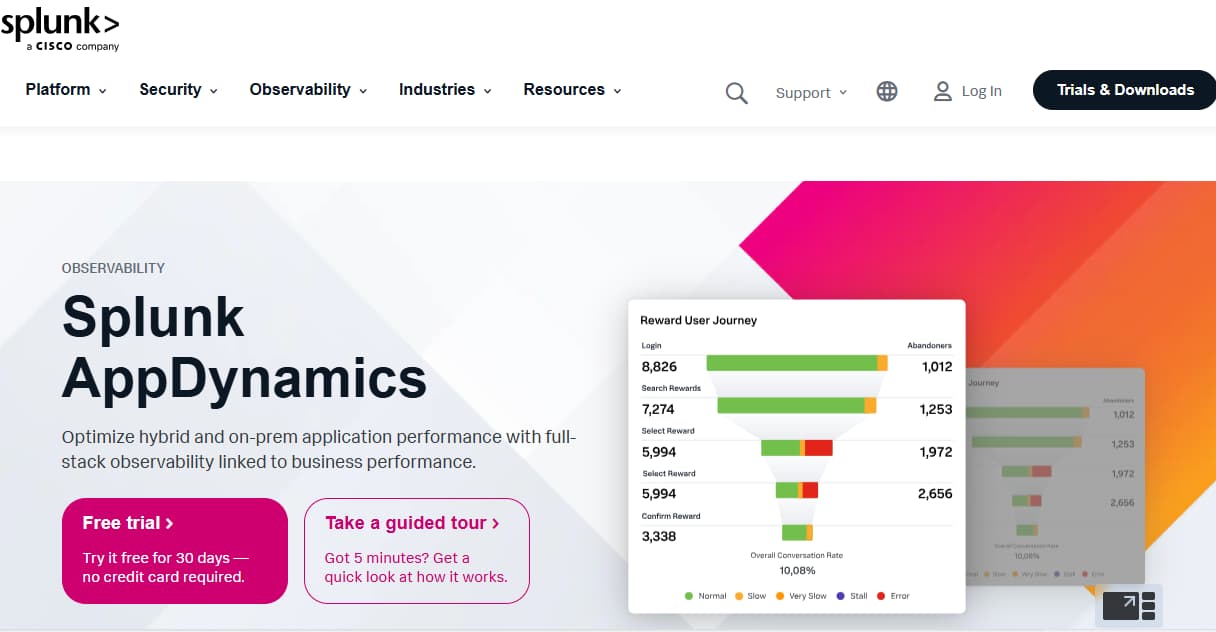
Splunk AppDynamics is known as a robust enterprise-grade full-stack observability and performance management platform, offering deep visibility into hybrid and on-prem application environments, correlated with business metrics and user experience insights.
Standout Features
- Business-centric performance analytics: Automatically correlates application health with key business metrics—like conversion rates or revenue—across complex hybrid infrastructure.
- Anomaly detection and RCA: Uses machine learning to detect deviations from baselines and pinpoint issues across digital services.
- Transaction mapping: Maps business transactions in real time to help you quickly pinpoint slowdowns or failures.
Key Features
- Full-stack observability: Monitors applications, infrastructure, logs, and user experience—including synthetic and digital experience monitoring (DEM).
- Infrastructure visibility for hybrid and SAP systems: Supports on-prem, cloud, and SAP-specific monitoring with comprehensive dashboards.
- Security runtime monitoring: Detects vulnerabilities and runtime threats, linking them to business risks.
- Deep link integration with Splunk platform: Enables seamless navigation between application insights in AppDynamics and full-stack logs or analytics in Splunk.
- Extensible API ecosystem: Offers APIs for automation, metric ingestion, and embedding diagnostic workflows into other tools.
Pros
- Deep business-aligned observability with hybrid environment support
- AI-assisted diagnostics reduce MTTR
- Real-time transaction mapping improves visibility
- Strong support for legacy and SAP systems
- Seamless integration with the broader Splunk stack
Cons
- Can be costly, especially for high-volume environments
- Complexity may require training or dedicated onboarding
Best for
Splunk AppDynamics is best for large enterprise engineering, IT operations, and business performance teams that require deep application-level visibility, hybrid deployment support (including SAP), and AI-enhanced diagnostics, especially when aligned with broader Splunk analytics and security ecosystems.
Pricing & Customer Reviews
- Pricing: ranges $6/month-$50/host/month, billed annually
- G2 rating: 4.3/5
- Praised for: real-time monitoring, maps business transactions, and alerting
- Criticised for: high costs at scale, steep learning curve
Splunk AppDynamics vs SessionStack
While SessionStack focuses on frontend session replay and error monitoring, Splunk AppDynamics offers full-stack, business-context observability, including infrastructure, multi-tier applications, AI-driven noise reduction, and deep platform integration—making it better aligned for complex enterprise monitoring needs.
Conclusion: What’s the Best SessionStack Alternative
SessionStack delivers strong session replay, co-browsing, and frontend error tracking, but it lacks full MELT coverage, OpenTelemetry support, deep backend visibility, and predictable pricing—limitations that can slow root-cause analysis and inflate costs during traffic spikes.
CubeAPM solves these challenges with complete MELT observability, OTel-native ingestion, smart trace sampling to reduce storage by up to 70%, and flexible deployment options including SaaS and self-host for compliance-critical environments. It offers transparent pricing and unifies RUM, replay, traces, logs, metrics, and synthetics in one platform.
If you’re looking to replace SessionStack with a scalable, future-proof observability solution, CubeAPM is the clear choice.
Disclaimer: The information in this article reflects the latest details available at the time of publication and may change as technologies and products evolve.
1. What is the best alternative to SessionStack?
The best alternative depends on your needs, but CubeAPM stands out for offering full MELT coverage, OpenTelemetry-native support, smart sampling, and deployment flexibility—making it ideal for teams seeking unified frontend and backend observability.
2. Why should I switch from SessionStack to another tool?
While SessionStack excels at session replay and co-browsing, it lacks backend metrics, logs, distributed tracing, and OTel integration. These gaps can slow root-cause analysis and require multiple tools, increasing both complexity and costs.
3. Which SessionStack alternative offers the most predictable pricing?
CubeAPM is known for transparent, usage-based pricing that avoids unexpected spikes from session-based billing, especially during seasonal traffic surges.
4. Do any alternatives to SessionStack support self-hosting?
Yes. Alternatives, like CubeAPM, offer self-hosting or BYO-cloud options for compliance and data residency needs.
5. Which alternatives include both replay and backend observability?
CubeAPM, New Relic, and Datadog combine user replay or RUM features with full backend observability, enabling end-to-end monitoring in a single platform.


