Raygun is known for its strong focus on application performance monitoring (APM), real user monitoring (RUM), crash diagnostics, and error tracking. It’s tailored for developers who need fast visibility into errors, slow requests, and frontend issues.
However, Raygun focuses on APM, RUM, crash/error reporting, and not a full-stack observability platform. It doesn’t formally include logs, synthetic testing, or distributed tracing as part of its core platform. Also, Raygun is a SaaS platform with no self-hosting or on-premise deployment, except for a limited local Docker setup only for specific development use cases.
CubeAPM is the best alternative to Raygun, with a modern full-stack observability platform that includes APM, distributed tracing, infrastructure monitoring, error monitoring, log monitoring, and more. It also offers self-hosting to help meet compliance requirements and is cost-efficient. In this article, we’ll explore the 7 best Raygun alternatives.
7 Best Raygun Alternatives
- CubeAPM
- Datadog
- New Relic
- Dynatrace
- Sentry
- Elastic Observability
- Better Stack
Why People Are Looking for Raygun Alternatives
As modern observability demands have evolved—especially in microservices and Kubernetes-based architectures—many teams find Raygun falling short in several key areas.
Lack of Full-Stack Observability
Raygun’s core strengths lie in APM, crash reporting, Real User monitoring (RUM), and error diagnostics. However, it doesn’t offer comprehensive support for infrastructure metrics, centralized logging, or distributed tracing, which are critical pillars of full observability. This makes it difficult for SREs and DevOps teams to correlate an error event with underlying system health or trace its propagation across services.
High Pricing
Raygun uses a modular, usage-based pricing model with separate charges for APM, Crash Reporting, and RUM. Each has its own event caps, and exceeding those may lead to overages or plan upgrades. The pricing starts at $80/month/100,000 traces and goes up to $800/month/1M traces. If you need more coverage, there’s a custom/Enterprise plan. For small teams, it can get costly at scale. Plus, if you need logs and synthetics, you will need to use extra tools, which adds to the overall cost.
SaaS-Only Model
Raygun is exclusively offered as a SaaS platform with no option for on-premise or self-hosting deployments, although there’s a limited local Docker setup only for specific development use cases. This means data goes through their servers, which may not be ideal for some organizations with strict data sovereignty policies. However, Raygun’s official website mentions compliance with GDPR, HIPAA, CCPA, and PCI.
Error Handling Issues
Users on G2 have expressed their concerns about Raygun’s error handling inefficiencies while searching. It could yield similar names, so identifying the correct database can become difficult.
Criteria for Selecting Raygun Alternatives
When evaluating better alternatives to Raygun, teams should look beyond crash analytics and choose platforms that offer enterprise-grade observability, scale, and control. Below are the most important criteria guiding our recommendations:
1. Native OpenTelemetry (OTEL) Support
Modern observability starts with open standards. Platforms with full OpenTelemetry-native support allow teams to instrument once and switch tools without vendor lock-in. This ensures compatibility across languages and environments and aligns with industry best practices.
2. Full MELT Stack Coverage (Metrics, Events, Logs, Traces)
The best alternatives go beyond errors and RUM. They offer complete MELT observability—so teams can correlate logs with traces, monitor system metrics, detect events, and debug faster in distributed systems. Tools that lack even one of these create data silos.
3. Sampling and Efficient Data Retention
Smart sampling ensures that only meaningful, high-value telemetry—like latency outliers, error bursts, or unique transactions—is retained. This drastically reduces ingestion volumes and costs, while preserving insights. Platforms that lack it force teams to overpay or miss critical signals.
4. Flexible Deployment Models (SaaS, Self-Hosted, VPC)
Deployment flexibility is crucial for compliance-heavy industries. The best alternatives offer options to run observability stacks in self-hosted, private cloud, or air-gapped environments. This enables control over data location, retention, and security policies.
5. Transparent and Scalable Pricing
Unpredictable usage-based billing models can wreak havoc on budgets. The ideal alternative offers transparent per-GB or per-host pricing, without hidden fees for seats, modules, or support. Predictability allows engineering teams to plan ahead and scale confidently.
6. Developer-Friendly UI and Powerful Querying
An intuitive interface combined with robust filtering, querying, and visual correlation is key. Teams should be able to drill into traces, logs, and errors without needing to switch tools or write complex queries, especially during incidents or performance bottlenecks.
7. Fast, Reliable Support with Low TAT
Support is mission-critical during outages. The best observability platforms offer real-time channels like Slack, in-app chat, or WhatsApp, with direct access to engineers. Long email-only ticket systems, like those common in legacy platforms, slow teams down when it matters most.
Raygun Overview
Known for
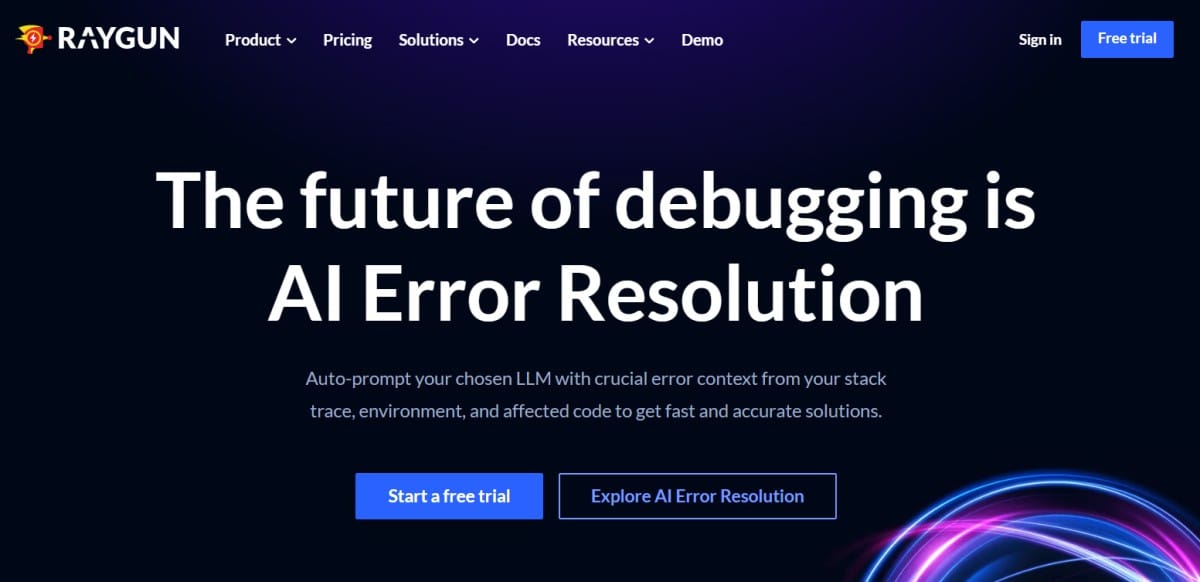
Raygun is best known for its developer-centric approach to real-time crash reporting, error tracking, and frontend performance monitoring through Real User Monitoring (RUM). It supports popular languages like JavaScript, .NET, Ruby, Python, and mobile platforms, offering fast diagnostics with minimal configuration. Raygun appeals to product teams who want to detect and fix bugs quickly, especially in web and mobile applications, without dealing with complex observability tooling.
Standout Features
- AI-Assisted Error Resolution: Automatically analyzes errors using LLMs (like ChatGPT) to identify probable causes and recommend fixes.
- Deployment Tracking via CLI: Correlates new releases with spikes in errors or performance degradation using CLI-based deploy annotations.
- Real-Time Alerts: Sends instant alerts to Slack, Teams, PagerDuty, and other tools, allowing faster incident response.
- User Impact Analysis: Links crashes and errors to affected users and sessions, helping prioritize bugs based on business impact.
- Frontend Performance Breakdown: Measures load times, paint metrics, and asset performance per user session, broken down by device and geography.
Key Features
- Error Monitoring & Crash Reports: Captures full stack traces, environment data, and affected user sessions across web and backend apps.
- Real User Monitoring (RUM): Tracks page load times, user flows, and frontend performance with granular per-session insights.
- Application Performance Monitoring (APM): Provides basic server-side tracing for API latency, database timing, and throughput.
- Issue Grouping & Filtering: Automatically groups similar issues and supports filtering by environment, frequency, or version.
- Integrations: Connects with GitHub, Jira, Trello, Slack, Bitbucket, and more for streamlined developer workflows.
- Simple Agent Setup: SDKs for frontend and backend can be installed in minutes with auto-instrumentation for common frameworks.
Pros
- Lightweight setup and fast onboarding with SDKs for web, mobile, and backend apps
- Intuitive UI and real-time insights make debugging fast and developer-friendly
- Strong integration with CI/CD tools and developer workflows
- User-impact tracking makes it easy to prioritize high-impact issues
- Fast and responsive customer support for most use cases
Cons
- No native support for logs, synthetics, or distributed tracing
- SaaS-only; no option for self-hosting
- Usage-based modular pricing can become costly at scale for smaller teams
- Error handling issues
Best for
Raygun is best suited for product-focused teams, frontend-heavy applications, and mid-sized SaaS businesses that want real-time crash reporting and user monitoring without investing in full-stack observability. It’s ideal for developers who need fast feedback on frontend and backend errors but don’t require advanced logging or synthetics.
Pricing & Customer Reviews
- APM: Ranges $80/100k/month to $800/1M/month
- RUM: Ranges $80/100k/month to $800/1M/month
- Crash Reporting: Ranges $40/100k/month to $400/1M/month
- SAML SSO (add-on): $50/month
- Usage capping (add-on): $40/month
- Free Trial: 14-day trial with access to all core features
- G2 Rating: 4.3/5 (based on 120+ reviews
- Praised for: Clean UI, developer-first setup, responsive support, and real-time alerts
- Criticized for: No logs, high cost
7 Best Raygun Alternatives
1. CubeAPM

Known for
CubeAPM is an OpenTelemetry-native observability platform built to provide comprehensive MELT visibility (Metrics, Events, Logs, Traces) across distributed systems, Kubernetes clusters, and modern cloud-native stacks. It’s particularly known for combining smart sampling, fast deployment, cost transparency, and compliance-friendly hosting options, making it a go-to choice for teams looking to modernize observability without vendor lock-in.
Standout Features
- Smart Sampling Engine: Retains only the most relevant traces using context-aware filters (e.g., latency, errors), reducing ingest volumes by up to 50% while preserving diagnostic fidelity.
- Instant Setup & Agent Compatibility: CubeAPM can be deployed in under 60 minutes and integrates seamlessly with existing agents from Datadog, New Relic, AppDynamics, and Prometheus—easing migration from legacy platforms.
- Slack-Native Support: Offers direct Slack and WhatsApp support channels with engineering teams, boasting under-5-minute TAT, far outperforming ticket-based support systems.
- Flexible Hosting Options: Available as SaaS, on-premise, or VPC-hosted—ideal for teams with data localization or regulatory needs.
Key Features
- End-to-End MELT Observability: Delivers unified dashboards and alerts across logs, metrics, traces, real user monitoring (RUM), synthetics, and error tracking—consolidated into a single pane of glass.
- OpenTelemetry First Architecture: Built entirely on OTEL standards, enabling vendor-agnostic telemetry ingestion and long-term portability.
- Efficient Cost Model: Priced at $0.15/GB with no per-user, per-host, or per-module charges; smart sampling optimizes ingestion volumes to prevent budget overruns.
- Modern Dashboarding & Alerting: Prebuilt service maps, infra dashboards, and support for custom alerts via Slack, PagerDuty, and webhooks help teams visualize and react faster.
- Security & Governance Ready: Supports SSO, RBAC, audit logging, and multi-tenant isolation—making it safe for enterprise environments.
Pros
- 800+ integrations
- Zero cloud egress charges
- Seamless migration from other APM tools using agent compatibility
- Native support for full-stack observability: logs, traces, infra, RUM, and synthetics
- Smart sampling cuts costs significantly without reducing coverage
- Slack-based support with real-time engineer access improves MTTR
- Supports on-prem, VPC, and SaaS deployments
- Transparent and predictable pricing with no hidden costs
- Built natively on OpenTelemetry, avoiding vendor lock-in
Cons
- Not suited for teams looking for off-prem solutions
- Strictly an observability platform, and does not support cloud security management
Best for
CubeAPM is ideal for SRE, platform engineering, and DevOps teams that need flexible hosting, control over telemetry spend, and full-stack observability built on modern, open standards. It’s especially useful for companies operating in regulated industries or managing distributed microservices where MELT observability, performance, and cost predictability are top priorities.
Pricing & Customer Reviews
- Pricing: $0.15/GB for ingestion; includes infra metrics, RUM, synthetics, logs, and error tracking with no per-seat or per-module costs
- G2 Score: 4.7/5
- Praised for: Blazing fast deployment, OTEL-native design, smart sampling efficiency, and responsive Slack-based support
CubeAPM vs Raygun
Raygun provides solid crash analytics and RUM but lacks logs, infra metrics, synthetics, and deployment flexibility. CubeAPM not only covers the entire MELT stack but also lets teams host the platform where they want, with smart sampling and OpenTelemetry-native ingestion to ensure cost control and portability.
2. Datadog
Known for
Datadog is a widely adopted SaaS-based observability platform tailored for cloud-native and distributed systems. Known for its robust ecosystem integrations and real-time dashboards, it helps DevOps, SRE, and SecOps teams monitor applications, infrastructure, and security telemetry in one unified platform. Its strength lies in giving visibility across multi-cloud, Kubernetes, serverless, and containerized environments.
Standout Features
- Extensive Integration Ecosystem: With over 900 native integrations, Datadog connects instantly to AWS, GCP, Azure, Docker, Kafka, Jenkins, and more—accelerating time to value across complex environments.
- Collaborative Notebooks: Enables cross-functional teams to analyze logs, traces, and metrics collaboratively, annotate findings, and document RCA processes during and after incidents.
- Full-Stack Security Modules: Built-in modules like CSPM, container runtime security, and workload scanning allow unified observability and DevSecOps workflows from a single console.
- Session Replay in RUM: Beyond traditional frontend metrics, it records full user sessions for visual playback, helping teams debug issues with actual interaction data.
- Deep Serverless Insight: Offers granular metrics for Lambda, Cloud Functions, and Azure Functions, including cold start detection, error latency, and throttling metrics.
Key Features
- Complete MELT Visibility: Supports metrics, logs, traces, RUM, synthetics, and events—all correlated under a unified platform for faster root-cause identification.
- Auto-Instrumentation Agents: Supports most major programming languages with lightweight agents, enabling quick deployment without deep code changes.
- Cloud-Native Integration: Native hooks into Kubernetes, ECS, GKE, Stackdriver, and Azure Monitor provide near-instant observability for cloud-native workloads.
- Integrated Security Telemetry: Teams can surface misconfigurations, access violations, and container threats alongside performance data.
- CI/CD Monitoring: Connects performance regressions directly to deploys, commits, or CI pipelines—enabling safer releases and faster rollbacks.
- Live Dashboards: Fully customizable with drag-and-drop widgets to track real-time service health, error spikes, or usage anomalies.
Pros
- Huge library of out-of-the-box integrations simplifies setup across complex stacks
- Combines observability and security tooling in one ecosystem
- Collaborative workflows (e.g., Notebooks) support faster incident resolution
- Deep visibility into Kubernetes, serverless, and multi-cloud environments
- Built-in anomaly detection models reduce the manual alerting burden
Cons
- High costs for smaller teams
- Lacks self-hosting support; SaaS-only model
Best for
Datadog is ideal for cloud-native companies running at scale across Kubernetes, multi-cloud, or serverless architectures. Its ability to unify DevOps and SecOps workflows under one pane of glass makes it a powerful choice for enterprise teams prioritizing visibility, scale, and tight CI/CD alignment, provided cost control isn’t a blocker.
Pricing & Customer Reviews
- Infrastructure Monitoring: $15–$34 per host/month
- APM: $31–$40 per host/month (annual), or $36/month on-demand
- Logs: $0.10/GB ingest + $1.70/million events (15-day retention)
- Serverless: $10 per million invocations
- Security Modules: $15–$40 per user/month
- G2 Rating: 4.4/5 (based on 630+ reviews)
- Praised for: Exceptional integration depth, security + observability unification, robust dashboards
- Criticized for: Pricing, no self-hosting
Datadog vs Raygun
Raygun specializes in frontend crash reporting and RUM, making it a strong choice for JavaScript-heavy applications. However, it lacks full-stack MELT observability. In contrast, Datadog offers a far more comprehensive platform with unified monitoring across logs, metrics, traces, synthetics, and security signals. Its 900+ integrations, collaborative RCA tools, and deep visibility into serverless and cloud-native infrastructure make Datadog a better fit for SRE, SecOps, and platform teams managing complex production systems.
3. New Relic
Known for
New Relic is a comprehensive SaaS-based observability platform known for its real-time telemetry analytics, flexible dashboards, and advanced query language (NRQL). It offers full MELT stack visibility and is often favored by engineering and DevOps teams seeking granular control and customizable data visualizations. The platform focuses heavily on real-time performance tracking, dependency mapping, and service correlation in microservice architectures.
Standout Features
- Explorer View for Service Mapping: Auto-discovers your entire application topology—containers, services, and hosts—and visualizes relationships in real time for dependency-aware debugging.
- NRQL (New Relic Query Language): A custom SQL-like language that allows deep querying across metrics, traces, logs, and events—ideal for building tailored dashboards and analytics.
- Lookout for Anomaly Detection: Uses built-in machine learning to detect deviations in error rates, response times, and throughput, prioritizing anomalies and reducing alert fatigue.
- Custom Dashboards for Every Role: Developers, SREs, and product leads can each create purpose-built dashboards using widget libraries, layout logic, and pre-built components.
- Rapid Time-to-Value: With auto-instrumentation and agent-based deployment, most teams get full visibility and actionable data within minutes.
Key Features
- Unified Observability Across MELT: Combines logs, metrics, traces, synthetics, events, and real user data into a single correlated interface for deep incident context.
- Auto-Instrumentation Support: Offers native agents for languages including Java, Python, .NET, Go, Node.js, and Ruby—ensuring quick setup with minimal code changes.
- Cloud & Pipeline Integration: Hooks into AWS, Azure, GCP, Kubernetes, Jenkins, and GitHub for environment-aware and deployment-aware observability.
- Synthetic Monitoring & RUM: Simulates user flows using synthetic tests while capturing real browser/user session data to analyze frontend UX and errors.
- ML-Based Alerting & Baselines: Automatically sets thresholds for alerting based on historical baselines, reducing noise and surfacing anomalies earlier.
- SaaS-Native Experience: No infrastructure management needed—users get real-time telemetry from agent install to dashboard without hosting overhead.
Pros
- NRQL provides advanced flexibility for querying telemetry and customizing dashboards
- Full MELT stack observability with strong visual correlation across telemetry types
- Quick time-to-value with automatic setup and agent-based instrumentation
- Cloud-native integrations support dynamic environments and CI/CD pipelines
- Entity Explorer simplifies service dependency analysis in microservices architectures
Cons
- SaaS-only model; no self-hosting
- Costly at scale; pricing based on ingestion, user seats, and feature add-ons
Best for
New Relic is a great fit for cloud-native engineering teams, especially those building and scaling distributed applications in AWS, Azure, or GCP. It’s especially useful for organizations with microservices architectures that value customizable dashboards, deployment tracking, and real-time analytics via a powerful query engine like NRQL.
Pricing & Customer Reviews
- Free Tier: Includes 100 GB/month ingest and 1 core user
- Ingestion Pricing: $0.40/GB
- Core Users: $49/user/month
- Full Platform Users: $349/user/month based on access level
- G2 Rating: 4.4/5 (from over 500 reviews)
- Praised for: Dashboard customization, advanced query capabilities, rapid SaaS onboarding
- Criticized for: Cost, no self-hosting option
New Relic vs Raygun
While Raygun excels in frontend crash tracking and real user monitoring, New Relic provides full-stack observability across backend services, cloud infrastructure, and frontend UX. Its NRQL engine and ML-powered anomaly detection give it a major edge in data exploration and proactive issue detection.
4. Dynatrace
Known for
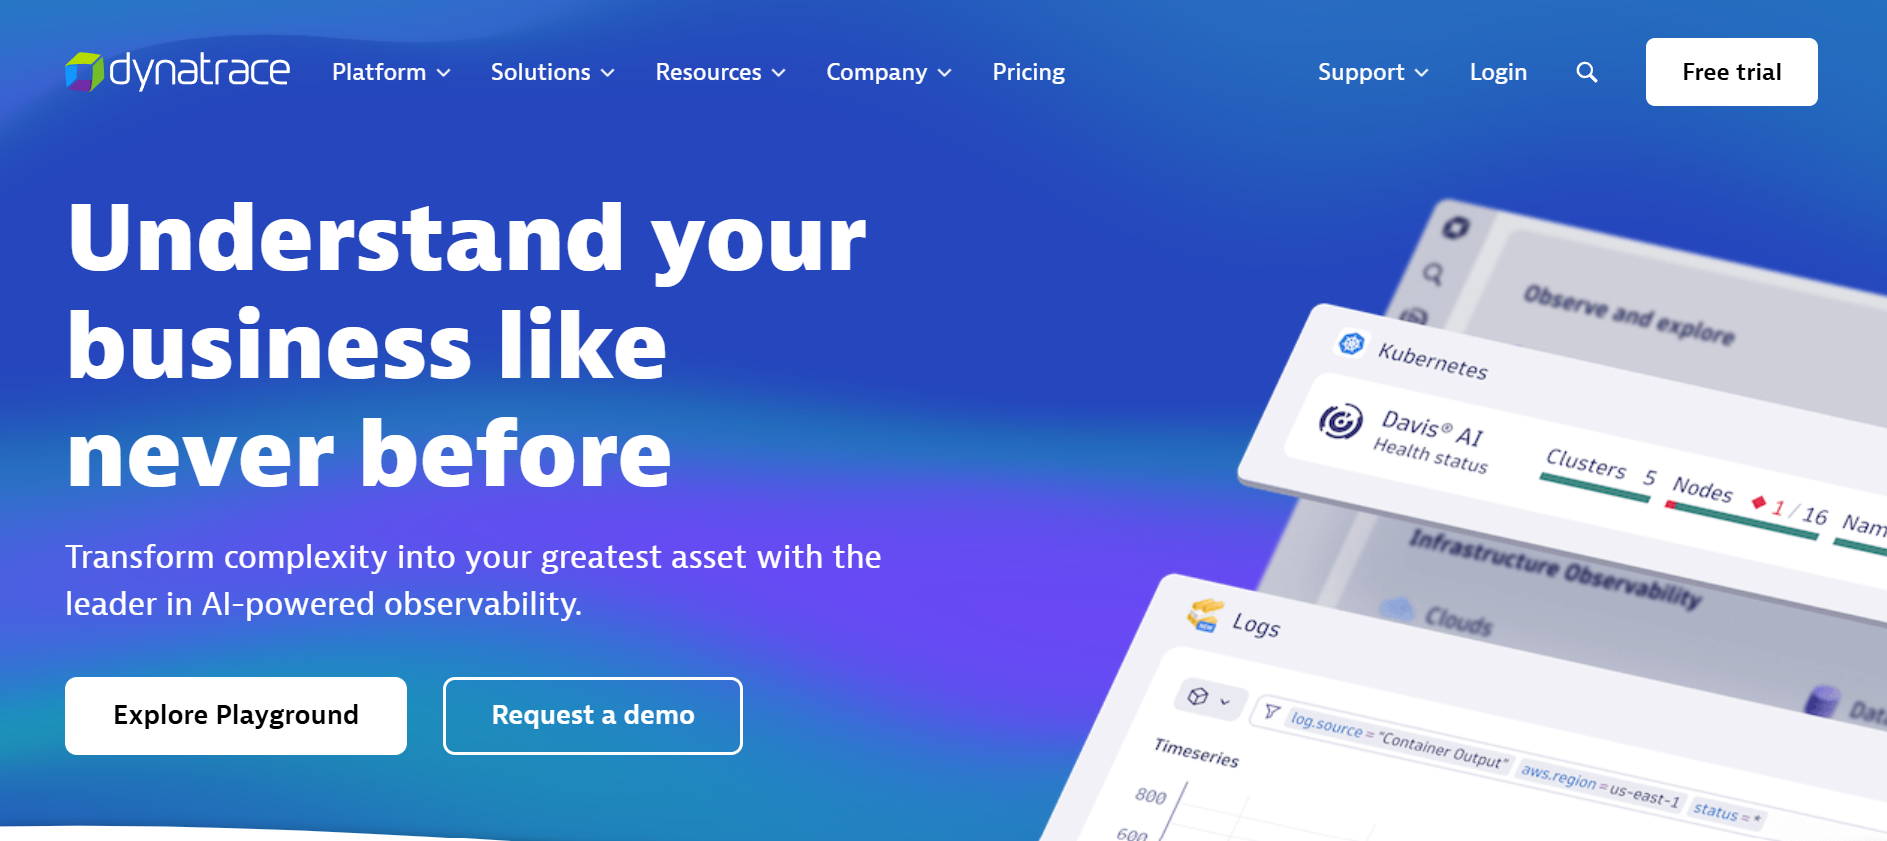
Dynatrace is an enterprise-grade observability and security platform designed for high-scale environments where automation and uptime are critical. It excels in self-discovery, real-time topology mapping, and root cause analysis through its proprietary Davis AI engine. With deep coverage across infrastructure, applications, and runtime security, it empowers large organizations to automate incident triage and maintain visibility across hybrid and multi-cloud stacks.
Standout Features
- Smartscape Dependency Visualization: Builds a continuously updated graph of services, infrastructure layers, APIs, and user flows, helping teams see cross-service relationships and impacts instantly.
- Davis AI Engine for Root Cause Analysis: Analyzes telemetry signals in real time to detect anomalies, suppress noise, and surface the single root cause behind incidents, minimizing alert fatigue.
- Integrated Application Security: Monitors for vulnerabilities and exploits at runtime without additional agents, combining performance and security data for holistic risk analysis.
- Unified Synthetics + RUM Analytics: Merges simulated user journey testing with real user session data, enabling frontend teams to capture both proactive and real-world insights.
- No-Touch Instrumentation: Automatically detects and maps services, dependencies, and Kubernetes workloads without needing manual setup or tagging.
Key Features
- Unified MELT Telemetry: Collects and correlates metrics, logs, traces, real user monitoring (RUM), synthetics, and events in a single UI with consistent tagging and context.
- Real-Time Correlation Across Stack: Maps frontend performance issues to backend services and infrastructure, tracing all the way to code-level method calls and container metrics.
- Cloud & Kubernetes Observability: Deep integrations with AWS, Azure, GCP, and OpenShift offer full visibility into clusters, pods, workloads, and deployment health.
- Built-In Security Monitoring: Provides runtime application protection, misconfiguration alerts, and vulnerability scans—all visualized alongside performance telemetry.
- Scalable for Complex Environments: Automatically scales monitoring across hybrid clouds, data centers, and edge environments with centralized control and agent lifecycle automation.
Pros
- Industry-leading AI capabilities for root cause detection and alert prioritization
- Hands-off setup with automatic instrumentation and service discovery
- Built-in security insights reduce the need for separate AppSec tools
- Comprehensive visibility across legacy, cloud-native, and hybrid stacks
- Visual topology maps simplify the understanding of service dependencies
Cons
- Pricing based on Davis Data Units (DDUs) is complex and costly at scale
- Steep learning curve
Best for
Dynatrace is ideal for large enterprises and mission-critical operations teams managing distributed applications across hybrid or multi-cloud infrastructure. Its automated AI insights, topology visualizations, and embedded security make it particularly useful for organizations that need maximum observability without manual tuning or tool sprawl.
Pricing & Customer Reviews
- Full-Stack Monitoring: $0.08 per 8 GiB host/hour
- Infrastructure Monitoring: $0.04/hour per host
- Kubernetes Monitoring: $0.002/hour per pod
- RUM: $0.00225 per session
- Synthetic Monitoring: $0.001 per HTTP test
- App Security: $0.018/hour per 8 GiB host
- G2 Rating: 4.5/5 (based on 1,300+ reviews)
- Praised for: Intelligent automation, seamless instrumentation, and excellent scalability across complex infrastructures
- Criticized for: Costly, learning curve for new users
Dynatrace vs Raygun
Compared to Raygun, which is focused on frontend crash reporting and RUM, Dynatrace offers significantly deeper backend observability and automation. Its Davis AI engine and topology mapping provide enterprise-scale intelligence that Raygun lacks. However, Dynatrace is more expensive, whereas Raygun remains easier to adopt for small teams needing fast crash insights.
5. Sentry
Known for
Sentry is a developer-focused monitoring tool known for its strength in application error tracking, performance analysis, and release validation. Built to serve modern JavaScript, mobile, and full-stack development teams, it offers rich debugging context, Git-based ownership routing, and real-time alerts. Its tight integration with version control systems helps developers trace regressions back to specific commits or releases with minimal setup.
Standout Features
- Error Grouping with Code Context: Automatically clusters similar exceptions and enriches them with stack traces, environment metadata, and commit history for faster triage.
- Cross-Layer Application Insight: Traces performance issues across frontend frameworks (like React, Vue) and backend services (e.g., Django, Flask, Node.js), all within the same view.
- Git-Aware Issue Assignment: Maps stack traces to source repositories, assigning errors to the right developer or team based on commit ownership and file paths.
- Customizable Sampling Rules: Allows teams to focus on high-latency transactions or business-critical routes by defining custom thresholds and sampling priorities.
- Session Replay (Premium): Records and replays user sessions to help developers visually understand what led to crashes or unexpected behavior in the frontend.
Key Features
- Exception & Stack Trace Monitoring: Captures uncaught exceptions with full backtraces, breadcrumbs, request metadata, and variable states—ideal for deep root cause analysis.
- Distributed Tracing & Transactions: Provides timing data across services, UI events, and backend APIs to help locate slow spans and latency bottlenecks.
- Release & Deployment Tracking: Monitors new releases and ties errors or slowdowns to specific deploys, commits, or PRs—catching regressions as they occur.
- Session Replay & Click Path Analysis: (Available on paid plans) Helps visualize user behavior leading up to a crash, including DOM interactions and page state.
- Integrations & Alerting Hooks: Supports Slack, PagerDuty, GitHub, Jira, and webhooks for automated alerting, ticket creation, and incident routing.
- Broad SDK Support: Ships with SDKs for JavaScript, Python, Java, PHP, Flutter, iOS, Android, React Native, and more—covering most frontend and backend stacks.
Pros
- Highly detailed error context accelerates frontend and backend debugging
- Git-based ownership routing streamlines issue triage and accountability
- Shows release insights, performance data, and crash analytics in one view
- Intuitive UI and low setup effort make it great for product teams
- Flexible integrations support modern developer workflows
Cons
- Error reporting delays
- Costly for small teams
Best for
Sentry is best suited for application developers, frontend engineers, and release teams that want fast debugging, clear code ownership, and integration with Git-based workflows. It’s ideal for teams that prioritize application reliability over full infrastructure observability, especially in frontend-heavy or mobile-first stacks.
Pricing & Customer Reviews
- Free Tier: Up to 5,000 events/month
- Team Plan: Starts at $26/month
- Business Plan: Begins around $80/month (event-based billing); performance and replay sold separately
- G2 Rating: 4.5/5 (based on 100+ reviews)
- Praised for: Fast debugging, GitHub integration, clean UI, and developer efficiency
- Criticized for: Delays in error reporting
Sentry vs Raygun
While both tools focus on real-time error tracking and performance visibility, Raygun is better when it comes to GitOps integration, session replays, and trace-to-code mapping, but Raygun has simpler onboarding and built-in RUM. For teams aiming to tie observability directly to development cycles, Sentry offers a more integrated and developer-friendly experience.
6. Elastic Observability
Known for
Elastic Observability is best known for its powerful centralized log analytics platform built on the ELK Stack (Elasticsearch, Logstash, and Kibana). Widely used for log-heavy environments and infrastructure monitoring, it offers deep customization, fast search capabilities, and flexible dashboards. Its architecture is especially popular among teams that prioritize logging-first workflows and already use Elasticsearch for search or analytics.
Standout Features
- Tail-Based Sampling with Ingest Filters: Enables intelligent trace sampling by applying logic at ingestion time—such as filtering based on error status or duration—helping reduce cost and improve trace relevance.
- Kibana Visualizations: Offers customizable, drill-down dashboards across logs, metrics, and traces, allowing users to build high-fidelity visual insights without relying on external BI tools.
- KQL (Kibana Query Language): Supports fast, full-text search and filter capabilities across massive telemetry datasets, enabling advanced log and metric queries.
- Elastic Common Schema (ECS): Normalizes diverse telemetry sources under a single schema for easier querying and correlation.
- Index Lifecycle Management (ILM): Helps optimize storage by tiering data into hot, warm, and cold phases—automating retention and cost control.
Key Features
- Centralized Log Aggregation: Ingests, indexes, and queries logs from diverse services, systems, and applications in a scalable and efficient manner.
- Infrastructure & Metrics Monitoring: Captures and visualizes time-series metrics for hosts, containers, services, and cloud infrastructure.
- Distributed Tracing via Elastic APM: Tracks backend service latency and dependencies through service maps and transaction timelines.
- Uptime Monitoring: Provides basic synthetic checks to verify service availability and response times.
- Basic Real User Monitoring (RUM): Offers lightweight JavaScript-based browser monitoring, though less detailed than RUM-dedicated platforms.
- Alerting & Anomaly Detection: Combines rule-based and ML-based thresholds to detect metric anomalies and trigger alerts via Slack, PagerDuty, or webhooks.
Pros
- Highly scalable architecture—designed for large-scale log and metric ingestion
- Extensive dashboard and visualization options through Kibana
- Strong query performance and search flexibility with KQL
- Open source core (ELK Stack) fosters wide adoption and community plugins
- Custom index lifecycle controls for fine-grained retention and cost optimization
Cons
- Steep learning curve
- Limited self-hosting (not included in Elastic Cloud)
- Premium support costs extra (5-15% of billing)
Best for
Elastic Observability is best suited for enterprises that have existing expertise in Elasticsearch or are deeply invested in the Elastic ecosystem. It’s ideal for teams focused on log-centric observability and those who can dedicate engineering resources to manage, scale, and fine-tune telemetry ingestion, indexing, and storage tiers.
Pricing & Customer Reviews
- Pricing: Elastic Cloud pricing is based on compute, storage, and retention, not telemetry volume. This can lead to fluctuating monthly bills based on index growth and usage.
- G2 Rating: 4.2/5
- Praised for: High-performance logging, flexible dashboards, and advanced query engine
- Criticized for: Steep learning curve, high premium support cost
Elastic Observability vs Raygun
Raygun offers a more focused experience for frontend crash reporting and RUM, while Elastic excels in log analytics and scalable infrastructure monitoring. For teams needing a developer-centric tool with fast debugging, Raygun is simpler; Elastic is better for those who want powerful log indexing and have the in-house capability to manage its setup and functionality.
7. Better Stack

Known for
Better Stack is a fast-growing developer-focused observability platform offering a unified toolkit for uptime monitoring, log management, tracing, incident response, and status pages. It’s widely embraced by smaller teams and SaaS startups for its simple setup, polished UI, and integrated workflows that replace multiple tools like PagerDuty, Pingdom, and Statuspage.io in one package. Designed for fast-moving teams, it provides a seamless experience without needing to stitch together multiple vendors.
Standout Features
- eBPF-Based Instrumentation: Automatically gathers traces and infrastructure telemetry with zero code changes via eBPF-based OpenTelemetry collectors—great for minimal manual setup.
- Built-In Incident Management & Slack Workflows: Includes on-call scheduling, escalation policies, AI-assisted post-mortems, and noise suppression—all natively managed via Slack or phone/SMS alerts.
- Uptime Monitoring + Branded Status Pages: Offers 30-second checks, heartbeat monitoring, traceroute diagnostics, and customizable public status pages.
- Log Analytics with ClickHouse: Enables fast log and trace queries using a SQL-like syntax, backed by the high-performance ClickHouse engine.
- All-in-One Monitoring Interface: Merges logs, traces, metrics, and uptime into a cohesive UI, reducing tool fragmentation.
Key Features
- Unified Observability Stack: Combines logs, traces, uptime monitoring, and metrics into one interface with linked dashboards for faster issue resolution.
- Install-Free Tracing: Uses kernel-level eBPF to trace performance bottlenecks without requiring SDKs or code instrumentation.
- Alerting & On-Call Management: Offers phone/SMS/Slack alert delivery, escalation chains, and unlimited notifications—removing the need for third-party incident tools.
- Synthetic Testing & Heartbeats: Monitors services using browser-based Playwright tests, heartbeat checks, SSL monitors, and cron job pings.
- Extensive Integration Support: Includes 100+ connectors spanning Datadog, AWS, GCP, Azure, Grafana, Prometheus, Zabbix, and more for data ingestion or alert forwarding.
Pros
- Extremely fast setup with an intuitive UI tailored for developers
- Great free tier with useful limits across logs, uptime checks, and metrics
- Replaces several siloed tools; ideal for reducing SaaS sprawl
- Strong log performance via ClickHouse backend
- Native incident response tooling embedded in Slack workflows
Cons
- No support for self-hosted or on-prem deployment; SaaS only
- Abrupt cost spike from the free tier to paid
Best for
Better Stack is best suited for fast-moving product teams, SaaS startups, and mid-sized developer organizations seeking an all-in-one observability and incident response platform with a minimal learning curve. It’s especially effective for teams that value real-time Slack workflows, uptime checks, and polished dashboards without needing advanced telemetry customization or heavy infrastructure monitoring.
Pricing & Customer Reviews
- Free Tier: Includes 10 uptime monitors, 1 status page, 3 GB logs (3-day retention), 2 billion metrics points (30-day), Slack and SMS/phone alerting
- Paid Plans: Start at $29/user/month with responder capabilities, and expand with telemetry and alerting bundles
- G2 Rating: 4.8/5 (292+ reviews)
- Praised for: User-friendly design, generous free tier, fast setup, and integrated incident response tools
- Criticized for: No self-hosting or on-premise option
Better Stack vs Raygun
Raygun focuses on crash reporting and performance traces, with fine-grained RUM capabilities and Git-integrated debugging. Better Stack delivers a broader range of tools in a single interface – logs, uptime, traces, incident management, and status pages.
Conclusion: Choosing the Right Raygun Alternative
Raygun is excellent for crash reporting and RUM, but it lacks full-stack capabilities, such as logs and synthetics. It’s also a SaaS-only platform, which may not be ideal for every team, especially those who are looking for self-hosting options.
CubeAPM emerges as the most robust and forward-looking alternative to Raygun with full-stack observability, native OpenTelemetry support, and built-in synthetics and error tracking. Its smart sampling engine ensures teams capture the most relevant telemetry while reducing the costs, and self-hosting is useful for regulated industries. Book your free demo now.
Disclaimer: The information in this article reflects the latest details available at the time of publication and may change as technologies and products evolve.
FAQs
1. What are the best alternatives to Raygun for full-stack observability?
Some of the top Raygun alternatives include CubeAPM, Datadog, New Relic, Dynatrace, Sentry, Elastic Observability, and Better Stack. These platforms offer broader MELT observability (metrics, events, logs, traces), OpenTelemetry support, and more functionalities.
2. Why are teams switching from Raygun to other observability platforms?
Many teams are moving away from Raygun due to its limited full-stack visibility, lack of self-hosting, and modular pricing that becomes higher at scale for smaller teams.
3. Is CubeAPM a good alternative to Raygun?
Yes. CubeAPM is one of the best Raygun alternatives. It provides full MELT observability, OpenTelemetry-native instrumentation, smart sampling to reduce data costs, and supports self-hosted and SaaS deployments. CubeAPM is also significantly more affordable, with transparent pricing at $0.15/GB and no per-user fees.
4. Which Raygun alternatives offer real user monitoring and crash analytics?
Platforms like CubeAPM, Sentry, and New Relic offer strong support for real user monitoring (RUM) and frontend performance insights. Sentry is especially developer-friendly for frontend crash debugging, while CubeAPM adds broader observability and cost control to the mix.
5. Are there Raygun alternatives that support self-hosting for compliance needs?
Yes. CubeAPM stands out with its self-hosting and BYOC (Bring Your Own Cloud) options, making it ideal for teams in healthcare, finance, or government sectors. Elastic (open source version) and some hybrid solutions may offer deployment flexibility.


