CockroachDB monitoring tools have become essential as more organizations deploy distributed SQL databases for mission-critical workloads. With outages costing enterprises over $1 million per incident in the past year, teams need deep visibility into node performance, replication lag, and slow queries.
Yet choosing the right CockroachDB monitoring platform remains a challenge due to hidden costs, poor query insights, and limited geo-replication metrics.
CubeAPM, the best CockroachDB database monitoring tool provider, solves these gaps with unified metrics, logs, and traces, built-in CockroachDB dashboards, smart sampling, and predictable pricing.
In this article, we’ll explore the best CockroachDB monitoring tools based on features, pricing, pros and cons, and more.
8 Best CockroachDB Monitoring Tools
- CubeAPM
- Datadog
- New Relic
- Dynatrace
- Grafana Cloud
- DBMarlin
- Instana
- SigNoz
What is a CockroachDB Monitoring Tool?

A CockroachDB monitoring tool is a specialized observability solution designed to track the real-time performance, health, and reliability of distributed CockroachDB clusters. It collects metrics such as query latency, node availability, replication lag, and disk I/O utilization, then visualizes them across nodes, regions, and workloads.
These tools give engineering and DevOps teams deep visibility into how their CockroachDB deployment behaves under varying workloads—helping detect bottlenecks, optimize query execution, and ensure continuous data consistency across clusters. For modern businesses running multi-region databases, CockroachDB monitoring tools are indispensable because they:
- Prevent downtime: Detect node crashes, range splits, and replication failures before they impact end users.
- Optimize cost and performance: Identify inefficient queries, heavy transactions, and underutilized resources through query-level tracing.
- Ensure compliance and reliability: Continuously audit latency, durability, and data locality metrics—key for meeting SLAs in regulated industries.
- Correlate across the stack: Connect CockroachDB performance with application traces, logs, and synthetic tests to reveal full-stack dependencies.
- Accelerate root-cause analysis: By combining logs, metrics, and distributed traces, teams can isolate the exact service or query behind a latency spike in seconds instead of hours.
In essence, CockroachDB monitoring transforms database operations from reactive troubleshooting to proactive optimization—critical for organizations scaling globally distributed SQL workloads.
Example: Detecting Replication Lag and Query Bottlenecks with CubeAPM
Using CubeAPM, the best CockroachDB monitoring tool provider, teams can instrument their clusters using native OpenTelemetry collectors and visualize key database metrics—such as node health, replication latency, and query duration—on unified dashboards. Once telemetry data flows into CubeAPM, its smart sampling engine retains the most meaningful traces (slow queries, failed transactions, or timeouts) while discarding redundant noise, resulting in up to 60% lower data costs compared to legacy APM tools.
For example, if a CockroachDB node in the us-east region begins to lag behind replicas in eu-central, CubeAPM automatically correlates the increase in replication latency with upstream application trace spans and disk I/O logs. Engineers can immediately pinpoint whether the slowdown stems from network congestion, overloaded storage, or inefficient query patterns. From the same dashboard, they can trigger alerts, drill into slow spans, and verify resolution through CubeAPM’s synthetic monitoring and real user monitoring.
Why teams choose different CockroachDB monitoring tools
Cost predictability for multi-region, high-cardinality telemetry
When operating a globally distributed SQL engine like CockroachDB, you’re dealing with a huge number of metrics (node heartbeats, range rebalances, SQL latency per‐range, replication lag per region). Teams often face major price surprises when monitoring tools charge them by hosts or agents and don’t account for this high‐cardinality scale. Offering transparent billing per GB or per ingestion helps mitigate this pain.
OpenTelemetry‐first pipelines that map naturally to CockroachDB
CockroachDB emits traces, logs, and metrics via OpenTelemetry and native exporters. Teams therefore prefer monitoring solutions that support OTLP ingestion directly—so they can plug in SQL spans, replication metrics, and cluster telemetry without proprietary agents or adapter overhead.
Strong correlation: SQL statements ↔ app traces ↔ cluster metrics
For CockroachDB, you need to link slow SQL queries, contention, or replica lag to application traces and infrastructure metrics. Monitoring platforms that let you pivot from “SQL latency high” to the exact query span and then to node disk I/O or network lag win the day—because distributed SQL debugging demands full-stack observability.
Multi-cloud/geographically distributed readiness
CockroachDB thrives in regional clusters and geo-replication zones. Monitoring solutions must surface replica-lag and heartbeat latency per region/zone, and alert when thresholds are breached. Teams running multi-cloud setups favor tools that can handle this operational complexity and surface geo-specific alerts.
Flexible deployment: self-hosted, Prometheus/Grafana, or SaaS
Given the varied compliance and operational models for CockroachDB—on-prem, hybrid, cloud—teams often pick monitoring tools with deployment flexibility. Whether you’re using Prometheus + Grafana, fully-managed SaaS, or a self-hosted stack, the monitoring tool must integrate cleanly with your chosen stack.
Built-in CockroachDB content (dashboards & alerts)
Because CockroachDB has domain-specific concerns (replica distribution, range splits, SQL service latency P90/P99), tools that ship with pre-built dashboards and alerts crafted for these metrics reduce time-to-value. Teams appreciate bootstrapped solutions they can customize rather than starting from scratch.
Billing transparency to avoid surprise overages during scale events
CockroachDB clusters often scale up during migrations, back-fills, or regional expansion. Traditional “host-based” or “user-seat” pricing can spike when node counts temporarily surge. Monitoring tools with predictable usage-based billing help avoid unforeseen costs during these events.
Operational resilience: alerting on the signals that matter for CockroachDB
Teams want monitoring tools that focus on CockroachDB-specific telemetry: sql.service.latency, conn.service.latency, replication.heartbeat, range-rebalance events. The ability to set alerts on these metrics and immediately drill into query/statement views is a differentiator.
8 Best CockroachDB Monitoring Tools
1. CubeAPM
Overview
CubeAPM is an OpenTelemetry-native observability platform known for delivering full-stack visibility across applications, databases, and infrastructure at a predictable cost. Positioned as a next-generation alternative to Datadog and New Relic, it’s widely recognized for its simplicity, transparent pricing, and deep support for distributed systems like CockroachDB. The platform’s unified dashboards and low-latency analytics make it ideal for engineering teams that need to correlate CockroachDB performance metrics—like replication lag, SQL query latency, and node health—with application-level traces and logs in real time.
Key Advantage
Unified observability across metrics, logs, and traces—CubeAPM consolidates all CockroachDB telemetry into a single correlated view, helping teams detect and resolve performance issues faster than traditional siloed monitoring setups.
Key Features
- OpenTelemetry integration: Natively collects CockroachDB metrics, traces, and logs without proprietary agents.
- Query performance insights: Tracks SQL query latency, contention, and slow query trends across nodes.
- Replication and cluster health monitoring: Continuously measures replica lag, node heartbeats, and range rebalancing.
- Smart sampling: Retains high-value traces (errors, latency spikes) while reducing data volume by over 60%.
- Prebuilt dashboards: Offers ready-to-use CockroachDB templates for latency, connection pools, and transaction throughput.
Pros
- Simple ingestion-based pricing with no hidden add-ons
- High compatibility with Prometheus and OpenTelemetry pipelines
- Supports on-prem, cloud, and hybrid deployments
- Instant correlation between CockroachDB performance and app traces
- 24/7 support via Slack or WhatsApp with rapid response times
Cons
- Not ideal for teams preferring fully SaaS-only deployment models
- Focused solely on observability; doesn’t include cloud security or compliance modules
CubeAPM Pricing at Scale
CubeAPM uses a transparent pricing model of $0.15 per GB ingested. For a mid-sized business generating 45 TB (~45,000 GB) of data per month, the monthly cost would be ~$7,200/month*.
*All pricing comparisons are calculated using standardized Small/Medium/Large team profiles defined in our internal benchmarking sheet, based on fixed log, metrics, trace, and retention assumptions. Actual pricing may vary by usage, region, and plan structure. Please confirm current pricing with each vendor.
Tech Fit
CubeAPM integrates seamlessly with CockroachDB clusters running on Kubernetes, GKE, or AWS environments and supports telemetry from Java, Go, Python, Node.js, and .NET services. Its OpenTelemetry collector and Prometheus exporters make it an ideal choice for teams standardizing on modern, distributed SQL workloads and multi-region deployments.
2. Datadog
Overview
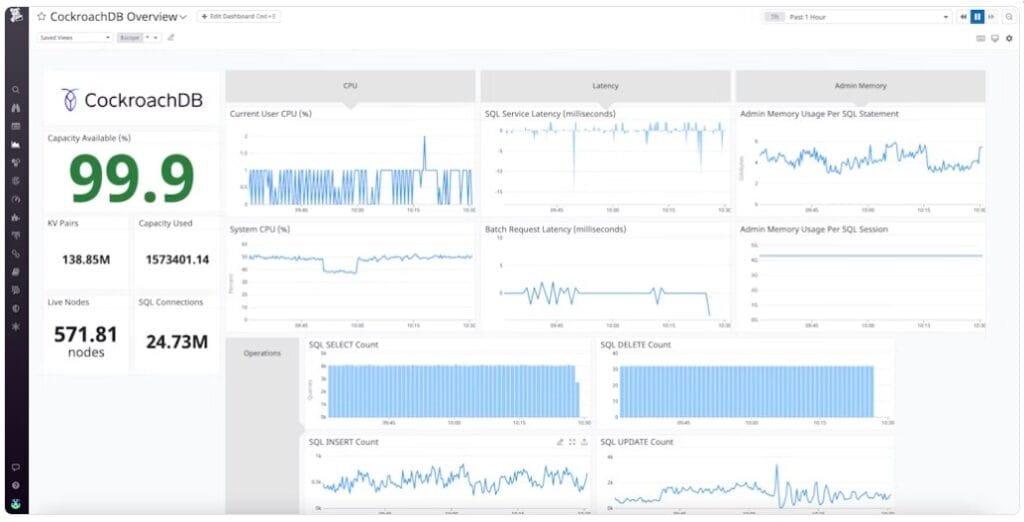
Datadog is a mature observability platform with a first-party CockroachDB integration (self-hosted and CockroachDB Cloud) that auto-collects and visualizes hundreds of CockroachDB metrics for cluster health, SQL latency, and replica behavior—plus built-in dashboards and alerting. It also supports logging SQL activity to Datadog and shipping telemetry with Vector by Datadog, giving teams multiple CRDB-native paths to get data in.
Key Advantage
Deep, ready-made CockroachDB coverage with out-of-the-box dashboards, CRDB-specific metrics, and alerting that slot into existing Datadog APM, infra, and logs workflows.
Key Features
- Self-hosted & Cloud integrations: Monitor CRDB anywhere—self-hosted clusters or CockroachDB Cloud—with native integrations and curated metrics/boards.
- SQL activity to Datadog: Stream sampled SQL events (statements/transactions) directly as logs for workload observability.
- Hundreds of CRDB metrics: Track SQL service latency, node heartbeats, replica health, range activity, and resource usage with OOTB visuals.
- Vector pipeline option: Use Vector by Datadog to filter/sanitize and route CockroachDB telemetry to Datadog or multiple destinations.
- APM correlation: Pivot from database latency to service traces and infra metrics in one place to accelerate RCA.
Pros
- Mature, vendor-maintained CockroachDB integrations and dashboards
- CRDB Cloud support alongside self-hosted clusters
- Strong correlation across APM, infra, logs, and dashboards
- 1,000+ integrations for broader estate coverage
- Detailed cost and usage breakdowns within the product
Cons
- Pricing spans hosts, database hosts, log ingestion/indexing, creating budgeting complexity
- SaaS-only deployment; no option for self-hosting
Datadog Pricing at Scale
For CockroachDB monitoring, common components are Database Monitoring at $70/host/month; APM starts at $31/month; infra starts at $15/month; logs start at $0.10/GB, and so on. For a mid-sized business ingesting around 45 TB (~45,000 GB) of data per month, the cost would come around $27,475/month*. Plus, for database monitoring, it will also cost:
10 DB hosts × $70 (annual rate) = $700/month
Tech Fit
Strong fit for CockroachDB teams already standardized on Datadog APM/Infra/Logs, needing OOTB CRDB dashboards, SQL-as-logs, and cross-stack correlation. Works across Kubernetes and major clouds; supports both self-hosted CockroachDB and CockroachDB Cloud with official integrations.
3. New Relic
Overview
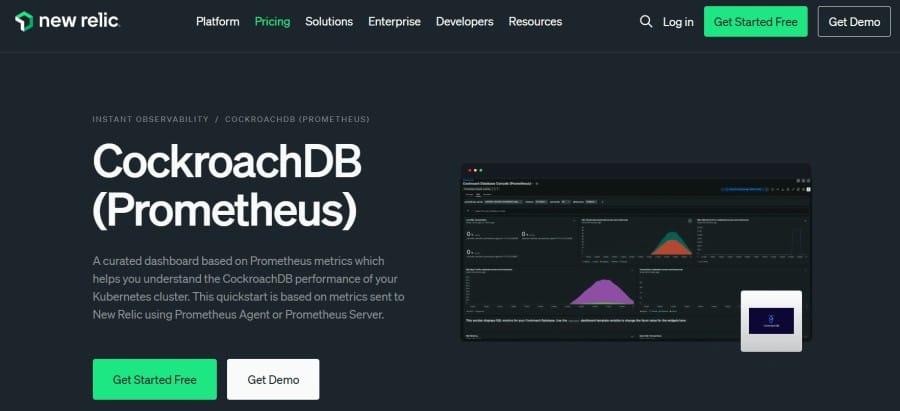
New Relic provides a curated CockroachDB (Prometheus) quickstart with dashboards built from CockroachDB’s Prometheus-exported metrics, plus alerting and pivoting into New Relic APM, logs, and infrastructure. Using the Prometheus Agent or remote write, teams stream CockroachDB cluster signals—SQL service latency, connection metrics, replica health—into a unified workspace alongside app and Kubernetes telemetry.
Key Advantage
Prometheus-native CockroachDB coverage with turnkey dashboards and drilldowns that align to Cockroach Labs’ guidance on essential metrics and SQL activity analysis.
Key Features
- Prometheus ingestion: Accepts CockroachDB’s Prometheus metrics via New Relic’s Prometheus Agent or remote write for zero-friction onboarding.
- CockroachDB quickstart: Curated dashboards that visualize SQL latency P90/P99, connection stats, replica health, and node resource usage.
- Alerting patterns: Rules on service latency and heartbeat/replication signals with routing to on-call and incident tools.
- Correlated troubleshooting: Pivot from metric spikes into APM traces, logs, and infra views for end-to-end RCA.
- Kubernetes alignment: Works cleanly with CRDB on k8s; autodiscovers targets and preserves label context for regions/zones.
Pros
- Strong Prometheus-first path from CockroachDB to New Relic
- Ready-made dashboard content for CockroachDB
- Smooth correlation across APM, infra, and logs
- Useful free tier for initial trials (100 GB/mo)
- Broad ecosystem and guided install options
Cons
- Data ingest is metered; high-volume CockroachDB telemetry can raise cost
- SaaS-only; no self-hosting available
New Relic Pricing at Scale
New Relic’s billing is based on data ingested, user licenses, and optional add-ons. The free tier offers 100 GB of ingest per month, then it costs $0.40 per GB after that. For a business ingesting 45 TB of logs per month, the cost would come around $25,990/month*.
Tech Fit
Ideal for teams standardizing on Prometheus + OpenTelemetry who want CockroachDB dashboards out of the box and tight correlation with application and Kubernetes data. Works well for CRDB on managed Kubernetes or self-hosted clusters where Prometheus is already the metrics backbone.
4. Dynatrace
Overview
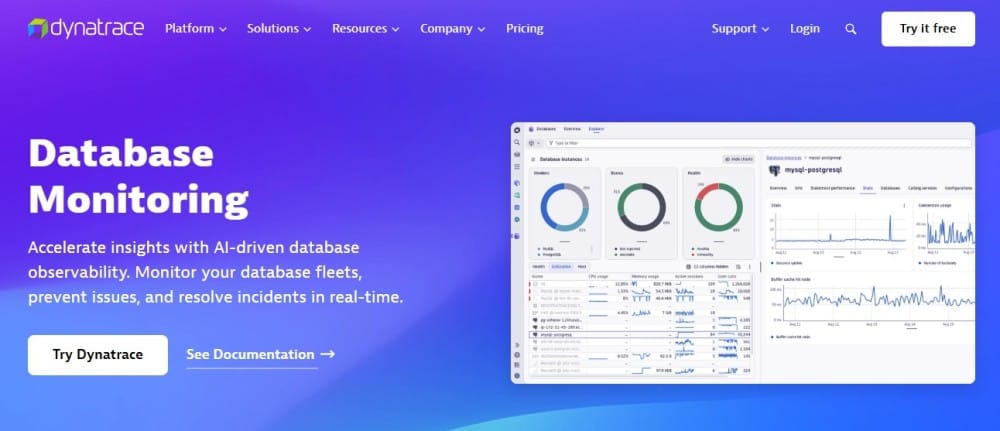
Dynatrace is an AI-driven observability platform positioned for large, complex estates that need automated topology mapping (Smartscape) and Davis AI for anomaly detection across apps, infra, and databases. For CockroachDB, Dynatrace ingests Prometheus-exposed metrics from CRDB (self-hosted or Cloud) and correlates them with application traces and host signals, giving SREs a unified view of SQL latency, replica health, and node performance.
Key Advantage
Automated correlation and anomaly detection on CockroachDB metrics via Davis AI and Smartscape—surfacing replica-lag or SQL latency regressions with service-level root cause paths.
Key Features
- Prometheus ingest for CRDB: Pull CockroachDB’s Prometheus metrics into Dynatrace for charting, alerting, and analysis in Kubernetes.
- Database observability: Track SQL/transaction latency, resource saturation, and availability across database fleets in real time.
- AI-assisted anomaly detection: Use Davis AI to learn baselines on CockroachDB latency and heartbeat metrics and flag deviations proactively.
- Smartscape topology: Visualize service ↔ CockroachDB dependencies to understand blast radius and upstream/downstream impact.
- Geo-aware labeling: Preserve CRDB’s region/zone labels from Prometheus to analyze replica lag and inter-region latency by locality.
Pros
- Strong Prometheus-first path from CockroachDB into Dynatrace
- AI-driven baselining and anomaly detection on database signals
- Automatic service and dependency mapping with Smartscape
- One workspace to correlate CockroachDB metrics with app traces and hosts
- Enterprise controls and detailed usage governance
Cons
- Pricing spans hosts plus log/metrics ingestion, which can add complexity
- Steep learning curve
Dynatrace Pricing at Scale
- Full stack: $0.01/8 GiB hour/month or $58/month/8GiB host
- Log Ingest & process: $0.20 per GiB
For a similar 45 TB (~45,000 GB/month) volume, the cost would be $21,850/month*.
Tech Fit
Best for enterprises standardizing on Dynatrace + Prometheus in Kubernetes, needing AI-assisted detection and auto-topology for distributed SQL. Works for CockroachDB self-hosted and CockroachDB Cloud via Prometheus export, and suits teams who want end-to-end correlation across services, infra, and database health without stitching multiple tools.
5. Grafana Cloud
Overview
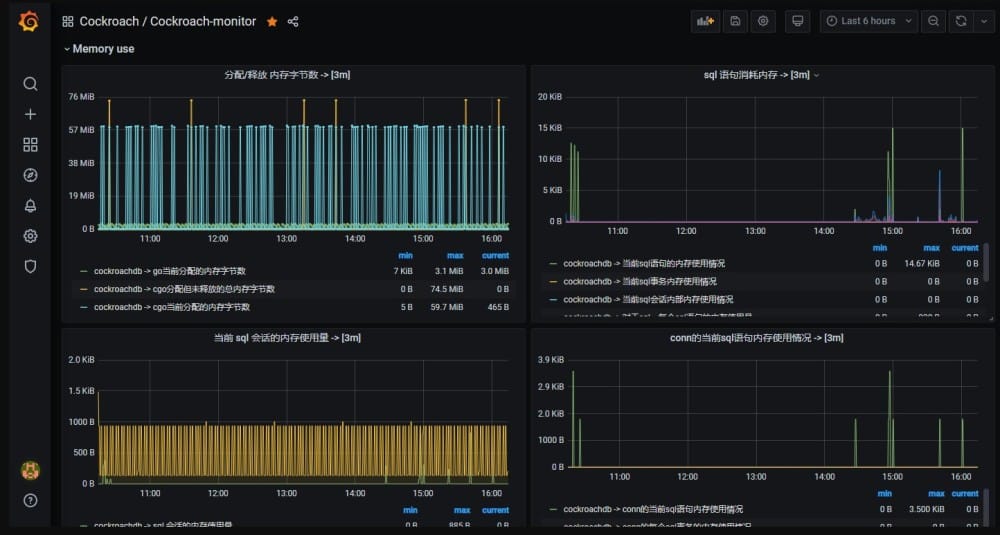
Grafana Cloud is a managed observability platform built around Prometheus, Loki, and Tempo, offering a native CockroachDB integration with prebuilt dashboards, alerts, and metrics visualization. It seamlessly scrapes CockroachDB’s Prometheus endpoint to display cluster-level telemetry—like SQL latency, replica lag, and node uptime—while correlating logs and traces for faster troubleshooting.
Key Advantage
Integrated, Prometheus-first CockroachDB monitoring with rich dashboards and alerting that scale easily from dev clusters to multi-region production deployments.
Key Features
- Native Prometheus integration: Ingest CockroachDB’s
/metricsendpoint directly for database and cluster health tracking. - Prebuilt dashboards: Includes curated CockroachDB dashboards covering runtime, SQL latency, and replication performance.
- CockroachDB data source (Enterprise): Query CockroachDB SQL directly within Grafana for deeper analysis.
- Unified telemetry stack: Combine Loki for logs and Tempo for traces to correlate query slowdowns with backend services.
- Alerting & annotations: Automate alerts for key CockroachDB signals like node availability, heartbeat failures, and replica imbalance.
Pros
- Built-in CockroachDB dashboards and alert rules
- Mature Prometheus support with rich community dashboards
- Scalable for multi-region clusters and hybrid environments
- Flexible telemetry ingestion (metrics, logs, traces)
- Easy integration with existing DevOps toolchains
Cons
- Costs can grow with high-cardinality metrics and log volume
- Complex setup
Grafana Cloud Pricing at Scale
Grafana Cloud pricing is transparent and usage-based (Pro plan adds a $19/month platform fee). Metrics at $6.50 per 1k active series, Logs/Traces/Profiles at $0.50 per GB ingested; Kubernetes Monitoring beyond the included free usage is $0.015 per host hour and $0.001 per container hour.
The free tier includes helpful allowances (e.g., 10k series, 50 GB logs/traces/profiles, 2,232 host hours, 37,944 container hours). For the mid-sized scenario of 45 TB data ingestion, teams may have to pay $11,875/month*.
Tech Fit
Grafana Cloud is ideal for teams already using Prometheus exporters with CockroachDB, wanting hosted dashboards and alert automation without maintaining infrastructure. It suits Kubernetes-based CockroachDB clusters and hybrid setups where Prometheus handles data collection and Grafana Cloud manages visualization, alerting, and incident correlation.
6. DBMarlin
Overview
DBMarlin is a database performance monitoring platform purpose-built for analyzing query performance, wait states, and configuration changes across modern databases. It integrates directly with CockroachDB, using system tables like crdb_internal to visualize query bottlenecks, statement plans, and replication health. Designed for engineering and DBA teams, DBMarlin focuses on deep SQL performance insights rather than full-stack observability.
Key Advantage
Database-centric visibility for CockroachDB clusters, providing granular query diagnostics, execution plans, and wait-state analytics with minimal setup.
Key Features
crdb_internaltelemetry: Reads CockroachDB system catalogs to collect key performance signals and trend data.- SQL & wait analysis: Highlights slow statements, contention, and resource bottlenecks in distributed CockroachDB clusters.
- Root cause drilldown: Enables time-based comparisons to detect regressions after schema or version changes.
- Change detection: Tracks configuration or schema updates affecting query performance.
- CockroachDB best practices: Aligns with Cockroach Labs’ recommended monitoring and alerting model.
Pros
- Built-in support for CockroachDB query analysis and performance tuning
- Intuitive visualizations for SQL statements and wait events
- Works alongside Grafana or Prometheus stacks
- Secure, lightweight deployment with role-based access
Cons
- Focused on database-level monitoring, not full-stack traces or logs
- UI and performance issues
DBMarlin Pricing at Scale
DBMarlin offers two plans based on official pricing:
- Starter (Free Forever): 1 license, unlimited users, full CockroachDB analytics (Top SQL, wait states, explain plans).
- Premium (£960/year ≈ $1,230/year per license): Unlimited licenses and all advanced features.
For a mid-sized organization running 10 CockroachDB nodes, Premium licensing would cost roughly $12,300 per year. Pricing doesn’t scale with telemetry volume—it’s per database node.
Tech Fit
DBMarlin suits CockroachDB engineers and DBAs focused on query optimization and cluster performance who already rely on Prometheus or Grafana for higher-level observability. It’s ideal for self-hosted or hybrid CRDB environments needing deep SQL analytics, without the complexity of large-scale APM tools.
7. Instana
Overview
Instana, part of IBM’s observability suite, delivers real-time, AI-powered monitoring for distributed systems and databases, including CockroachDB. It uses a dedicated CockroachDB sensor that automatically detects clusters, collects metrics, and maps dependencies across your environment using its Dynamic Graph model. This makes it possible to view CockroachDB performance in context with services, APIs, and infrastructure without needing any manual setup.
Key Advantage
Automatic discovery and topology mapping of CockroachDB clusters using IBM Instana’s built-in sensor, powered by Davis AI for anomaly detection and root-cause analysis.
Key Features
- CockroachDB Sensor: Instana auto-discovers CockroachDB clusters and starts collecting metrics such as latency, replica lag, connection counts, and range availability.
- Dynamic Graph Mapping: Visualizes dependencies between CockroachDB, connected applications, and infrastructure for contextual troubleshooting.
- Smart Anomaly Detection: IBM’s Davis AI engine learns performance baselines for CockroachDB nodes and flags deviations proactively.
- Kubernetes Awareness: Correlates CockroachDB metrics with Kubernetes workloads for containerized deployments.
- Continuous Updates: Frequent sensor releases ensure compatibility with the latest CockroachDB versions and features.
Pros
- Zero-configuration setup for CockroachDB monitoring
- Powerful correlation across services, databases, and infrastructure
- AI-assisted anomaly detection and root-cause suggestions
- Secure data collection with enterprise-grade access controls
- Strong integration with IBM Cloud and hybrid observability ecosystems
Cons
- Pricing is based on Managed Virtual Server (MVS) count rather than data volume, which may reduce transparency for ingestion-heavy use cases
- UI issues
- Steep learning curve
Instana Pricing at Scale
Essentials: $20/MVS/month (infra)
Standard: $75/MVS/month (full-stack monitoring)
On-demand: $20/MVS/month (extra for logs and retention); pay-per-use: $0.03/MVS hour/month
For a mid-sized business with 125 hosts or 45 TB of ingestion, the cost can be around $17,375/month*.
Tech Fit
Instana suits enterprises running hybrid or containerized CockroachDB clusters that require automatic discovery, dependency visualization, and AI-driven alerts. It’s best for teams standardizing on IBM Cloud, Kubernetes, or multi-service microarchitecture stacks. For organizations that prioritize simple, ingestion-based pricing and OpenTelemetry-native observability, CubeAPM remains the more cost-effective choice.
8. SigNoz
Overview
SigNoz is an OpenTelemetry-native, open-source observability platform that teams often deploy for cost-efficient, usage-based monitoring. For CockroachDB, SigNoz ingests Prometheus/OTel metrics alongside database logs and traces, then visualizes query latency, node health, and replica behavior in customizable dashboards. It’s a pragmatic choice for engineering orgs that want OSS flexibility with a managed cloud option when needed.
Key Advantage
Transparent, usage-based pricing with an OpenTelemetry-first pipeline that captures CockroachDB metrics, logs, and traces without proprietary agents.
Key Features
- OpenTelemetry pipeline: Collect CockroachDB metrics, traces, and logs through OTel/Prometheus exporters for consistent labeling and correlation.
- Database performance views: Track SQL latency trends, slow queries, and error spikes across CockroachDB nodes and regions.
- Custom dashboards: Build CRDB-specific charts for replica lag, node heartbeats, and range activity with flexible panels.
- Infra + k8s monitoring: Observe CockroachDB on Kubernetes with pod/host metrics side-by-side for faster triage.
- Alerting & routing: Set rules on CockroachDB signals and send notifications to common on-call tools.
Pros
- Open-source option with cloud or self-hosted deployment
- OTel-native ingestion helps standardize CockroachDB telemetry
- Simple usage pricing and a low entry monthly base
- Flexible dashboards for CRDB-specific signals
- Active community and growing ecosystem
Cons
- Deeper CockroachDB tuning content and prebuilt packs are lighter than DB-specialist tools
- Self-hosting adds an operational burden compared to turnkey suites
- Fewer integrations
SigNoz Pricing at Scale
SigNoz Cloud bills logs/traces as per usage; around $0.30 per GB for ingested traces/logs, and $0.10/GB for metrics, plus you may wish to pay extra for add-ons. Using our 45 TB scenario, the cost could be $16,000/month*.
Tech Fit
Best for teams standardizing on OpenTelemetry that want an OSS-friendly stack for CockroachDB with the option to run self-hosted or on SigNoz Cloud. Works well for Kubernetes-based CockroachDB clusters where you need customizable dashboards, straightforward usage billing, and close control of telemetry pipelines.
How to Choose the Right CockroachDB Monitoring Tools
Align with CockroachDB’s telemetry model (Prometheus + OpenTelemetry)
CockroachDB natively exports metrics to Prometheus and supports OpenTelemetry traces and logs. The right monitoring platform should ingest these signals directly—without complex agents or converters—preserving the exact label schema for nodes, ranges, and regions. This ensures every SQL span, heartbeat metric, and latency histogram is captured accurately for long-term analysis.
Cover essential CockroachDB metrics and drilldowns
A capable CockroachDB monitoring tool must capture sql.service.latency, sql.conn.latency, replica.raft.leader.count, and range split activity out of the box. Tools that allow teams to jump from latency spikes to SQL Activity and per-statement performance make troubleshooting faster and more data-driven—especially during large query loads or cluster rebalance operations.
Correlate SQL statements ↔ application traces ↔ node metrics
Distributed SQL performance issues rarely live in isolation. Choose a tool that correlates slow SQL statements with application-level spans and node-level telemetry. For example, a spike in transaction retries might tie back to a network partition or I/O throttling on a single node. Monitoring platforms that provide this three-way correlation shorten root-cause resolution dramatically.
Geo-distributed and multi-cloud readiness
Since CockroachDB is designed for global replication and low-latency locality zones, your monitoring tool should visualize replica lag, region latency, and cross-zone throughput. It should trigger alerts when replica placement drifts from the desired region or when inter-region latency exceeds SLA thresholds—key for maintaining data sovereignty and user experience.
Pricing that matches high-cardinality, bursty clusters
CockroachDB clusters can emit thousands of labeled metrics per node, especially under heavy load or rebalancing. Per-host or per-user pricing models can quickly spiral out of control. Tools offering transparent ingestion-based pricing help teams plan budgets accurately, even during temporary scaling events or seasonal spikes.
Built-in CockroachDB dashboards and alert packs
Look for monitoring solutions that ship with ready-to-use CockroachDB dashboards and alert templates. Preconfigured visualizations for SQL latency, node uptime, and replica counts enable faster deployment and fewer false positives. Teams can then extend these dashboards for business-specific SLIs or capacity planning.
Ergonomic alerting on CockroachDB-specific signals
Generic alert rules on CPU or memory aren’t enough. The right tool must let you set alerts on replication heartbeat latency, SQL contention, and range under-replication metrics. Granular alert configuration with threshold windows and anomaly detection ensures teams catch performance regressions early—without alert fatigue.
Deployment and data-residency flexibility
CockroachDB is often deployed across hybrid or regulated environments, so the monitoring solution should support both SaaS and self-hosted options. Seamless integration with Prometheus or Alertmanager pipelines allows telemetry to remain compliant with regional data governance rules while still offering cloud-level visibility.
Integrations and troubleshooting workflows aligned with CockroachDB operations
Finally, the tool should mirror CockroachDB’s own troubleshooting workflow. Engineers rely on commands like SHOW TRACE FOR SESSION and transaction-level spans; your observability platform should provide one-click pivots from metrics to these traces. Integrations with tools like Grafana, Datadog, or CubeAPM Playground allow teams to visualize performance in real time, execute corrective actions, and validate improvements instantly.
Conclusion
Choosing the right CockroachDB monitoring tool is often challenging because teams must balance real-time visibility, OpenTelemetry support, and predictable costs. Many tools either charge per host, per user, or for each log and trace stored, making long-term scalability complex and unpredictable.
CubeAPM, as an OpenTelemetry-native observability platform, delivers complete visibility into CockroachDB metrics, logs, and traces in one place. With simple $0.15/GB pricing, smart sampling, and deep integration with Kubernetes and Prometheus exporters.
Schedule a FREE demo with CubeAPM today and explore the platform.
Disclaimer: The information in this article reflects the latest details available at the time of publication and may change as technologies and products evolve.
FAQs
1. What should I look for in a CockroachDB monitoring tool?
Look for OpenTelemetry compatibility, Prometheus integration, and real-time visibility into SQL latency, replica lag, and cluster health. These capabilities ensure proactive issue detection and faster root-cause analysis.
2. Does CubeAPM support CockroachDB out of the box?
Yes. CubeAPM provides native integration with CockroachDB metrics through OpenTelemetry and Prometheus exporters. It automatically collects key indicators such as replica health, transaction latency, and node availability in one unified dashboard.
3. How can I monitor CockroachDB performance in Kubernetes?
You can use exporters like cockroachdb-prometheus and connect them to a platform such as CubeAPM, which visualizes CockroachDB performance alongside pod metrics, node conditions, and infrastructure health.
4. Is there a free tool for CockroachDB monitoring?
Some open-source tools offer limited free tiers for basic visualization, but enterprise-grade observability often requires paid plans. CubeAPM’s predictable $0.15/GB pricing ensures advanced features without hidden charges or scaling penalties.
5. Can I correlate CockroachDB metrics with application traces?
Yes. Tools like CubeAPM allow you to correlate CockroachDB performance metrics with distributed application traces and logs—helping identify whether latency issues originate from the database or application layer.


