Apica is a unified observability and digital performance platform that helps enterprises collect, manage, and analyze telemetry data from systems and applications. It is focused on reducing observability costs, improving reliability, and giving teams deeper visibility into performance issues.
However, Apica is not a full-stack observability platform, and some users find its user interface to be not very intuitive. The pricing is also not published on its official website, although users can schedule a demo to explore the platform and its features.
CubeAPM is the best Apica alternative, offering full-stack observability with OpenTelemetry-native ingestion, smart sampling, and flexible self-hosting options. Its predictable $0.15/GB pricing and real-time Slack/WhatsApp support make it cost-efficient. In this article, we’ll explore the top Apica alternatives based on features, pricing, user feedback, and more.
Top 8 Apica Alternatives
- CubeAPM
- Dynatrace
- Datadog
- New Relic
- Grafana Cloud
- Splunk AppDynamics
- IBM Instana
- ManageEngine Site24x7
Why are people looking for Apica alternatives?
Pricing Opacity
Apica does not publish fixed pricing for its paid plans on its official website. Instead, it offers an Ascent Freemium tier that allows teams to process up to 1 TB of telemetry data per month, with unlimited users and dashboards, basic synthetic monitoring checks, OpenTelemetry support, and limited agent fleet management at no cost.
For higher data volumes, advanced capabilities, or enterprise requirements, Apica requires customers to contact sales for custom pricing, which is determined based on usage and organizational needs. Also, customers are routed to sales or a custom ROI tool rather than an open price card, making multi-quarter forecasting and side-by-side cost comparisons cumbersome.
Not a Full-Stack Observability Solution
Apica is not a full-stack observability platform, but an observability data management solution. So, if you’re looking for a full-stack suite with capabilities such as distributed tracing, infrastructure monitoring, and more.
UI Issues
G2 reviewers often describe Apica’s interface as functional but somewhat dated and not very intuitive, with specific feedback noting that parts of the UI (like the SSO page) need redesign and synthetic check configuration options feel limited or unintuitive to customize. Reviewers have said the visual design and user experience “leave something to be desired” and can feel awkward to navigate compared with more modern platforms.
Criteria for Selecting Apica Alternatives
Full MELT Coverage
Pick platforms that unify metrics, events, logs, and traces for instant cross-signal analysis. Unlike Apica’s manual data-fabric setup, CubeAPM offers complete MELT visibility with native OpenTelemetry ingestion.
Transparent and Predictable Pricing
Choose vendors with published, per-GB pricing and no hidden fees. CubeAPM costs $0.15 per GB of data ingested, offering predictable, affordable observability without user or host charges — unlike Apica’s quote-based tiers.
Sampling
Look for adaptive sampling that keeps critical traces (errors, latency spikes) while reducing noise. CubeAPM’s smart sampling optimizes data retention and saves up to 50 % of storage costs.
Deployment & Compliance Flexibility
Top alternatives support SaaS, hybrid, and self-hosted modes with data localization options. CubeAPM’s BYOC and on-prem deployments help teams meet compliance requirements easily.
End-to-End Visibility
Effective observability ties synthetic, real-user, and backend telemetry in one flow. Tools like CubeAPM provide correlated visibility from front-end response to database query in seconds.
Responsive Support & Integrations
Select vendors with real-time engineer access and broad ecosystem support. CubeAPM delivers quick assistance via Slack or WhatsApp and integrates with 800 + cloud and DevOps tools to minimize MTTR.
Apica Overview
Known for
Apica is known for its end-to-end observability and performance monitoring platform that combines synthetic monitoring, API observability, log analytics, and telemetry data pipelines in one solution. It is primarily used by enterprises to test, monitor, and optimize digital experiences across hybrid, cloud, and on-prem environments, helping DevOps teams proactively detect performance issues before they impact users.
Standout Features
- OpenTelemetry-native tracing: Supports ingestion from OpenTelemetry and Jaeger for distributed tracing and correlation.
- Unified observability suite: Combines metrics, logs, traces, and events in one platform under Apica Observe.
- Pipeline-based cost optimization: Uses Apica Flow to route, filter, and replay telemetry data for up to 40% cost savings.
- Infinite retention storage: Apica Lake provides fully indexed object-storage-backed retention for long-term data.
- Synthetic and API monitoring: Apica’s legacy strength remains in active web, API, and SaaS performance testing.
Key Features
- Apica Flow: Centralized control for telemetry routing, reduction, and replay across observability tools.
- Apica Observe: Correlates metrics, logs, and traces with anomaly detection and RCA (root cause analysis).
- Apica Fleet: Manages collectors and agents across environments, automating data collection policies.
- Apica Lake: Single-tier data lake with full-index search and “infinite” retention using object storage.
- Apica Synthetic & API Monitoring: Enables proactive performance testing and uptime validation.
- Apica Alert & Integrations: Delivers alerting to Slack, PagerDuty, Opsgenie, and SIEM/SOAR systems.
Pros
- Unified observability platform combining synthetics, logs, metrics, and traces
- Strong data retention and pipeline customization capabilities
- Supports hybrid and multi-cloud environments with flexible deployment
- Reduces telemetry volume and cost through routing and filtering
- Native OpenTelemetry and Jaeger integrations
Cons
- Pricing is quote-based, not publicly transparent beyond the Freemium tier
- UI issues
- Not a full-stack observability platform
Best for
Apica is best suited for large or regulated enterprises that require deep customization over their observability data pipelines and long-term retention. It fits teams that prioritize synthetic monitoring, API testing, and telemetry cost control, but have dedicated engineers to manage routing, storage, and integrations.
Apica Pricing & Customer Reviews
Apica offers a Freemium plan covering up to 1 TB/month of data ingestion and 10 synthetic checks. Paid plans are quote-based, with pricing tied to daily log ingestion volume and add-ons such as additional synthetics or retention. The ROI calculator claims up to 40 % lower observability costs compared with traditional APM vendors.
- G2 rating: 4.2/5
- Praised for: powerful synthetic monitoring, data retention flexibility, and integration range
- Criticized for: pricing not published, initial learning curve
Top 8 Apica Alternatives
1. CubeAPM
Known for
OpenTelemetry-native full-stack observability (APM, logs, metrics, traces, RUM, synthetics, and error tracking) with predictable, usage-based pricing and rapid deployment across SaaS or self-hosted/BYOC environments.
Key Features
- OpenTelemetry support: Native OTLP ingestion for traces, metrics, and logs with full cross-correlation.
- APM & Distributed Tracing: Code-level insights and visual service maps with instant trace-to-log pivoting.
- Log Monitoring: Centralized log collection, filtering, and indexed search for real-time debugging.
- Infrastructure & Kubernetes Monitoring: Automatic discovery and visualization of clusters, nodes, and workloads.
- RUM & Synthetic Monitoring: Measure frontend performance and simulate user journeys for proactive SLO management.
- Error Tracking & Alerts: Integrated error inbox and instant routing via Slack, Teams, WhatsApp, PagerDuty, or email.
- 800+ Integrations: Works natively with cloud, CI/CD, and DevOps ecosystems for unified monitoring.
Standout Features
- MELT in one platform: Metrics, events, logs, and traces are unified in one view for instant RCA.
- Smart sampling: Context-aware sampling that keeps error and latency traces while cutting repetitive data.
- Predictable pricing: Simple per-GB data ingestion with no user, host, or feature add-ons.
- Self-host/BYOC options: Full data control and compliance-ready deployments for regulated environments.
Pros:
- OpenTelemetry-native ingestion and full MELT correlation
- Transparent pricing model without hidden fees
- 800+ integrations across cloud and DevOps tools
- Smart sampling retains critical traces efficiently
- SaaS or self-host options for total data ownership
- Responsive customer support via Slack or WhatsApp
Cons:
- Not suited for teams looking for off-prem-only solutions
- Strictly an observability platform and does not support cloud security management
Best for
Ideal for cloud-native teams and enterprises that prioritize predictable observability costs, full MELT visibility, and data sovereignty. CubeAPM is particularly effective for Kubernetes, microservices, and multi-tenant systems where scalable tracing and analytics are essential.
Pricing & Customer Reviews
- Pricing: CubeAPM is priced at $0.15 per GB of data ingested, with no extra charges for infrastructure, data transfer
- G2 Rating: 4.7/5
- Praised for: simplicity, affordability, and strong OTEL and K8s support
CubeAPM vs Apica
While Apica focuses on pipeline-based routing and synthetic monitoring, CubeAPM delivers unified MELT observability, smart sampling, and transparent $0.15/GB pricing. It requires no pipeline design to achieve end-to-end correlation, making it faster and more predictable for modern DevOps teams.
2. Dynatrace
Known for
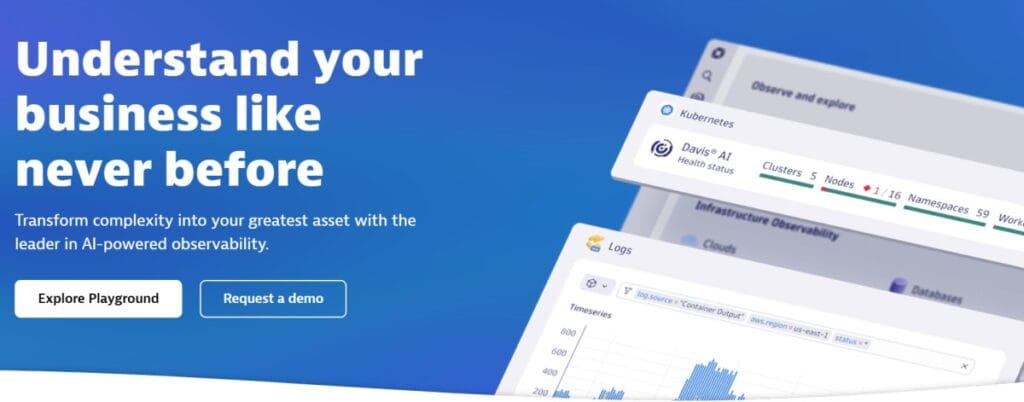
AI-powered unified observability platform delivering application, infrastructure, and digital experience monitoring with automatic discovery and Davis® AI for causal, predictive, and generative analytics across MELT data.
Key Features
- Application observability: Code-level APM for cloud-native and enterprise workloads with automatic instrumentation and real-time insights.
- Infrastructure observability: Full-stack visibility across hosts, containers, processes, and networks with continuous dependency mapping.
- Digital experience: Real User Monitoring (RUM), synthetic monitoring, and Session Replay to track frontend performance and UX.
- Log management & analytics: Context-rich search and analytics powered by Grail, Dynatrace’s data lakehouse for observability.
- Davis® AI & automation: AI engine that identifies root causes, predicts anomalies, and automates remediation workflows.
- Business analytics: Links observability data with business KPIs for customer-impact insights.
Standout Features
- Davis® AI for RCA: Combines causal, predictive, and generative AI for precise answers and automated issue resolution.
- Grail data lakehouse: Merges logs, metrics, traces, and business events in context for instant analytics.
- All-in-one experience analytics: Ties RUM, synthetic, and session replay data directly to backend performance.
- Transparent pricing model: Capability-based pricing published via its rate card, ensuring clarity at scale.
Pros
- Automatic discovery and instrumentation across cloud-native environments
- AI-driven root cause analysis using Davis® and Grail
- Unified MELT signals with digital experience monitoring in one platform
- Scales efficiently for large enterprises with strong governance controls
- Public, detailed pricing rate card for easy capacity modeling
Cons
- Consumption-based pricing requires careful cost planning
- Steep learning curve
Best for
Best suited for large enterprises and hybrid-cloud environments that need AI-driven root cause analysis, automated remediation, and granular observability across the full technology stack. Ideal for organizations running Kubernetes, multicloud, or complex microservices architectures that demand intelligent automation.
Dynatrace Pricing & Customer Reviews
Dynatrace uses a capability-based pricing model, listed on its public rate card. Key examples include:
- Full-Stack Monitoring: $0.01 per GiB-hour of memory
- Infrastructure Monitoring: $0.04 per host-hour
- Log Management: $0.20 per GB ingested, $0.0007 per GB/day retained
- Trace Ingestion: $0.20 per GB processed
- RUM: $0.00225 per session (or $0.0045 with Session Replay)
- Synthetic Monitoring: $0.0045 per browser action or $0.001 per HTTP request
Customer reviews consistently praise Dynatrace’s automation, Davis® AI accuracy, and scalability, though some mention that cost predictability and licensing complexity can be challenging.
- G2 rating: 4.5 / 5
- Praised for: AI precision, automation, and deep integration across MELT data
- Criticized for: Costly, learning curve for new users
Dynatrace vs Apica
Both platforms cover full observability and synthetic monitoring, but Dynatrace stands out for its AI-driven insights, automatic instrumentation, and transparent rate card. In contrast, Apica focuses on data-pipeline control and synthetic testing. Teams that want turnkey automation and precise RCA generally find Dynatrace more scalable and intelligent.
3. Datadog
Known for
A unified observability and security platform that centralizes infrastructure metrics, distributed traces, logs, RUM, synthetics, and application performance monitoring in one place. It’s powered by Watchdog AI and supports 1,000+ integrations across cloud providers, CI/CD systems, and SaaS tools, giving teams deep visibility into every layer of modern environments.
Key Features
- Infrastructure Monitoring: Monitors hosts, containers, serverless functions, and networks with real-time performance metrics and resource utilization.
- APM & Distributed Tracing: Tracks requests across services, detects bottlenecks, and correlates traces with logs, metrics, and deployment events.
- Log Management: “Logging without Limits™” allows decoupled ingestion and indexing with flexible pipelines and storage tiers.
- Digital Experience (RUM & Session Replay): Captures real-user sessions, errors, and page loads, linking them to backend traces.
- Synthetic Monitoring: Provides no-code API, browser, and mobile tests from global and private locations with CI/CD integration.
- Error Tracking: Automatically groups and prioritizes exceptions, enabling faster debugging with integrated context from logs and traces.
- OpenTelemetry Support: Seamless OTel data ingestion and fine-grained sampling for hybrid monitoring setups.
Standout Features
- Watchdog AI: Learns baseline behaviors, detects anomalies, and provides proactive alerts with contextual insights.
- Cross-product correlation: One-click navigation between metrics, traces, logs, and RUM data for unified troubleshooting.
- Flex Logs Tier: Enables low-cost log retention and querying for long-term analytics.
- Extensive Ecosystem: Over 1,000 integrations with cloud, DevOps, and security tools for unified observability.
Pros
- Broad coverage across observability and cloud security in a single dashboard
- Highly mature alerting, dashboards, and visualization capabilities
- Excellent integration ecosystem for cloud, CI/CD, and on-prem environments
- Supports OpenTelemetry for vendor-neutral instrumentation
- Strong automation and anomaly detection with Watchdog AI
Cons
- Pricing complexity due to multiple billing units (hosts, containers, GBs, users, sessions)
- No self-hosting; ony SaaS
Best for
Ideal for DevOps and enterprise teams looking for an all-in-one SaaS solution for observability, APM, security, and digital experience monitoring. Datadog is particularly effective for organizations running multi-cloud architectures, microservices, and Kubernetes workloads that require rich integrations and AI-driven analytics.
Pricing & Customer Reviews
Datadog follows a tiered, usage-based pricing model published publicly on its pricing page.
- Infrastructure Pro: $18/host/month (monthly)
- Infrastructure Enterprise: $27/host/month
- APM: from $31/host/month
- Logs: $0.10/GB ingested; indexed logs start at $1.06 per million (3-day retention)
- RUM: $0.18 per 1,000 sessions
- Synthetics: API tests $6 per 10,000 runs; Browser tests $15 per 1,000 runs
- G2 rating: 4.4 / 5
- Praised for: exceptional integrations, intuitive dashboards, and a powerful alerting system
- Criticized for: high pricing at scale, SaaS-only deployment
Datadog vs Apica
Both Datadog and Apica deliver advanced observability, but Datadog offers broader coverage across infrastructure, security, and digital experience monitoring, backed by 1,000+ integrations and Watchdog AI for anomaly detection. In contrast, Apica focuses more narrowly on synthetic and API observability with pipeline-level data control. Teams seeking a turnkey, full-stack SaaS observability solution often find Datadog a more scalable and integrated option.
4. New Relic
Known for
Usage-based full-stack observability with APM, logs, infrastructure, RUM, synthetics, and business observability (Pathpoint), underpinned by NRDB/NRQL for fast, query-driven analysis and clear pricing anchored to data ingest.
Key Features
- Application Monitoring (APM): Distributed tracing, service maps, error analytics, deployment markers, and code-level diagnostics
- Infrastructure Monitoring: Hosts, containers, Kubernetes, networks, and cloud services with health maps and alerts
- Log Management: Centralized pipelines, querying, correlation to traces/metrics, and retention controls
- Browser & Mobile RUM: Core Web Vitals, errors, session data, session replay, and performance by region/device
- Synthetics: API and browser checks from global and private locations with CI/CD workflows
- Pathpoint (Business Observability): Business journeys and KPI impact mapped to technical signals for customer-impact insights
Standout Features
- NRQL + NRDB engine: Fast, flexible querying and dashboards that make ad-hoc analysis straightforward
- 100 GB/month free ingest: Transparent on-ramp, then usage billed by GB for predictable scaling
- All-in-one platform scope: APM, infra, logs, RUM, synthetics, and business KPIs in one place
- OpenTelemetry support: Ingest OTLP data and correlate with native agents and signals
Pros
- Broad, cohesive product surface across APM, infra, logs, RUM, and synthetics
- Clear, usage-based pricing anchored to data ingest
- Powerful NRQL queries and easy dashboarding
- Mature ecosystem and onboarding resources
- Strong correlation flows between traces, logs, and user experience
Cons
- Costs can climb with very high ingest volumes and long retention
- SaaS-only; no self-hosting
Best for
Teams that want query-friendly, usage-based observability across apps, infrastructure, logs, and digital experience—with the option to tie business KPIs to technical telemetry via Pathpoint. A good fit for organizations standardizing on OpenTelemetry and seeking predictable ingest-based budgeting.
Pricing & Customer Reviews
- Pricing: New Relic includes 100 GB of data ingest per month free; usage beyond that is $0.40 per GB. Unlimited basic and core users are available, with one full-platform user included on the free tier; paid editions add more capabilities and full-user seats.
- G2 rating: 4.3/5
- Praised for: unified platform depth, intuitive dashboards/NRQL, straightforward usage-based pricing
- Criticized for: Costs at very large data volumes, SaaS-only deployment
New Relic vs Apica
Both platforms cover end-to-end observability and synthetics; New Relic stands out for ingest-anchored, transparent pricing, NRQL-driven analysis, and integrated RUM/mobile/browser features, while Apica emphasizes data-pipeline control and an object-storage-centric retention model. Teams prioritizing predictable usage pricing and fast, query-led workflows may prefer New Relic.
5. Grafana Cloud

Known for
An open standards–aligned observability platform built around the LGTM stack—Loki (logs), Grafana (dashboards), Tempo (traces), Mimir (metrics)—with managed services, alerting/OnCall, incident response, and strong OpenTelemetry interoperability.
Key Features
- Metrics (Mimir): High-scale, Prometheus-compatible metrics with pay-as-you-go series and long-term retention controls
- Logs (Loki): Centralized log ingestion and query with pipeline controls and Adaptive Logs for cost efficiency
- Traces (Tempo): Distributed tracing backend with TraceQL and seamless links to dashboards and logs
- Profiles (Pyroscope): Continuous profiling to understand CPU/memory use by code path
- Dashboards & Alerting: Grafana dashboards, Alerting, OnCall, Incident for end-to-end operations workflows
- Integrations: Turnkey integrations for Kubernetes, clouds, databases, and services to speed up setup
Standout Features
- LGTM cohesion: Logs, metrics, traces, and profiles are designed to work together, simplifying cross-signal pivots
- Cost controls: Adaptive Logs and fair-use query policies (for logs) help rein in spend at scale
- Deployment flexibility: Free, Pro (on-demand), and Enterprise tiers, including BYOC/federal cloud options
- OpenTelemetry-friendly: OTLP ingest and OSS alignment make it easy to standardize on open tooling
Pros
- Strong OSS alignment and OpenTelemetry interoperability
- Clear usage-based pricing with a free tier to get started
- Cohesive LGTM stack for cross-signal troubleshooting
- Native OnCall/Incident features for SRE workflows
- Broad catalog of prebuilt integrations and dashboards
Cons
- Complex setup
- Learning curve
Best for
Teams that want open, OTel-friendly observability with managed convenience—especially engineering orgs standardizing on Prometheus/Loki/Tempo who value transparent pricing, cost controls, and fast onboarding for Kubernetes and cloud services.
Pricing & Customer Reviews
- Pricing: Logs: Free 50 GB/month, 14-day retention; Pro: $0.50/GB ingested with a $19/month platform fee that includes 50 GB and 30-day retention; Enterprise: custom pricing; Traces: Free 50 GB/month; Pro: $0.50/GB ingested; Profiles: Pro at $0.50/GB ingested; Metrics: $6.50 per 1,000 billable series (low-res)
- G2 rating: 4.6/5
- Praised for: open-source alignment, powerful dashboards, predictable usage pricing
- Criticized for: learning curve
Grafana Cloud vs Apica
Both provide broad observability, but Grafana Cloud leans on the LGTM stack and open standards with clear usage pricing (series/GB) and cost-control features, while Apica emphasizes data-pipeline routing and object-storage retention. Teams prioritizing OSS alignment and managed LGTM may shortlist Grafana.
6. Splunk AppDynamics
Known for
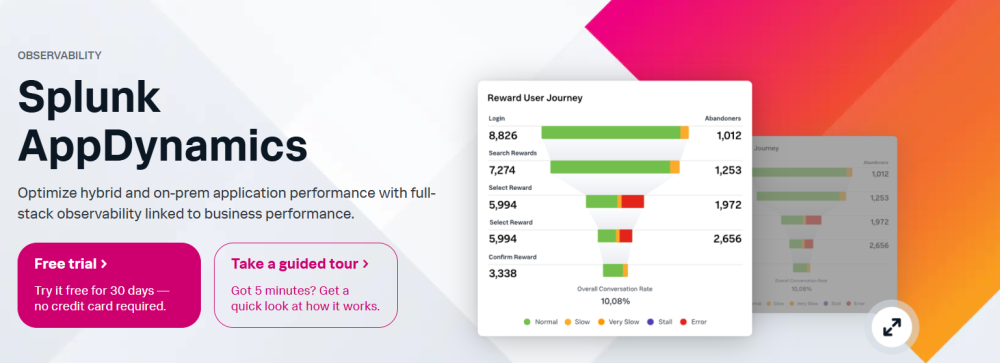
Full-stack application performance monitoring for hybrid and on-prem environments, linking technical telemetry to business performance with features like business transaction monitoring, Digital Experience Monitoring (RUM, mobile, synthetic), SAP visibility, and deep root-cause analysis—plus tight linkage to Splunk log analytics via Log Observer Connect.
Key Features
- Application Performance Monitoring: Code-level diagnostics, automatic topology, business transaction mapping, and AI-assisted anomaly detection.
- Digital Experience Monitoring: Web and mobile RUM, session insights, and synthetic checks correlated to backend performance.
- Business Performance Analytics (Business iQ): Visualize how app performance affects conversions, checkout, revenue, and other KPIs.
- SAP & Enterprise Apps: Deep SAP monitoring (down to ABAP line and DB query) with prebuilt dashboards and KPIs.
- Flexible Data Collection: Agents or OpenTelemetry ingestion; Smart Agent for centralized lifecycle management.
- Hybrid Deployment: SaaS and self-hosted virtual appliance options for regulated or air-gapped estates.
Standout Features
- Business impact correlation: Prioritize and troubleshoot issues by their effect on revenue and critical journeys.
- Log Observer Connect: Context-preserving deep links from AppDynamics into Splunk logs for faster RCA without log duplication.
- Network/Third-party visibility: Isolate ISP, API, SaaS, and network contributors to poor UX (incl. ThousandEyes integration).
- Security in runtime: App security add-on that surfaces vulnerabilities and blocks threats with business context.
Pros
- Strong business-transaction model and code-level diagnostics
- First-class DEM (web/mobile RUM + synthetics) tied to backend context
- SAP and hybrid/on-prem focus for complex estates
- Seamless log drill-downs into Splunk via Log Observer Connect
- SaaS and self-hosted virtual appliance options
Cons
- Slower update cycle
- Alert issues
Best for
Enterprises with hybrid and on-prem applications (including SAP) that need business-aware APM, end-to-end user experience monitoring, and tight alignment between application teams and operations—especially where Splunk is already the system of record for logs.
Pricing & Customer Reviews
- Pricing: Infras: starts at $6 per vCPU/month (billed annually); Premium Edition (Infra + Applications): starts at $33 per vCPU/month (billed annually); Enterprise Edition (adds Business Analytics): starts at $50 per vCPU/month (billed annually)
- G2 rating: 4.3/5 (375+ reviews)
- Praised for: business-transaction visibility, hybrid/on-prem strength, SAP depth, and correlation with Splunk logs
- Criticized for: costly at scale; alert issues
Splunk AppDynamics vs Apica
Both target enterprise observability, but Splunk AppDynamics emphasizes business-first APM (transactions, DEM, SAP) and deep links into Splunk logs, with transparent starting prices by vCPU tier. Apica focuses on pipeline routing, long-term retention, and synthetic/API observability. If your priority is business-impact correlation across hybrid/on-prem apps, AppDynamics is a strong Apica alternative.
7. IBM Instana
Known for
IBM Instana is an AI-driven full-stack observability platform with automatic discovery/instrumentation, 1-second granularity, and “logs in context,” spanning APM, infrastructure, and digital experience monitoring—deployable as SaaS or self-hosted for data control.
Key Features
- Application Performance Monitoring: Code-level visibility, distributed tracing (zero-sampling), root-cause analysis, and “unbounded analytics.”
- Infrastructure Monitoring: Automatic discovery and dependency mapping across hosts, containers, Kubernetes, networks, and mainframe (z/OS).
- Digital Experience Monitoring: RUM plus synthetic tests to detect issues proactively and tie UX to backend health.
- Logs in Context: Correlates logs with traces and metrics to shorten triage time.
- OpenTelemetry Support: Ingest OTel data alongside native agents for flexible instrumentation.
- Intelligent Incident Investigation: Agentic AI to accelerate RCA and incident summaries.
- Automated Resource Optimization: Turbonomic-powered actions to balance performance and cost.
Standout Features
- High-fidelity 1-second data + zero-sampling tracing: for precise insight into microservices and distributed systems
- Edition choice (Essentials / Standard): to match needs—from infra discovery to advanced APM, tracing, and log analytics
- Flexible deployment: with SaaS or self-hosted options for data residency and governance
- Broad technology coverage: (300+), plus unlimited users included with a standard license
Pros
- Automatic discovery and instrumentation across diverse stacks
- High-granularity telemetry (1-second) and logs-in-context correlation
- RUM + synthetics for full digital experience monitoring
- SaaS and self-hosted deployment options for data control
- OpenTelemetry ingestion alongside native agents
Cons
- Can be expensive for smaller teams
- UI issues
- Steep learning curve
Best for
Enterprises that need high-fidelity, automated observability across hybrid and regulated environments—where self-hosting or SaaS flexibility, fast RCA, and logs-in-context materially reduce MTTR. Strong fit for Kubernetes, microservices, and mixed on-prem/cloud estates.
Pricing & Customer Reviews
- Pricing: Starts $20/host/month; on-demand: $0.03/MVS hour/month
- G2 rating: 4.4/5
- Praised for: automated discovery, 1-second granularity, logs-in-context, flexible SaaS/self-host options, broad tech coverage
- Criticized for: UI issues, learning curve
IBM Instana vs Apica
Both deliver broad observability and digital experience monitoring; Instana emphasizes automatic instrumentation, 1-second fidelity, logs-in-context, and flexible SaaS/self-host deployment, while Apica leans into pipeline-first controls and object-storage retention. Teams wanting high-fidelity data with turnkey correlation—and the option to self-host—often shortlist Instana as a strong Apica alternative.
8. ManageEngine Site24x7
Known for
Site24x7 is a unified, SaaS-based full-stack monitoring platform that spans website and synthetics, APM, infrastructure (servers, VMs, containers, Kubernetes), multi-cloud (AWS, Azure, GCP, OCI), networks, logs, and digital experience (RUM + session replay), with built-in AIOps and 130+ global test locations.
Key Features
- APM (code-level tracing): Deep diagnostics for Java, .NET, Node.js, Python, PHP, Ruby, and more with service maps, dependency views, and deployment markers.
- Digital Experience (RUM & Mobile RUM): Core Web Vitals, session replay, front-end error tracking, and user-journey analytics tied to backend signals.
- Synthetics & Website Monitoring: API and browser transaction tests, 10–60s intervals, 130+ global locations, and private on-prem pollers.
- Infrastructure & Cloud: Server, VM, K8s, virtualization, and public cloud monitoring with inventory, alerts, and automation.
- Log Management: Central ingestion, parsing, search, dashboards, and alerting with retention controls.
- Network Monitoring: Performance, traffic (NetFlow), and configuration (NCM) with device/vendor coverage.
Standout Features
- OpenTelemetry support: Hosted OTLP endpoint for metrics, logs, and traces; send OTel data without managing your own Collector.
- All-in-one plans with add-ons: Start small (website/infra/APM/RUM) and scale with add-on units for monitors, logs (GB), RUM pageviews, synthetics, and mobile APM credits.
- AIOps & automation: Anomaly detection, adaptive thresholds, incident workflows, and auto-remediation.
- Global reach + private visibility: 130+ public locations plus On-Premise Pollers for monitoring resources behind the firewall.
Pros
- Broad coverage across MELT with strong website/synthetics and RUM
- Native OpenTelemetry ingestion via hosted OTLP endpoint
- Flexible plans and granular add-ons to start small and scale
- Private pollers for internal apps plus 130+ global locations
- Helpful onboarding resources, docs, webinars, and community
Cons
- Costly at scale
- Alert issues
- Advanced use (PromQL/LogQL-style queries, dependency tuning) adds a learning curve
Best for
Teams that want affordable, all-in-one observability—from uptime and synthetics to APM, RUM, logs, networks, and multi-cloud—without operating their own backend. A good fit for MSPs, SMBs, and mid-market orgs that need broad coverage, OTel compatibility, and private monitoring options.
Pricing & Customer Reviews
- Pricing: Lite: $9/mo, Professional $42/mo, Enterprise: $625/mo
- G2 rating: 4.6/5
- Praised for: breadth (web, synthetics, APM, RUM, infra, logs), easy onboarding, and value for money
- Criticized for: costly at a high scale, learning curve with advanced dashboards/queries
Site24x7 vs Apica
Both address end-to-end visibility and synthetics; Site24x7 leans into all-in-one SaaS with hosted OpenTelemetry ingest, rich RUM/session replay, and extensive network/cloud coverage. Apica emphasizes pipeline-first data routing and object-storage retention. If you want turnkey SaaS observability with OTel and broad ITOM coverage, Site24x7 is a practical Apica alternative.
Conclusion
Apica offers powerful observability and synthetic testing, but it has opaque pricing, UI issues, and a lack of full-stack observability capabilities.
CubeAPM solves these pain points with an OpenTelemetry-native, full-stack observability platform that combines metrics, events, logs, and traces in one interface. Its smart sampling, BYOC/self-hosting flexibility, and predictable $0.15/GB pricing make it a simple, scalable, and cost-efficient alternative to Apica.
Book a free demo to explore CubeAPM.
Disclaimer: The information in this article reflects the latest details available at the time of publication and may change as technologies and products evolve.
FAQs
1. What are the best alternatives to Apica?
The top Apica alternatives include CubeAPM, Dynatrace, Datadog, New Relic, Grafana Cloud, Splunk AppDynamics, IBM Instana, and Site24x7—covering full-stack observability, APM, and digital experience monitoring.
2. Why are teams switching from Apica to CubeAPM?
Teams move from Apica because of cost, UI issues, and a lack of full-stack observability. Apica alternatives such as CubeAPM offer OpenTelemetry-native ingestion, predictable pricing ($0.15/GB), and self-host/BYOC options that reduce data complexity while improving cost transparency.
3. Does CubeAPM support synthetic and real-user monitoring like Apica?
Yes. CubeAPM includes synthetic testing, real-user monitoring, and error tracking for complete visibility from user sessions to backend performance.
4. How does CubeAPM pricing compare to Apica?
CubeAPM charges only for data ingested ($0.15/GB) with no extra cost for users, hosts, or data transfer—unlike Apica’s quote-based model.
5. Which platform is best for OpenTelemetry-native observability?
CubeAPM is built entirely on OpenTelemetry standards, offering deep correlation across metrics, logs, and traces without vendor lock-in.


