










VictoriaMetrics positions itself as a fast, cost-effective alternative to Prometheus and managed time series databases. At its core, VictoriaMetrics is an open source time series database built to handle high-cardinality metrics at scale, with a cluster version that lets teams scale storage and query layers independently. A significant 23% of organizations already use InfluxDB or VictoriaMetrics for metric storage, showing real traction for these Prometheus alternatives in production.
VictoriaMetrics offers three deployment paths: a free forever open source version (single node and cluster), commercial Enterprise editions with disaster recovery and multi-tenancy features, and VictoriaMetrics Cloud, a fully managed SaaS offering. Understanding which path fits your team requires looking past the “free forever” marketing claim to understand what you actually get at each tier and what becomes unavailable or impractical without paying.
This guide breaks down VictoriaMetrics pricing across all three models, documents the feature differences that matter in production, and compares total cost of ownership against Prometheus, Datadog, and newer platforms built on OpenTelemetry.
What Is VictoriaMetrics?
VictoriaMetrics is a time series database designed to store and query metrics from infrastructure, applications, and services. It supports Prometheus remote write, InfluxDB, Graphite, and OpenTelemetry protocols for ingestion, and uses MetricsQL (an extended PromQL dialect) for querying.
The open source version comes in two variants: single node (all components in one binary) and cluster (separate vminsert, vmselect, vmstorage components for horizontal scaling). Both versions are actively maintained and receive regular updates from the core VictoriaMetrics team.
VictoriaMetrics was built to solve a specific Prometheus pain point: long-term metric storage at scale without the operational overhead of Thanos or Cortex. Teams already running Prometheus can add VictoriaMetrics as a long-term storage backend using Prometheus remote write, keeping their existing scrape configs and Grafana dashboards mostly unchanged.
The commercial Enterprise and Cloud tiers add features that matter in multi-team production environments: automated backups, downsampling, per-tenant retention policies, anomaly detection, and enterprise authentication support including SSO and LDAP.
VictoriaMetrics Open Source: What You Get for Free
The open source VictoriaMetrics is genuinely free with no usage limits, no required registration, and no enforced data retention caps. This is not a limited trial or freemium bait. You can run production workloads on it indefinitely.
Single Node Version
The single node version runs as a single binary. It handles metric ingestion, storage, and querying in one process. For teams with under 10 million active time series or metric retention under six months, the single node version handles the load without requiring a distributed architecture.
Single-node VictoriaMetrics supports:
- Full Prometheus remote write compatibility
- InfluxDB, Graphite, and OpenTelemetry metric ingestion
- MetricsQL for querying (Prometheus PromQL compatible with extensions)
- Grafana datasource plugin for visualization
- Instant snapshots and restore via vmbackup and vmrestore CLI utilities
- TLS and HTTPS support
What the single node does not include from Enterprise:
- No automated backup scheduling (vmbackupmanager requires Enterprise)
- No downsampling (historical data uses the same granularity as recent data)
- No per-tenant or per-label retention policies
- No rate limiting or multi-tenant usage stats
- No anomaly detection
- No mTLS for public HTTP endpoints
The single node version suits small to midsize teams monitoring a single environment or cluster. Once active time series cross 10–20 million, or you need to separate query load from ingestion load, the cluster version becomes necessary.
Cluster Version
VictoriaMetrics Cluster splits the database into three independently scalable components:
- vminsert handles metric ingestion and sharding across vmstorage nodes
- vmstorage stores metric data and serves queries
- vmselect executes queries across vmstorage nodes and aggregates results
The cluster architecture lets teams scale storage capacity (add more vmstorage nodes), query throughput (add more vmselect nodes), or ingestion rate (add more vminsert nodes) independently based on actual bottlenecks.
Cluster features in open source:
- Horizontal scaling for ingestion, storage, and queries
- Replication for storage reliability
- Multi-tenancy support (logical isolation by tenant ID)
- DNS-based service discovery for vminsert and vmselect to find vmstorage nodes
What the cluster does not include from Enterprise:
- No automated vmstorage discovery (DNS+SRV requires Enterprise)
- No per-tenant usage statistics or rate limiting
- No downsampling or per-label retention controls
- No backup manager for multi-retention automated backups
The open source cluster version handles production workloads at significant scale. Teams report running VictoriaMetrics clusters ingesting 5–10 million samples per second on modest hardware compared to Prometheus setups requiring far more resources for the same throughput.
Cost Reality of Self-Hosting Open Source VictoriaMetrics
“Free” means no licensing fees. It does not mean zero cost.
Running VictoriaMetrics in production requires:
- Compute and storage infrastructure (AWS EC2, GCP Compute Engine, bare metal)
- Staff time for deployment, configuration, upgrades, and incident response
- Monitoring the monitoring stack itself (you need alerts when your metrics database goes down)
- Backup storage and restore testing
- Security patching and dependency updates
For a mid-scale deployment (100 hosts, 1 million active time series, 1 year retention), infrastructure cost runs roughly $400–$800/month on AWS depending on instance types and storage class. Add 10–20 hours per month of engineering time for maintenance, and you are at $1,500–$2,500/month total cost of ownership even with zero licensing fees.
This cost structure favors teams that already have strong infrastructure engineering capacity and operate other self-hosted data systems. If your team does not currently self-host databases or has no one familiar with distributed systems operations, the operational burden can outweigh the licensing savings.
VictoriaMetrics Enterprise: Features and Pricing
VictoriaMetrics Enterprise adds production-grade operational features on top of the open-source core. Enterprise is a commercial offering requiring a paid license negotiated directly with VictoriaMetrics.
Enterprise Feature Breakdown
Automated Backups and Disaster Recovery
- vmbackupmanager schedules backups with configurable retention (hourly, daily, weekly, monthly)
- Supports S3, GCS, and local disk as backup targets
- Restores from any backup point without manual vmbackup/vmrestore invocation
- Critical for regulated industries and teams without dedicated backup infrastructure
Downsampling
Downsampling reduces storage cost and improves query speed for historical data by aggregating old metrics at coarser granularity. For example, metrics older than 30 days are averaged to 5-minute intervals instead of storing every 15-second sample.
Enterprise downsampling supports:
- Global downsampling rules
- Per-tenant downsampling policies
- Per-label downsampling (different rules for different metric types)
Without downsampling, a year of retention at 15-second scrape intervals consumes 2.1 million data points per time series. With downsampling to 5-minute intervals after 30 days, that drops to roughly 350,000 points, cutting storage by 80% for historical data.
Multi-Tenancy and Per-Tenant Controls
Enterprise adds:
- Per-tenant data retention policies (retain production metrics for 1 year, dev metrics for 30 days)
- Per-tenant rate limiting (prevent one tenant from overwhelming the cluster)
- Multi-tenant usage statistics (track ingestion and query load by tenant)
These features matter for platform teams running shared VictoriaMetrics infrastructure across multiple business units or customer environments.
Security and Authentication
- mTLS support for public HTTP endpoints (vminsert, vmselect, vmauth)
- SSO, LDAP, OpenID, and JWT authentication via vmauth+
- Global and per-user IP filtering for access control
- Priority security bug fixes with backports to discontinued LTS releases
Standard open source VictoriaMetrics supports basic auth and TLS but lacks enterprise SSO integrations that many organizations require for compliance.
Anomaly Detection
Enterprise includes vmanomaly, which applies statistical models and machine learning to detect anomalies in metric behavior. This helps surface unusual patterns (CPU spike at an unusual hour, memory growth trend) without manually writing alert rules for every possible failure mode.
vmanomaly integrates with vmalert for automated alerting based on detected anomalies.
Support and SLA
Enterprise licenses include support tiers:
- Launchpad: Best effort, email support, community Slack updates
- Silver: 8×5 support, 8-hour response time for system-impaired issues
- Gold: 24×5 support, 4-hour response time for system-impaired issues
- Platinum: 24×7 support for P1/P2 issues, 24×5 for P3, 2-hour response time for system-impaired issues, dedicated CSM, in-Slack support, real-time incident response available as an add-on
Support response times matter during production outages. The difference between an 8-hour and 2-hour response SLA is meaningful when your metrics database is down, and engineering teams have no visibility into application performance.
VictoriaMetrics Enterprise Pricing
VictoriaMetrics does not publish Enterprise pricing publicly. Pricing is custom quoted based on:
- Number of active time series
- Data ingestion rate (samples per second)
- Cluster size (number of nodes)
- Support tier selected
- Deployment model (self-managed vs. assistance from VictoriaMetrics team)
Based on community discussions and vendor comparisons, Enterprise pricing typically starts around $15,000–$25,000 per year for small to midsize deployments with Silver support. Larger deployments with Platinum support and hands-on migration assistance can reach $50,000–$100,000+ annually.
Teams evaluating Enterprise should request a formal quote with a detailed cost breakdown tied to their actual metric volume and support needs. VictoriaMetrics sales will typically ask for current Prometheus or competing vendor costs as a reference point during negotiation.
Pricing based on publicly available information and community reports as of early 2026. Enterprise discounts, custom contracts, and negotiated rates are not reflected here. Verify current rates directly with VictoriaMetrics sales before committing.
VictoriaMetrics Cloud: Managed Service Pricing and Features
VictoriaMetrics Cloud is a fully managed SaaS offering that removes infrastructure management entirely. VictoriaMetrics handles deployment, scaling, backups, upgrades, and monitoring of the monitoring system itself.
Cloud supports single-region deployments across AWS, GCP, and Azure in multiple geographic regions. Teams select a region, configure retention and ingestion limits, and start sending metrics via Prometheus remote write or OpenTelemetry.
VictoriaMetrics Cloud Pricing Model
VictoriaMetrics Cloud pricing is based on:
- Active time series count (the primary cost driver)
- Data retention period (30 days, 90 days, 1 year, 2 years)
- Query volume (number of queries per month, though this rarely becomes the limiting cost factor)
Pricing starts at roughly $50/month for small workloads (under 100,000 active time series, 30-day retention) and scales based on active series count.
For a mid-scale deployment (1 million active time series, 1 year retention), VictoriaMetrics Cloud pricing lands around $800–$1,200/month. This is significantly lower than equivalent Datadog infrastructure monitoring ($1,500–$2,000/month for 100 hosts) but higher than self-hosting open-source VictoriaMetrics if your team already handles infrastructure operations comfortably.
Cloud includes all Enterprise features by default:
- Automated backups with point-in-time restore
- Downsampling for historical data
- Anomaly detection via vmanomaly
- Multi-tenancy with per-tenant controls
- SSO and enterprise authentication
- 24×7 support with faster response times than open source community channels
VictoriaMetrics Cloud does not charge separately for query volume unless queries exceed a generous included threshold. This avoids the “query tax” problem seen in some competing managed time series databases where high query volume unexpectedly inflates monthly bills.
Cloud vs. Self-Hosted Enterprise Cost Comparison
For a team running 100 hosts with 1 million active time series and 1 year retention:
Self-hosted open source:
- Infrastructure: $600/month (AWS EC2, EBS, S3 backups)
- Engineering time: 15 hours/month at $150/hour = $2,250/month
- Total: $2,850/month
Self-hosted Enterprise:
- Infrastructure: $600/month
- Enterprise license: ~$2,000/month (estimated $24K/year)
- Reduced engineering time: 5 hours/month = $750/month
- Total: $3,350/month
VictoriaMetrics Cloud:
- Managed service: $1,000/month (estimated for 1M series, 1 year retention)
- Engineering time: 2 hours/month = $300/month
- Total: $1,300/month
Cloud wins on total cost of ownership when engineering time is factored in, unless your team already runs significant self-hosted infrastructure and treats metrics database operations as low marginal cost.
This estimate models a production-ready setup with high availability. A smaller or simpler deployment may cost significantly less. Verify current pricing with VictoriaMetrics directly before making purchasing decisions.
VictoriaMetrics vs. Prometheus: When to Switch
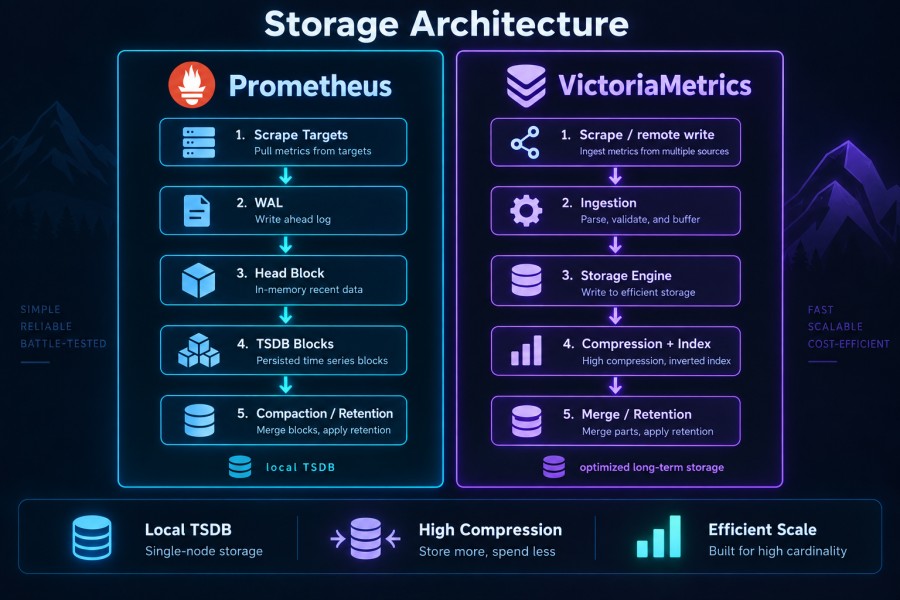
Prometheus is the de facto standard for Kubernetes and cloud native monitoring. VictoriaMetrics was built to solve specific Prometheus limitations, but switching introduces its own trade-offs.
Where VictoriaMetrics Outperforms Prometheus
Long-term storage without operational complexity
Prometheus local storage is designed for 15–30 days of retention. Long-term storage requires adding Thanos or Cortex, which introduces significant operational complexity (object storage configuration, compactor components, store gateways, query federation).
VictoriaMetrics handles long-term storage natively in both single-node and cluster modes without external components. Teams report running 1–2 years of retention on VictoriaMetrics with less operational overhead than running 30 days on Prometheus alone.
Storage efficiency
VictoriaMetrics uses 5–10x less disk space than Prometheus for the same metric data due to better compression algorithms. For high-cardinality workloads (Kubernetes pod metrics, container metrics, service mesh telemetry), this difference compounds fast.
A Prometheus setup storing 10 million active time series for 1 year might require 5–8 TB of SSD storage. The same data on VictoriaMetrics fits in 800 GB to 1.5 TB.
Query performance on historical data
Prometheus query performance degrades as retention increases. Queries spanning multiple days or weeks become slow enough to time out in Grafana.
VictoriaMetrics maintains fast query performance even on year-old data due to how it structures on-disk indexes. Teams report 5–10x faster query response times on historical data compared to Prometheus with Thanos.
Horizontal scaling
Prometheus scaling is vertical (bigger server) or federated (multiple Prometheus instances with complex query routing). VictoriaMetrics Cluster scales horizontally by adding more vmstorage, vminsert, or vmselect nodes independently.
Where Prometheus Still Leads
Ecosystem maturity
Prometheus has been a CNCF graduated project since 2016. Most Kubernetes monitoring guides, Helm charts, and integrations assume Prometheus as the default. Service discovery, exporters, and alerting rules are all written for Prometheus first.
VictoriaMetrics supports Prometheus remote write and PromQL, but some advanced Prometheus features (like recording rules federation) require translation or workarounds.
Alerting
Prometheus Alertmanager is mature and widely understood. VictoriaMetrics uses vmalert (compatible with Prometheus alerting rules), but the ecosystem around Alertmanager (integrations, runbooks, community knowledge) is deeper.
Community size
Prometheus has a larger community, more public production war stories, and more third-party tools built specifically for it. VictoriaMetrics community is growing but smaller.
When to Switch from Prometheus to VictoriaMetrics
Switch if:
- You need more than 30 days of retention and do not want to operate Thanos or Cortex
- Prometheus storage cost is becoming unsustainable (large SSD volumes, frequent disk scaling)
- Query performance on historical data is too slow
- High-cardinality metrics (Kubernetes, Istio, Envoy) are pushing Prometheus to its limits
Stay on Prometheus if:
- Your retention needs are under 15 days
- You already run Thanos or Cortex successfully, and the operational burden is acceptable
- Your team heavily customizes Prometheus internals or relies on features not yet supported in VictoriaMetrics
You can also run both: keep Prometheus for short-term scraping and alerting, send data to VictoriaMetrics via remote write for long-term storage and historical queries.
VictoriaMetrics vs. Datadog and New Relic
VictoriaMetrics competes with managed observability platforms on cost, not feature breadth. Datadog and New Relic offer APM, logs, infrastructure monitoring, RUM, and synthetics in one platform. VictoriaMetrics focuses narrowly on metrics and does it well.
Cost Comparison
For a 100-host deployment with 1 million active time series and 1 year retention:
Datadog Infrastructure Monitoring:
- 100 hosts at $18/host/month = $1,800/month
- Custom metrics beyond included quota: $0.05 per 100 custom metrics
- Estimated total: $2,000–$2,500/month depending on custom metric usage
New Relic:
- Data ingestion at $0.40/GB for metrics
- Estimated 2 TB/month metric data ingestion = $800/month
- User seats (5 full platform users) at $99/user/month = $495/month
- Estimated total: $1,300/month
VictoriaMetrics Cloud:
- 1 million active time series, 1 year retention: $1,000/month
- Total: $1,000/month
VictoriaMetrics self-hosted open source:
- Infrastructure: $600/month
- Engineering time: 15 hours/month at $150/hour = $2,250/month
- Total: $2,850/month
VictoriaMetrics Cloud beats Datadog and New Relic on metrics-only cost but does not include APM, logs, or frontend monitoring. If you need full-stack observability, adding separate tools for logs and traces increases total cost.
For teams that only need metrics (infrastructure monitoring, Kubernetes, Prometheus-compatible workflows), VictoriaMetrics delivers significant savings. For teams that need unified metrics, logs, and traces in one platform, the comparison is less clear-cut.
Feature Gaps vs. Full Observability Platforms
VictoriaMetrics does not include:
- APM and distributed tracing
- Log management and log analytics
- Real user monitoring (RUM) or synthetic monitoring
- Built-in anomaly detection dashboards (vmanomaly exists but requires configuration)
- Broad third-party integrations (700+ in Datadog vs. basic Prometheus exporters)
If your observability strategy requires correlating metrics with logs and traces, you will need to add another tool. CubeAPM, Grafana Cloud, or self-hosted Loki and Tempo are common pairings.
Monitoring VictoriaMetrics with CubeAPM

CubeAPM connects to VictoriaMetrics as a Prometheus-compatible data source, surfacing VictoriaMetrics internal metrics (ingestion rate, storage usage, query latency, cache hit ratio) alongside your application and infrastructure telemetry.
VictoriaMetrics exposes its own operational metrics at /metrics endpoints on vminsert, vmselect, and vmstorage. CubeAPM scrapes these metrics and builds dashboards showing:
- Ingestion health: samples per second, rejected samples, slow inserts
- Storage utilization: disk usage per vmstorage node, active time series count, retention overhead
- Query performance: query latency by endpoint, cache hit rate, slow query count
- Component health: vminsert/vmselect/vmstorage uptime, restart count, resource usage
CubeAPM alerts trigger when VictoriaMetrics metrics indicate problems: ingestion backlog growing, query latency spiking above baseline, vmstorage nodes nearing disk capacity.
This setup gives you monitoring of your monitoring stack without adding another specialized tool. CubeAPM’s self-hosted deployment model keeps VictoriaMetrics telemetry inside your infrastructure, avoiding the circular dependency of using a SaaS platform to monitor your self-hosted metrics database.
Setting up VictoriaMetrics monitoring in CubeAPM takes under 10 minutes: configure Prometheus scrape targets for VictoriaMetrics component /metrics endpoints, import a prebuilt VictoriaMetrics dashboard, and set threshold-based alerts for ingestion rate drops or query latency spikes.
For teams running VictoriaMetrics at scale, this observability layer is necessary. Without it, VictoriaMetrics cluster issues (vmstorage node failure, ingestion bottleneck, query overload) go unnoticed until user-facing monitoring breaks.
How to Choose Between Open Source, Enterprise, and Cloud
Choose Open Source VictoriaMetrics if:
- Your team operates self-hosted infrastructure comfortably (Kubernetes, databases, message queues)
- You need long-term metric storage without Thanos/Cortex operational overhead
- Licensing budget is constrained but engineering time is available
- You can handle backup automation, security patching, and upgrades in-house
Choose VictoriaMetrics Enterprise if:
- You need multi-tenancy with per-tenant retention and rate limiting
- Downsampling is required to control storage cost for long retention periods
- Your organization requires SSO (LDAP, OpenID, SAML) for compliance
- You want vendor support with SLA guarantees for production incidents
Choose VictoriaMetrics Cloud if:
- You want metrics monitoring managed entirely by the vendor
- Your team does not have deep infrastructure operations experience
- You need to get production-grade metrics storage running in hours, not weeks
- Total cost of ownership (infrastructure + engineering time) matters more than licensing cost alone
Choose a Full Observability Platform (CubeAPM, Datadog, New Relic) if:
- You need metrics, logs, traces, and RUM in one unified platform
- Correlating metrics with application traces and error logs is critical for debugging
- You want vendor-managed infrastructure with no self-hosting burden
Most teams benefit from running VictoriaMetrics for metrics and pairing it with a separate log and trace backend rather than paying for a full observability SaaS when they only use metrics heavily.
Disclaimer: The information in this article reflects the latest details available at the time of publication and may change as technologies and products evolve. Features, pricing, and plan limits can change over time. Always verify the latest information directly with the vendor before making purchasing or deployment decisions. This review is based on CubeAPM’s independent research and analysis and does not constitute an official audit or endorsement. This article is intended for informational purposes only and is not meant to disparage any individual, company, or product. We encourage readers to verify current details directly with the relevant providers before making any decisions.
Frequently Asked Questions
Is VictoriaMetrics really free?
Yes. The open source single node and cluster versions are free with no usage limits, no required registration, and no enforced retention caps. You can run production workloads indefinitely on the open source version.
What is the difference between VictoriaMetrics open source and Enterprise?
Enterprise adds automated backups, downsampling, per-tenant retention policies, anomaly detection, mTLS support, SSO integrations, and vendor support with SLA guarantees. Open source includes the core database, querying, and basic authentication but lacks these operational features.
How much does VictoriaMetrics Enterprise cost?
Enterprise pricing is custom quoted based on active time series count, ingestion rate, cluster size, and support tier. Pricing typically starts around $15,000 to $25,000 per year for small to midsize deployments with basic support.
Can I migrate from Prometheus to VictoriaMetrics without downtime?
Yes. Add VictoriaMetrics as a Prometheus remote write target, let both systems run in parallel during migration, then switch Grafana datasources to VictoriaMetrics once historical data backfill completes. Prometheus alerting rules and PromQL queries work in VictoriaMetrics with minimal changes.
Does VictoriaMetrics support OpenTelemetry?
Yes. VictoriaMetrics accepts OpenTelemetry metrics via the OpenTelemetry Protocol (OTLP) in both single node and cluster versions. You can send metrics from OpenTelemetry collectors directly to VictoriaMetrics without Prometheus.
What is MetricsQL and how is it different from PromQL?
MetricsQL is VictoriaMetrics query language, a superset of Prometheus PromQL. All valid PromQL queries work in MetricsQL. VictoriaMetrics extends PromQL with additional functions for rollup aggregations, subqueries, and time series transformations not available in standard Prometheus.
How does VictoriaMetrics handle high cardinality metrics?
VictoriaMetrics is designed for high cardinality workloads. It uses compressed inverted indexes and efficient on-disk data structures that handle millions of unique time series without the memory pressure Prometheus experiences. Kubernetes pod metrics, container metrics, and Istio telemetry all qualify as high cardinality use cases where VictoriaMetrics performs better than Prometheus.