









Grafana Cloud is a capable managed observability platform, but three friction points push teams toward self-hosted alternatives.
- Active series pricing is unpredictable. Grafana Cloud Pro charges $6.50 per 1,000 billable metric series per month on top of a $19/month base fee. Kubernetes workloads with pod-level labels can generate tens of thousands of active series without any obvious misconfiguration. A cardinality spike on a single label can multiply a $200 bill into $2,000 within a single billing cycle.
- Log pricing has three separate charges per GB. On Pro, logs cost $0.40/GB to write, $0.05/GB to process, and $0.10/GB per month to retain, with 30-day retention. Unlike flat per-GB pricing, this three-part model makes accurate cost projection harder for teams with variable log volumes.
- The self-hosted LGTM stack is operationally heavy. Loki, Grafana, Tempo, and Mimir are four independently released, independently scaled, and independently configured components. Running them in production requires managing four separate storage backends, retention policies, compaction jobs, and upgrade cycles. That is itself a platform engineering project.
The self-hosted Grafana Cloud alternatives in this guide are evaluated on self-hosted viability: number of components to operate, signals covered, operational complexity at scale, and total cost compared to Grafana Cloud.
Key Takeaways
- Grafana Cloud Pro charges $6.50 per 1,000 active metric series/month (from official grafana.com/pricing as of June 2026), making costs unpredictable for Kubernetes-heavy workloads with high-cardinality labels.
- The free tier includes 10k active series and 50 GB logs with 14-day retention for both. Pro log retention is 30 days.
- CubeAPM is a single self-hosted platform covering all signals at $0.15/GB with no per-series, per-host, or per-user fees.
- SigNoz replaces the full LGTM stack with a single ClickHouse-backed deployment. Free to self-host, Cloud from $49/month.
- VictoriaMetrics is a drop-in Prometheus replacement with better compression and lower resource usage. VictoriaLogs reached GA in Q1 2026.
- Self-hosted LGTM (Loki, Grafana, Tempo, Mimir) gives the closest Grafana Cloud parity at zero licensing cost but carries the highest operational overhead.
- Grafana OSS is licensed under AGPLv3 as of 2021, not Apache 2.0. All other LGTM components (Loki, Tempo, Mimir) are Apache 2.0.
Why Teams Move Away from Grafana Cloud
- Active series pricing scales with label cardinality, not infrastructure size: Grafana Cloud’s metric pricing is based on active series, not on the number of hosts or the volume of data ingested. A single Kubernetes cluster scraping default Prometheus exporters with pod-level labels can generate 50,000 to 200,000 active series. At $6.50 per 1,000 series on Pro, 100,000 active series costs $650/month in metrics charges alone, before the $19 base fee, log ingestion, and trace ingestion.
- Three-part log pricing makes costs harder to predict: On Pro, every gigabyte of logs has three charges: write ($0.40/GB), process ($0.05/GB), and retain ($0.10/GB per month). A team ingesting 500 GB of logs per month pays $275 in log costs alone ($200 write + $25 process + $50 retain), on top of metric and trace costs.
- Self-hosted LGTM carries high operational overhead: Loki, Grafana, Tempo, and Mimir are independently released components with separate storage backends, separate scaling requirements, and separate retention configurations. At the production scale, operating all four reliably requires dedicated platform engineering capacity.
Best Self-Hosted Alternatives to Grafana Cloud
1. CubeAPM
CubeAPM is a full-stack, self-hosted observability platform covering all the signals Grafana Cloud covers in a single product, at a $0.15/GB rate with no active series pricing, no per-host fees, and no per-user fees.
Key features
- Single platform covering APM, distributed tracing, logs, infrastructure monitoring, Kubernetes monitoring, RUM, synthetic monitoring, and error tracking
- OpenTelemetry-native: accepts OTLP directly from OTel SDKs and Collectors, no proprietary agents required
- Also accepts data from existing Prometheus, Datadog, and New Relic agents for incremental migration
- $0.15/GB pricing with no active series model, no per-host charges, no per-user seat fees
- No annual commitment required
- Self-hosted inside your own cloud or on-prem; telemetry data never leaves your environment
- Vendor-managed operations: CubeAPM handles upgrades and operational support
Why it fits teams leaving Grafana Cloud: CubeAPM eliminates the active series pricing problem entirely. A team generating 200,000 Kubernetes metric series on Grafana Cloud Pro pays $1,300/month in metrics charges alone. On CubeAPM, the same workload is billed only on ingested bytes at $0.15/GB with no cardinality dimension. A single deployment also removes the LGTM multi-component overhead: one system, one retention policy, one interface across all signals.
Best for: Teams that want a complete Grafana Cloud replacement with all signals in one place, predictable GB-based pricing, and no active series billing surprises as Kubernetes workloads scale.
Limitations: Self-hosted deployment required. Grafana’s visualization ecosystem (hundreds of community dashboard templates, plugins, and panel types) is not replicated in CubeAPM.
2. SigNoz
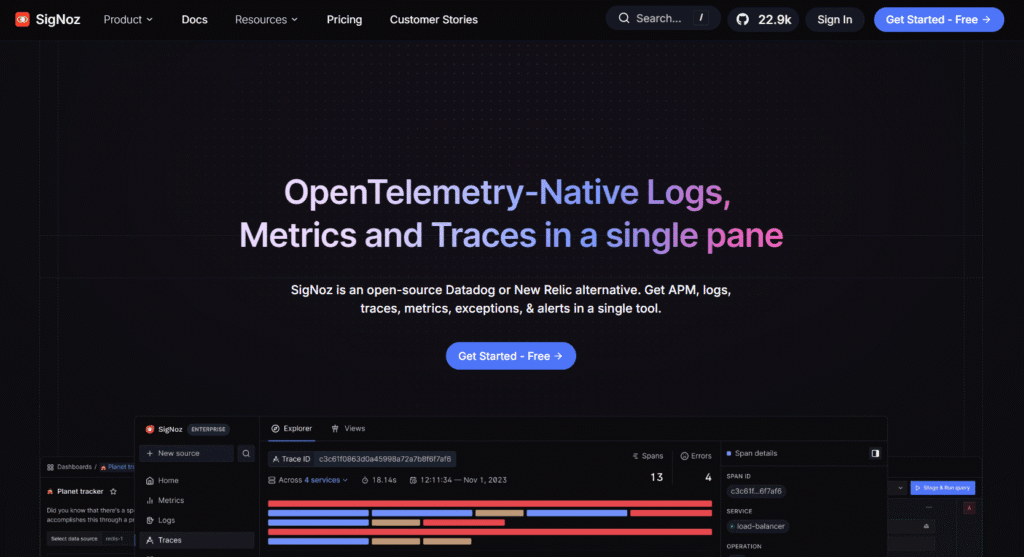
SigNoz is a fully open-source, OpenTelemetry-native observability platform built on ClickHouse. It replaces the entire LGTM stack with a single product covering APM, distributed tracing, logs, infrastructure metrics, and exception tracking. The community edition is free to self-host under Apache 2.0. SigNoz Cloud starts at $49/month.
Key features
- Single platform replacing the full LGTM stack: traces, metrics, logs, and exceptions in one interface
- Fully OTel-native: no proprietary agents, all instrumentation via standard OTel SDKs
- Built on ClickHouse: high-compression columnar storage for logs and traces, typically 5x to 10x more compact than Loki or Tempo for the same data
- Exception tracking linked directly to the triggering trace
- Community edition free to self-host under Apache 2.0; full source code access
- Cloud Teams plan from $49/month; $0.30/GB logs and traces, $0.10/million metric samples
- No per-host fees, no per-user fees, no active series pricing
- SOC2 Type II and HIPAA compliant on Cloud; data centers in US, EU, and India
Why it fits teams leaving Grafana Cloud: SigNoz’s single ClickHouse-backed architecture is significantly simpler to operate than the four-component LGTM stack. Teams with existing Grafana Cloud OTel instrumentation can migrate by updating the OTLP exporter endpoint alone, with no re-instrumentation.
Best for: Teams that want an open-source LGTM replacement with a simpler operational model and OTel-native instrumentation. Teams that want zero licensing cost on a self-hosted path with full source code access.
Limitations: Grafana’s dashboard template ecosystem does not carry over. ClickHouse requires meaningful memory allocation for optimal performance at high ingest rates. Fewer pre-built integration dashboards compared to the Grafana plugin ecosystem.
3. VictoriaMetrics
VictoriaMetrics is a high-performance, open-source time-series database designed as a drop-in replacement for Prometheus with significantly better compression, higher ingestion rates, and lower resource usage. As of Q1 2026, VictoriaLogs reached general availability and VictoriaTraces is available alongside VictoriaMetrics Stack, making it a self-hosted observability stack covering metrics, logs, and traces.
Key features
- Drop-in Prometheus replacement: accepts Prometheus remote_write, PromQL-compatible MetricsQL query API, and existing Prometheus alerting rules without changes
- Typically 5x to 10x better data compression than Prometheus TSDB, with lower CPU and memory usage at equivalent ingest rates
- Single-node handles millions of samples per second; cluster mode available for horizontal scale
- VictoriaLogs: GA as of Q1 2026, designed for high-volume log ingestion
- VictoriaTraces: distributed tracing support available as part of VictoriaMetrics Stack
- Native Prometheus histogram ingestion added in v1.143.0 (May 2026)
- VictoriaMetrics OSS is free under Apache 2.0; Enterprise adds multi-tenancy, downsampling, and anomaly detection
- Most commonly paired with self-hosted Grafana (AGPLv3) as the visualization layer
Why it fits teams leaving Grafana Cloud: Teams running Prometheus locally who found Grafana Cloud’s active series pricing unsustainable can migrate to VictoriaMetrics as the long-term storage backend and keep all existing Grafana dashboards and PromQL alert rules without changes. Long-term retention is economically viable without Grafana Cloud’s per-series retention tiers.
Best for: Teams with heavy Prometheus investment who want a drop-in long-term storage upgrade with no query language migration. Teams running high metric series counts where Grafana Cloud’s per-series pricing is the dominant cost driver.
Limitations: Not a full-stack observability platform on its own for most teams. VictoriaLogs and VictoriaTraces are newer and less mature than Loki and Tempo. Enterprise features require a paid license.
4. Self-Hosted LGTM Stack
Running Loki, Grafana, Tempo, and Mimir self-hosted gives the closest feature parity to Grafana Cloud while eliminating per-series and per-GB billing. Loki, Tempo, and Mimir are Apache 2.0 licensed. Grafana OSS is AGPLv3 licensed since 2021. All are free to self-host.
Key features
- Complete Grafana Cloud feature parity: same dashboards, same PromQL/LogQL/TraceQL queries, same alert rule format
- All community dashboard templates, panel plugins, and data source integrations remain available under Grafana OSS
- Mimir provides horizontally scalable long-term metric storage with Prometheus compatibility
- Loki provides scalable log aggregation with LogQL querying
- Tempo provides distributed tracing with exemplar linking to Prometheus metrics
- All components deployable via official Helm charts on Kubernetes
- Object storage (S3, GCS, Azure Blob) backends for Mimir, Loki, and Tempo keep compute costs low
Why it fits teams leaving Grafana Cloud: Zero licensing cost. All dashboards, alert rules, and query expressions built in Grafana Cloud work without modification. For high-volume teams, object storage costs for self-hosted Mimir and Loki are a fraction of Grafana Cloud’s per-series and per-GB rates at scale.
Best for: Teams heavily invested in the Grafana ecosystem who want to eliminate Grafana Cloud billing without changing any tooling, query language, or retraining engineers.
Limitations: The most operationally demanding option in this comparison. Four independently managed systems with separate scaling, compaction, and retention configurations require dedicated platform engineering effort. High-availability deployments of each component multiply infrastructure complexity further.
5. Prometheus with Thanos
Prometheus with Thanos is the established self-hosted metrics stack for teams needing long-term metric retention, global query views across multiple Prometheus instances, and object storage-backed archival without Grafana Cloud’s active series pricing.
Key features
- Prometheus is the industry-standard metrics collection and alerting system with the largest exporter ecosystem
- Thanos extends Prometheus with long-term object storage (S3, GCS, Azure Blob), global query federation, and downsampling
- PromQL widely known across the industry; no migration needed for existing alert rules or queries
- Thanos Receive component enables remote_write from multiple Prometheus instances into a unified backend
- Completely free and open-source under Apache 2.0
- Pairs with Grafana (AGPLv3) for visualization, Loki for logs, and Tempo or Jaeger for traces
Why it fits teams leaving Grafana Cloud: Teams already running Prometheus who hit Grafana Cloud’s cardinality limits can add Thanos without changing any scrape configs, alert rules, or Grafana dashboards. Thanos’s object storage backend makes multi-year metric retention economically viable.
Best for: Teams already running Prometheus at scale who need long-term retention and global federation without a platform replacement. Teams with strict data residency requirements where all metric data must remain on-prem.
Limitations: Metrics only, without additional components for logs and traces. Running Thanos in production (Sidecar, Store Gateway, Querier, Compactor, Receiver) is operationally complex. VictoriaMetrics is simpler to operate for the same use case and increasingly preferred over Thanos for new deployments.
Comparison at a Glance
| Tool | Signals Covered | OTel Native | Active Series Pricing | Self-hosted | Starting Cost |
| CubeAPM | Metrics, traces, logs, infra, Kubernetes, RUM | Yes | No | Yes (required) | $0.15/GB |
| SigNoz | Metrics, traces, logs, exceptions | Yes | No | Yes | Free / $49/mo Cloud |
| VictoriaMetrics | Metrics, logs (GA), traces | Partial | No | Yes | Free OSS |
| Self-hosted LGTM | Metrics, traces, logs, profiles | Yes | No | Yes | Free (infra costs only) |
| Prometheus + Thanos | Metrics only | No | No | Yes | Free (infra costs only) |
Monitor Your Infrastructure with CubeAPM

CubeAPM is built for teams who want a complete Grafana Cloud replacement without active series pricing, without managing four separate LGTM components, and without telemetry data leaving their own cloud.
A single CubeAPM deployment covers metrics, distributed tracing, logs, infrastructure monitoring, and Kubernetes monitoring in one interface. There is no separate Loki for logs, no Tempo for traces, no Mimir for metric storage. One deployment, one retention policy, one $0.15/GB pricing model across all signals. Because CubeAPM also accepts data from existing Prometheus agents and OTel Collectors alongside its native OTLP path, teams can migrate incrementally from Grafana Cloud without a hard cutover.
Summary
Grafana Cloud’s active series pricing and multi-component LGTM operational overhead are the two primary reasons teams move to self-hosted alternatives. The five options in this guide address those problems in different ways.
| Tool | Best For | Key Advantage Over Grafana Cloud |
| CubeAPM | Full-stack replacement, no active series pricing | Single platform, flat $0.15/GB, no per-series billing |
| SigNoz | OTel-native LGTM replacement, open-source | Single ClickHouse-backed deployment vs. four LGTM components |
| VictoriaMetrics | Prometheus teams, metrics-heavy workloads | 5-10x better compression, drop-in PromQL compatibility |
| Self-hosted LGTM | Full Grafana Cloud parity, ecosystem continuity | Zero licensing cost, identical dashboards and alert rules |
| Prometheus + Thanos | Long-term metric retention, global federation | Object storage-backed archival without per-series billing |
Disclaimer: All Grafana Cloud pricing sourced directly from grafana.com/pricing, verified June 2026. Free tier: 10,000 active metric series, 50 GB logs/month, 14-day retention for metrics and logs. Pro: $19/month base, $6.50 per 1,000 active metric series, logs at $0.40/GB write + $0.05/GB process + $0.10/GB/month retain, 30-day log retention. Enterprise: from $25,000/year. Grafana OSS is licensed under AGPLv3 (since 2021). Loki, Tempo, and Mimir are Apache 2.0. SigNoz: Community edition Apache 2.0, Cloud Teams from $49/month. VictoriaMetrics: OSS free under Apache 2.0, Enterprise pricing on request. CubeAPM: $0.15/GB, no per-series or per-host fees. Pricing subject to change; verify at official vendor pages before purchasing.
How to Monitor Neo4j Graph Database Query Performance
How to Monitor ScyllaDB Latency and Compaction Metrics
How to Monitor TimescaleDB for Slow Queries and Chunk Health