










Dash0 pricing and review is important for teams comparing OpenTelemetry-native observability tools in 2026. Dash0 positions itself as an OpenTelemetry-native monitoring and simpler pricing platform. Founded in 2023, it brings metrics, logs, traces, infrastructure monitoring, dashboards, alerts, service maps, website monitoring, synthetic monitoring, and AI SRE features into one platform.
Its pricing is one of the main reasons teams evaluate it. Dash0 uses consumption-based pricing with no per-seat fees, no base platform charge, and no hidden fees. Usage is billed across metric data points, spans, log records, web events, and synthetic API check runs.
This matters because observability costs have become a serious budget concern for cloud-native teams.
What Is Dash0?
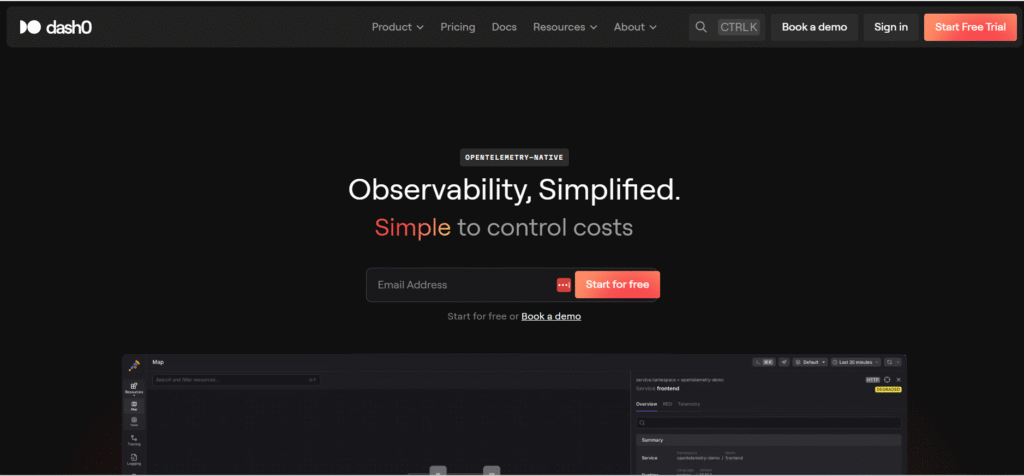
Platform Overview
Dash0 was founded in 2023 by Mirko Novakovic, previously the founder of Instana, an observability company that IBM acquired for $500M in 2020. Dash0 is built entirely on the OpenTelemetry (OTel) open standard from the ground up, rather than adding OTel support as a layer on top of a proprietary architecture.
Today, Dash0 covers:
- Infrastructure and Kubernetes monitoring
- Application Performance Management (APM) and distributed tracing
- Log management
- Website and synthetic monitoring
- AI SRE agents (Agent0) for automated triage and incident resolution
- Dashboards via Perses (code-based, importable from Grafana)
- PromQL-based alerting with 400+ pre-built alert templates
Key Features of Dash0
Dash0 is a SaaS observability platform built natively on OpenTelemetry. It is designed to ingest telemetry from different stacks, vendors, and environments without forcing teams into proprietary agents or vendor-specific data formats. Dash0 also works with the OpenTelemetry Collector, so teams can collect, process, transform, sample, and forward telemetry before sending it to Dash0.
Dash0 says teams can use OpenTelemetry to improve portability and cost visibility. TechCrunch also reported that Dash0’s OpenTelemetry-based approach can help teams see which service, developer, or application is creating observability cost at a given time.
Dash0 includes all platform features in one plan. According to its pricing page, this includes infrastructure monitoring, Kubernetes monitoring, APM, distributed tracing, log management, website monitoring, synthetic monitoring, dashboards, alerting, service maps, and AI SRE agents.
Dash0 includes cost controls directly in the platform. Its pricing page lists monthly budget limits, spam filters for noisy data, cost forecasting, and full cost visibility. Its transparent cost page also says pricing is based on telemetry volume rather than users, GB, or ingestion volume.
Dash0’s AI layer is called Agent0. The company describes it as an AI-native observability copilot that helps developers and operators investigate issues, create alerts, build dashboards, and manage pipeline rules. Agent0 is built on Dash0’s SIFT framework, which Dash0 describes as Spam filter, Ingest, Filter, and Triage.
A Ventureburn report also describes SIFT as a workflow for processing telemetry, filtering false alarms, highlighting important insights, and suggesting ways to address problems. This is useful for reducing alert fatigue and helping teams focus on the most urgent production issues.
Dash0’s OpenTelemetry-based setup gives teams control over how telemetry is collected, processed, transformed, sampled, and routed before it reaches the platform. This can help teams manage cost without fully losing visibility into critical signals. Dash0’s own messaging also emphasizes open standards, telemetry portability, and avoiding proprietary data lock-in.
What are Dash0’s pricing options?
Dash0 uses a consumption-based pricing model. There are no base platform fees, no per-seat fees, and no hidden fees. Teams pay only for the telemetry data they send and store. Dash0 removed its earlier $50 base subscription fee on February 7, 2025, moving to a purely consumption-based model.
Published Per-Signal Rates
The following rates are published or confirmed by Dash0’s pricing materials:
| Signal Type | Price | Retention |
|---|---|---|
| Metric Data Points | $0.20 per million | 13 months |
| Spans / Span Events | $0.60 per million | 30 days |
| Log Records | $0.60 per million | 30 days |
| Web Events | $0.60 per million | 30 days |
| Synthetic API Check Runs | $0.20 per thousand | 13 months |
What Is Included in Every Plan
Dash0 includes all of the following on its single plan with no additional charge:
| Feature | Included |
| Free trial | 14 days, no credit card |
| Core signals | Metrics, logs, traces, infra |
| Monitoring | Kubernetes, APM, synthetics, website monitoring |
| Dashboards & alerts | Dashboards, service maps, PromQL alerts |
| AI features | AI SRE agents |
| Cost controls | Budgets, spam filters, forecasts |
| Marketplace | AWS, GCP, Azure, Vercel |
What Does Dash0 Really Cost?
Assumptions Used in the Cost Scenarios
The Dash0 scenarios below are directional editorial models, not official Dash0 quotes. Unlike GB-based pricing models, Dash0 prices telemetry by item count: metric data points, spans, log records, web events, and synthetic API check runs.
Host count is used only as a workload-size proxy. Actual Dash0 costs depend on how many metric data points, spans, logs, web events, and synthetic checks each environment generates. A quiet 50-host environment can cost less than a noisy 10-host environment.
The scenarios assume the following daily telemetry volumes:
| Team size | Hosts | Directional telemetry volume |
| Small team | 10 hosts | ~50M metrics/day, ~5M spans/day, ~5M logs/day |
| Growing team | 50 hosts | ~250M metrics/day, ~25M spans/day, ~25M logs/day |
| Mid-market team | 250 hosts | ~1.2B metrics/day, ~120M spans/day, ~120M logs/day |
These estimates use Dash0’s public monthly pricing as of May 2026: $0.20 per million metric data points and $0.60 per million spans or log records. They do not include web events, synthetic API checks, enterprise discounts, custom terms, OTel Collector infrastructure, or savings from spam filters and sampling.
Scenario 1: Small Team, ~1.8B Telemetry Events/Month
Situation
A small engineering team runs 10 hosts across application services, a database, and a cache layer. They generate moderate telemetry volume and need centralized log search, basic alerting, APM traces, and uptime visibility without managing observability infrastructure.
Why teams at this stage consider Dash0
Teams at this stage may evaluate Dash0 because it is OpenTelemetry-native, SaaS-based, and does not charge per host or per user. The 14-day trial with no credit card also makes it easier to test with real telemetry before committing.
Estimated profile
| Configuration | Detail |
| Hosts | 10 hosts |
| Metrics | ~1.5B data points/month |
| Spans | ~150M/month |
| Log records | ~150M/month |
| Pricing basis | Public Dash0 rates, May 2026 |
Estimated monthly cost
Disclaimer: This is a directional editorial estimate based on Dash0’s public pricing, not an official Dash0 quote. Actual costs depend on telemetry volume, sampling, filtering, web events, synthetic checks, enterprise discounts, and contract terms.
| Component | Calculation | Monthly cost |
| Metrics | $0.20 × 1,500M | ~$300 |
| Spans | $0.60 × 150M | ~$90 |
| Log records | $0.60 × 150M | ~$90 |
| Total estimated cost | ~$480/month |
What this scenario shows
This scenario shows why Dash0’s pricing can be attractive for small teams, but also why telemetry volume still matters. A 10-host environment with moderate traffic comes to roughly $480/month under the assumptions above, with metrics making up the largest share of the bill. The benefit is that the team avoids per-host and per-user charges, but the cost will still rise if applications generate too many metric data points, spans, or log records.
Scenario 2: Growing Team, ~9B Telemetry Events/Month
Situation
A growing SaaS company runs about 50 hosts across application services, Kubernetes workloads, databases, and frontend systems. A 4–5 person engineering team shares on-call duties, and the platform needs centralized logging, distributed tracing, alerting, and infrastructure dashboards.
Why teams at this stage consider Dash0
At this scale, teams often start looking for simpler observability pricing. Tools with per-host, per-user, and per-feature billing can become harder to predict as infrastructure, telemetry volume, and team size grow.
Dash0 removes host-based and seat-based billing. Cost is tied to telemetry volume instead, including metric data points, spans, log records, web events, and synthetic API check runs.
Estimated profile
| Configuration | Detail |
| Telemetry | ~9B Telemetry Events/Month |
| Metrics | ~7.5B data points/month |
| Spans | ~750M/month |
| Log records | ~750M/month |
| Pricing basis | Public Dash0 rates, May 2026 |
Estimated monthly cost
Disclaimer: This is a directional editorial estimate based on Dash0’s public pricing, not an official Dash0 quote. Actual costs depend on telemetry volume, OTel pipeline sampling, filtering, web events, synthetic checks, enterprise discounts, and contract terms.
| Component | Calculation | Monthly cost |
| Metrics | $0.20 × 7,500M | ~$1,500 |
| Spans | $0.60 × 750M | ~$450 |
| Log records | $0.60 × 750M | ~$450 |
| Total estimated cost | ~$2,400/month |
What this scenario shows
This scenario shows that Dash0 scales linearly with telemetry volume, not host count. Moving from 10 hosts to 50 hosts increases the modeled cost from about $480/month to about $2,400/month because the assumed telemetry volume also increases by 5x.
The main cost-control levers at this stage are reducing noisy logs, controlling high-cardinality metrics, sampling traces carefully, and using Dash0’s cost controls such as spam filters, monthly budgets, forecasts, and quotas. Dash0 documents these cost-control features in its platform docs.
Scenario 3: Mid-Market Team, ~36B Metrics + 3.6B Spans + 3.6B Log Records/Month
Situation
A mid-market B2B SaaS company sends about 36B metric data points, 3.6B spans, and 3.6B log records per month into its observability platform. The environment includes AWS and GCP workloads, Kubernetes clusters, multiple databases, backend microservices, and customer-facing applications.
At this stage, the engineering team usually needs unified dashboards, distributed tracing, alerting, service maps, and enough visibility to support multiple on-call rotations.
Why teams at this size consider Dash0
At this scale, observability spend becomes a serious budget item. Dash0 uses consumption-based pricing, so teams pay for the telemetry they send and store instead of paying by host or seat. Dash0’s pricing page also says there is no base platform charge and no per-seat fee.
The main tradeoff is retention. Dash0 retains metric data points for 13 months, but spans and log records are retained for 30 days. That can work well for recent incident investigation, but teams with longer audit, compliance, or forensic retention needs should validate this carefully.
Estimated profile
| Configuration | Detail |
| Metric data points | ~36B/month |
| Spans | ~3.6B/month |
| Log records | ~3.6B/month |
| Pricing basis | Public Dash0 rates, May 2026 |
Estimated monthly cost
Disclaimer: This is a directional editorial estimate based on Dash0’s public pricing, not an official Dash0 quote. Actual costs depend on telemetry volume, OpenTelemetry sampling, log verbosity, data filtering, and any negotiated enterprise terms.
| Component | Calculation | Monthly Cost |
| Metrics | 36,000M × $0.20 per million | ~$7,200 |
| Spans | 3,600M × $0.60 per million | ~$2,160 |
| Log records | 3,600M × $0.60 per million | ~$2,160 |
| Total estimated cost | ~$11,520/month |
What this scenario shows
At mid-market telemetry volume, Dash0 is not automatically a cheap observability tool. The estimate reaches about $11,520/month because metrics, spans, and log records all scale with usage.
The benefit is that the model is still easier to reason about than host-based pricing. Teams can lower the bill by reducing noisy logs, applying thoughtful OpenTelemetry sampling, and controlling high-cardinality telemetry. Dash0 also includes cost-control features such as monthly budget limits, spam filters, and cost forecasts, which can help teams manage spend before it gets out of control.
What Actually Drives Dash0 Costs
Understanding Dash0 pricing means understanding the main cost drivers behind its per-signal rates. Dash0 charges by the number of metric data points, spans, log records, web events, and synthetic API check runs you send and store. It does not charge by host, user seat, or base platform fee.
Metrics are priced at $0.20 per million data points, which is the lowest rate among Dash0’s core telemetry signals. However, metrics are often the highest-frequency signal in modern systems. High-cardinality Prometheus or OpenTelemetry metrics scraped every 15 seconds across many services can quickly generate billions of data points per month.
Dash0’s Metric Explorer helps teams browse, filter, and investigate metrics, including by data points and cardinality. For real cost control, teams need to reduce noisy metrics before ingestion or billing, using Dash0 Spam Filters or OpenTelemetry Collector filtering.
Spans are priced at $0.60 per million spans or span events, which is 3x the metric data point rate. In high-throughput microservice environments, trace volume can grow quickly because one user request may create many spans across services, databases, queues, and external APIs.
The strongest cost-control lever is sampling and filtering before ingestion. Dash0 is OpenTelemetry-native, so teams can use OpenTelemetry Collector pipelines to manage instrumentation, ingestion, and sampling strategy. Dash0 Spam Filters can also drop matching spans before they count toward the bill, but Dash0 notes that dropping individual spans may create incomplete traces.
Log records are priced at $0.60 per million records, the same as spans. Log volume is often the most variable cost driver because verbose application logging can generate huge numbers of records, especially when debug or info logs are left on in busy environments.
The best controls are reducing log verbosity, filtering low-value logs at the OpenTelemetry Collector level, and using Dash0 Spam Filters to drop repeated or noisy log patterns before billing. Dash0 says spam-filtered telemetry does not count against the Dash0 bill.
Dash0 retains metric data points and synthetic API check runs for 13 months. Spans, log records, and web events are retained for 30 days. This is important because teams that need long-term logs or traces for compliance, audit, or historical investigation may need a separate archival strategy outside Dash0.
That makes retention a real planning point. Dash0 can be cost-effective for recent incident investigation, but teams with longer retention requirements should include external storage, export, or archive workflows in the total cost discussion.
Additional Costs and Operational Overhead Buyers Should Plan For
Dash0 is OpenTelemetry-native, but many teams still run OpenTelemetry Collectors to process, batch, filter, sample, and forward telemetry before it reaches Dash0. At larger scale, this collector layer may need compute, memory, networking, deployment work, and ongoing maintenance.
This is not a Dash0 platform fee, but it should still be included in the total observability budget, especially for Kubernetes-heavy or high-volume environments.
Dash0 retains metric data points and synthetic API check runs for 13 months. Spans, log records, and web events are retained for 30 days. That means teams that need longer log or trace retention for compliance, audit, or historical investigation may need a separate archive path outside Dash0.
This could include cloud object storage, a data lake, or another long-term storage system, depending on the team’s retention and compliance needs.
Dash0 publishes public consumption rates, but larger customers may have custom terms. Final pricing can vary based on volume commitments, marketplace purchases, negotiated discounts, procurement terms, and enterprise requirements.
For high-volume teams, the safest approach is to model usage with public rates first, then confirm final pricing directly with Dash0.
Teams using Dash0 through Vercel should also account for Vercel’s separate Drains fee. Vercel lists Drains at $0.50 per 1 GB on Pro and Enterprise plans. This is separate from Dash0’s own telemetry pricing.
Dash0 User Reviews in 2026
Dash0 has strong early ratings on G2. As of May 2026, G2 shows a 4.8/5 rating from 42 verified reviews, with 39 five-star reviews and 3 four-star reviews. That means about 92% of reviewers gave Dash0 five stars, with no 1-star or 2-star reviews shown in the rating breakdown.
What Users Praise
Users frequently praise Dash0’s OpenTelemetry-first design. G2’s AI review summary says users highlight Dash0’s OpenTelemetry integration as a strength, especially for setup and data management.
G2 review summaries repeatedly mention ease of use, easy setup, intuitive UI, and smooth integrations. G2 lists “Ease of Use,” “Customer Support,” “User Interface,” “Easy Setup,” and “Easy Integrations” among the most common positive themes in reviews.
Dash0’s reviews and community discussions often connect the product to cost control, especially for teams moving away from complex observability bills. One Reddit user who said they migrated from Datadog wrote that Dash0 covered their needs while costing about half of Datadog, and also pushed them toward full OpenTelemetry adoption. Treat this as anecdotal community feedback, not a guaranteed cost outcome.
Customer support is one of the strongest review themes. G2’s pros-and-cons summary lists customer support as a common positive theme, with users describing the Dash0 team as helpful and responsive.
FeaturedCustomers includes Dash0 customer references that praise its OpenTelemetry-native approach, simple interface, and fast troubleshooting experience. However, FeaturedCustomers should be used as supporting evidence, not as the main rating source, because G2 gives the clearer verified-review breakdown.
What Users Criticize
The following points reflect user-review and market-feedback themes. They should be treated as buyer feedback, not universal product limitations.
Feature maturity
Dash0 is still young, and this shows up in reviews. G2’s AI summary notes that some users say the platform is still evolving, with some advanced features not yet fully developed. G2’s pros-and-cons page also lists limited features, missing features, feature deficiency, limited customization, and feature limitations as recurring negative themes.
Limited third-party integrations
Dash0’s OpenTelemetry coverage is strong, but some buyers may still need specific third-party integrations or advanced workflows that mature incumbents already support. This is best framed as a validation point during trial, not as a hard limitation for every team.
Summary Rating Breakdown, May 2026
| Platform | Rating |
| G2 | 4.8/5 from 42 verified reviews |
| FeaturedCustomers | Customer references and testimonials; useful as supporting evidence |
| Use only as anecdotal feedback if citing a specific thread or comment |
Dash0 Alternatives: How It Compares to Competitors
Dash0 vs. CubeAPM
Dash0 and CubeAPM serve different needs. Dash0 is a SaaS observability platform built natively around OpenTelemetry, with transparent consumption-based pricing and AI-assisted troubleshooting through Agent0. CubeAPM is an OpenTelemetry-based APM and observability platform that can run inside the customer’s own cloud or on-prem environment, making it a stronger fit for teams with strict data residency, compliance, or internal control needs.
For regulated industries such as finance, healthcare, and government, CubeAPM’s deployment model is the main difference. Logs, traces, metrics, and infrastructure telemetry can stay inside the customer’s own environment instead of being sent to a third-party SaaS backend. Dash0 is still SaaS-hosted, even though its pricing is simpler than many legacy observability tools.
| Category | Dash0 | CubeAPM |
| Pricing model | Consumption-based; no base platform fee | Predictable pricing of $0.15/GB ingested |
| Deployment | SaaS | Self-hosted |
| APM depth | Strong APM with Agent0 support | Deep APM with OTel-native support |
| Log management | Strong | Strong |
| Data residency | SaaS-hosted | Inside customer infrastructure |
| Best fit | OTel-native SaaS observability | Deep APM with strict data control |
Dash0 vs. Datadog
Datadog is one of the most mature observability platforms, with broad coverage across infrastructure monitoring, APM, logs, RUM, synthetics, security, and many other products. Datadog also has a large integration ecosystem, which makes it useful for teams that want broad out-of-the-box coverage.
The tradeoff is pricing complexity. Datadog pricing is modular across products such as infrastructure monitoring, APM, logs, RUM, synthetics, indexed spans, and other add-ons. Dash0 is usually more attractive for teams that want OpenTelemetry-native observability with simpler usage-based pricing.
| Category | Dash0 | Datadog |
| Pricing model | Per-signal consumption | Host-based + ingestion-based |
| OTel native | Built around OpenTelemetry | Supports OTel, but also uses Datadog workflows |
| Feature depth | Strong core observability; newer platform | Very mature and broad |
| Integrations | OpenTelemetry ecosystem | Large built-in integration ecosystem |
| Free trial | 14-day unlimited trial | 14-day free trial |
| Best fit | OTel-first, cost-conscious teams | Feature-first observability teams |
Dash0 vs. Grafana Cloud
Grafana Cloud is a strong choice for teams already invested in Grafana, Prometheus, Loki, Tempo, and the broader LGTM stack. Its free tier is useful for small teams and testing, with limits for metrics, logs, traces, users, and retention.
Dash0 is stronger when the priority is a fully managed OpenTelemetry-native platform with simpler per-signal pricing, built-in AI troubleshooting, and less need to assemble workflows across multiple Grafana ecosystem components.
| Category | Dash0 | Grafana Cloud |
| OTel native | Yes, OTel-native | Built on open observability tools |
| Free option | 14-day unlimited trial | Free tier with usage limits |
| Managed setup | Fully managed SaaS | Managed cloud with LGTM workflows |
| AI support | Agent0 AI assistant | Grafana AI features |
| Best fit | Managed OTel-native teams | Grafana/LGTM users |
Dash0 vs. New Relic
New Relic is strong for teams that want broad full-stack observability and a generous free tier. New Relic’s pricing page states that its free tier includes 100GB/month of data ingest and one free full-platform user. Its pricing model combines data ingest with user-based access tiers.
Dash0 is usually a better fit when the main concern is OpenTelemetry-native architecture, transparent per-signal pricing, and lower vendor lock-in. New Relic may be better for teams that want a more mature platform with a larger ecosystem and many built-in capabilities.
| Category | Dash0 | New Relic |
| Pricing model | Per-signal consumption | Data ingest plus user pricing |
| Free option | 14-day unlimited trial | 100GB/month free ingest |
| OTel native | Built around OpenTelemetry | Broad OTel support |
| Feature maturity | Newer; strong core features | Mature full-stack platform |
| Best fit | OTel-first teams | Broad full-stack observability |
Dash0 vs. SigNoz
SigNoz is an open-source, OpenTelemetry-native observability platform for logs, metrics, traces, dashboards, alerts, and APM. It can be self-hosted or used through SigNoz Cloud, which makes it attractive for teams that want OpenTelemetry support with more deployment control.
The key difference is deployment and product style. SigNoz gives teams a self-hosted path, while Dash0 is SaaS-only and puts more emphasis on managed workflows, Agent0, AI troubleshooting, and a polished SaaS experience.
| Category | Dash0 | SigNoz |
| OTel native | Yes | Yes |
| Deployment | SaaS | Self-hosted or cloud |
| AI features | Agent0 AI assistant | Less AI-led workflow |
| UI maturity | Polished SaaS UI | Open-source roots |
| Best fit | Managed SaaS OTel observability | OTel plus self-hosting |
Is Dash0 the Right Choice?
Dash0 is a strong option for teams that want an OpenTelemetry-native SaaS observability platform with clear consumption-based pricing. It is especially worth evaluating when teams want metrics, logs, traces, Kubernetes monitoring, APM, dashboards, alerting, service maps, website monitoring, synthetic monitoring, and AI SRE features in one plan. Dash0’s pricing page confirms these features are included in its single plan.
When Dash0 works best
Dash0 is a strong choice for teams standardizing on OpenTelemetry and looking for a native destination for OTel data. The platform is built around OpenTelemetry and CNCF open standards such as PromQL, Perses, and OTLP. Dash0 also positions OpenTelemetry as a way to avoid proprietary instrumentation and improve interoperability across modern observability stacks.
This makes Dash0 useful when teams want to avoid re-instrumenting applications around a proprietary agent. OpenTelemetry semantic conventions can also make telemetry easier to structure, correlate, and move between compatible tools, although teams still need good instrumentation hygiene.
Dash0 is worth considering for teams that like Datadog’s observability coverage but struggle with cost growth or pricing complexity. Dash0 publicly positions itself around transparent usage-based pricing based on telemetry volume, not users, GB, or ingestion volume.
Dash0 has also run a “cut your observability costs by 50%” challenge against existing providers. This is Dash0’s own marketing claim, so it should be treated as a vendor claim, not an independent benchmark.
There is also anecdotal community feedback from at least one Reddit user who reported lower costs after moving from Datadog to Dash0. Treat this as a user example, not a guaranteed result for every workload.
Dash0 fits cloud-native teams running microservices, Kubernetes, and distributed systems. Its pricing page lists Kubernetes monitoring, infrastructure monitoring, APM, distributed tracing, log management, dashboards, alerting, service maps, website monitoring, synthetic monitoring, and AI SRE agents as included in the single plan.
Agent0 also supports natural-language troubleshooting over telemetry. This may help teams investigate incidents faster, especially when they do not want every query or investigation step to depend on deep PromQL or OpenTelemetry expertise.
Dash0’s OpenTelemetry-first model gives teams more portability than platforms built mainly around proprietary agents. Teams can instrument once with OpenTelemetry and route telemetry to Dash0, another OTel-compatible backend, or multiple backends during evaluation.
This does not remove all migration work, but it can reduce lock-in at the instrumentation layer.
When Dash0 may not be the right fit
Dash0 is a SaaS observability platform. Teams that need the observability backend to run inside their own cloud or data center, with telemetry staying in their own infrastructure, should also evaluate self-hosted options such as CubeAPM or SigNoz.
Dash0’s 30-day retention window for spans, log records, and web events is a real planning point. Teams that need longer retention for audit, compliance, or historical investigation may need a separate archive or export path. Metrics and synthetic API check runs are retained for 13 months.
This point needs careful wording. Dash0 does offer Website Monitoring with user sessions, page flows, frontend-to-backend correlation, Core Web Vitals, bounce rates, JavaScript errors, and source map support.
However, teams that specifically need deep visual session replay, replay-based frontend debugging, or a frontend-first product should compare Dash0’s Website Monitoring with tools such as Highlight.io, Sentry, or Datadog RUM Session Replay.
Datadog and Dynatrace may be stronger choices for teams that need the broadest mature enterprise feature set, very large integration coverage, continuous profiling, advanced security posture management, or deep enterprise security workflows. Datadog documents more than 1,000 built-in integrations, while Dynatrace documents security posture management capabilities for cloud and Kubernetes environments.
Dash0 is moving fast, but it is still a newer platform. Teams with highly specific enterprise requirements should validate those needs during the trial before replacing a mature incumbent.
Conclusion
Dash0 is best understood as an OpenTelemetry-native SaaS observability platform for teams that want clearer pricing and less proprietary instrumentation. Its main strengths are consumption-based pricing with no base platform fee or per-seat charges, strong OTel alignment, a 4.8/5 G2 rating from 42 verified reviews, and Agent0 for AI-assisted troubleshooting.
The tradeoffs are worth noting. Dash0 is still a young platform, spans/logs/web events are retained for 30 days, and it is not built mainly as a deep visual session replay product. It is also SaaS-only, so teams with strict data residency needs may want to compare self-hosted options such as CubeAPM or SigNoz.
For teams moving away from complex observability bills and standardizing on OpenTelemetry, Dash0 is a credible 2026 option. Its $110M Series B at a $1B valuation shows strong market backing, but teams should still test real telemetry volumes during the 14-day free trial and request an enterprise quote before making a larger commitment.
Disclaimer: This is an independent editorial review based on publicly available Dash0 documentation, pricing pages, and product materials, supplemented by verified user reviews from G2, AWS Marketplace, Reddit, FeaturedCustomers, and other public sources at the time of writing (May 2026). Pricing, feature availability, and plan terms may change; readers should verify current details directly with Dash0 before making purchasing or implementation decisions.
FAQs
1. What is Dash0’s pricing in 2026?
Dash0 uses consumption-based pricing with no base platform fee, no per-seat fees, and no hidden fees. Public rates are: metrics at $0.20 per million data points, spans/span events at $0.60 per million, log records at $0.60 per million, web events at $0.60 per million, and synthetic API check runs at $0.20 per thousand runs. Metrics and synthetic API checks are retained for 13 months, while spans, logs, and web events are retained for 30 days.
2. What features are included in Dash0’s plan?
Dash0 includes all features in one plan: infrastructure monitoring, Kubernetes monitoring, APM, distributed tracing, log management, website monitoring, synthetic monitoring, dashboards, alerting, service maps, and AI SRE agents.
3. Does Dash0 charge per host or per user?
No. Dash0 says there are no per-seat fees, no base platform charge, and no hidden fees. Costs are based on telemetry usage rather than host count or user seats.
4. Is Dash0 OpenTelemetry-native?
Yes. Dash0 is built on OpenTelemetry and open standards. It supports OpenTelemetry-based workflows, PromQL, Perses dashboards, and OTLP-based telemetry pipelines. This can reduce lock-in at the instrumentation layer, but teams should still validate migration and backend requirements before switching tools.
5. How long does Dash0 retain data?
Dash0 retains metric data points and synthetic API check runs for 13 months. Spans, log records, and web events are retained for 30 days. Teams that need longer log or trace retention may need a separate archive or export path.