Pingdom, a SolarWinds® product, is a popular tool for uptime checks, synthetic monitoring, and RUM. As of September 20, 2025, the Digital Experience Monitoring market is valued at $3.55B with a 17.08% CAGR, reflecting growing demand for user-experience monitoring.
Despite being strong in RUM and synthetics, Pingdom is not a full-stack observability solution. So, if you want APM, logs, and infrastructure monitoring, you will need SolarWinds’ integrated observability solutions through AppOptics and Loggly. Users on review platforms also express their concerns around Pingdom being costly at scale and sometimes alert issues.
CubeAPM is the best Pingdom alternative, offering full-stack observability with RUM and synthetics, OpenTelemetry support, smart sampling, self-hosting, and a rich set of features. In this article, we’ll explore the top Pingdom alternatives for your needs.
Top 8 Pingdom Alternatives
- CubeAPM
- Datadog
- New Relic
- Dynatrace
- Site24x7
- UptimeRobot
- Better Stack (Better Uptime)
- Uptime.com
Why Look for Pingdom Alternatives?
Not a full-stack observability solution
Pingdom monitors uptime, page speed, transactions, and RUM, but it doesn’t offer full-stack observability. These broader capabilities are available as part of SolarWinds’ observability suite via AppOptics (for infra and APM) and Loggly (for logs).
No Self-Hosting
Pingdom itself, as marketed and sold, is SaaS only. You sign up and use it from its cloud platform with no software to install or host locally.
That said, SolarWinds (the company that owns Pingdom) offers a broader suite called SolarWinds Observability which does have a self-hosted deployment option for observability components within the SolarWinds platform. That capability is part of the larger Observability product family, not Pingdom as a standalone product.
Criteria for Selecting Pingdom Alternatives
Full MELT in one platform
Choose a tool that unifies metrics, events, logs, and traces with synthetics and RUM. This eliminates silos and allows engineers to trace an issue from user click to backend root cause without switching tools.
Native OpenTelemetry support
OTel has become the industry standard for telemetry. A good Pingdom alternative should ingest OTel data natively, reducing vendor lock-in, simplifying instrumentation, and ensuring compatibility with modern cloud-native stacks.
Efficient sampling
Platforms that rely on naive probabilistic sampling often drop valuable traces. Look for solutions with latency- and error-aware smart sampling to retain meaningful data, control storage, and reduce costs at scale.
Transparent and predictable pricing
Pingdom alternatives should offer clear usage-based pricing (e.g., per GB ingest) that allows accurate forecasting and avoids hidden fees for page views, SMS credits, or advanced checks.
Flexible deployment and data control
Businesses increasingly need both SaaS and self-hosted options for compliance and cost. The right tool should allow you to run observability in your own cloud, keeping telemetry secure and aligned with data localization needs.
Strong alerting and integrations
Pingdom alternatives should reduce noise with deduplication, anomaly detection, and dependency-aware alerts. Deep integrations with DevOps and incident tools (like GitHub, PagerDuty, or Slack) ensure faster resolution and better collaboration.
Pingdom Overview
Known for
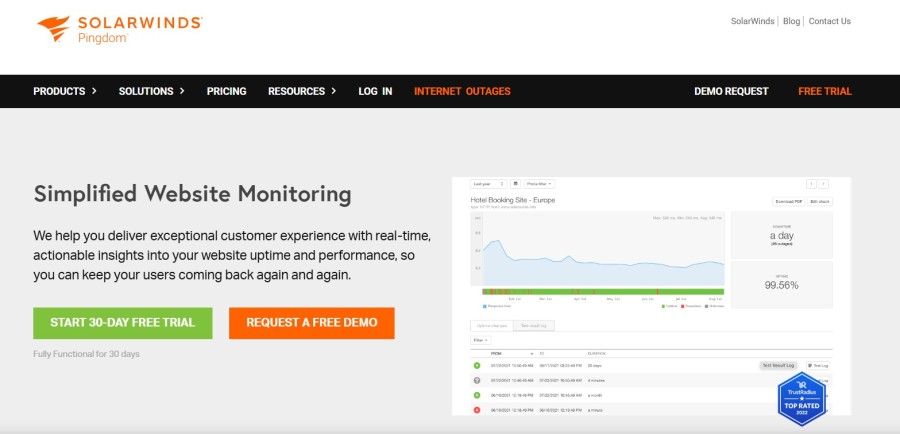
Website-first monitoring that combines synthetic checks (uptime, page speed, multi-step transactions) with Real User Monitoring (RUM) to track availability and frontend performance from global locations. Delivered as a hosted SaaS with quick setup and public status pages.
Standout Features
- Synthetic transactions (real-browser): Record and replay multi-step flows (login, cart, checkout) for proactive detection.
- Global polling & status pages: Worldwide check locations with shareable public status and historical uptime.
- RUM dashboards & filtering: JS snippet with device, browser, and geo breakdowns for real-world UX trends.
- REST API automation: Programmatic CRUD for monitors to manage large estates.
Key Features
- Uptime monitoring: HTTP(S), port/ping checks with instant alerting and historical views.
- Page speed analysis: Waterfalls and optimization insights to diagnose slow pages.
- Transaction monitoring: Scripted, multi-step synthetic tests for critical user journeys.
- API monitoring: External/internal API availability and latency checks.
- Real User Monitoring (RUM): Client-side performance metrics from actual users across pages and audiences.
Pros
- Quick SaaS setup and easy onboarding for web teams
- Strong synthetic breadth (uptime, page speed, transactions) with global locations
- Shareable RUM reports and built-in status pages for stakeholders
Cons
- Not a full-stack observability solution
- No self-hosting
Best for
Digital teams that primarily need outside-in website assurance—proactive uptime/transaction checks, page performance insights, and RUM—with minimal setup and public status pages.
Pingdom Pricing & Customer Reviews
- Pricing: Synthetic Monitoring starts at $10/month, RUM starts at $10/month
- Rating: 4.5/5 (Capterra)
- Praised for: Easy onboarding; strong synthetic transactions and global checks; stakeholder-friendly status pages and RUM dashboards
- Criticized for: Not a full-stack observability tool
Top 8 Pingdom Alternatives
1. CubeAPM
Known for
OpenTelemetry-native, full-stack observability that unifies APM (tracing), logs, metrics, infrastructure monitoring, RUM, synthetic monitoring, and error tracking in one platform, with rapid setup and migration-friendly compatibility (Datadog/New Relic/Prometheus/Elastic agents).
Standout Features
- OpenTelemetry-first pipeline: Ingest spans, metrics, and logs directly via OTel for vendor-neutral instrumentation.
- Smart, signal-aware sampling: Preserves high-value traces (errors/latency outliers) while reducing volume and cost.
- High compatibility & fast switching: Works with Datadog/New Relic/Prometheus/Elastic agents to accelerate migrations.
- Self-hosting & data localization: Option to run in your cloud to meet compliance and egress-cost goals.
- 800+ integrations: Connects to popular clouds, databases, message queues, frameworks, and third-party services out of the box.
Key Features
- Distributed Tracing (APM): End-to-end request visibility with service maps and root-cause workflows.
- Log Monitoring: Centralized ingestion, search, and correlation with traces/metrics for faster triage.
- Infrastructure Monitoring: Host/container/Kubernetes visibility with lightweight charts and alerts.
- Real User Monitoring (RUM): Frontend performance by device/geo, stitched to backend traces.
- Synthetic Monitoring: Global uptime and scripted transactions to catch regressions pre-release.
- Error Tracking: Aggregated exceptions with release/version context tied to code paths.
Pros
- OTel-native design reduces agent sprawl and lock-in
- Correlates MELT signals with RUM/synthetics in one UI
- Migration-friendly with quick time-to-value
Cons
- May not fit teams that strictly prefer vendor-hosted, zero-infrastructure setups
- Purpose-built for observability; does not include cloud security posture management
Best for
Engineering teams that want one place for MELT + RUM + synthetics with OTel-first ingestion, minimal tool-sprawl, and predictable usage economics. Especially strong for organizations standardizing on OpenTelemetry, consolidating Datadog/New Relic/ELK footprints, or needing self-hosting/data-localization to control egress and meet regional compliance needs.
CubeAPM Pricing & Customer Reviews
- Pricing: $0.15/GB of data ingested for observability (no extra charges for infrastructure or data transfer)
- G2 Rating: 4.7/5
- Praised for: OTel-native ingestion, end-to-end correlation across MELT + RUM + synthetics, easy migration from incumbents, self-hosting for data control
CubeAPM vs Pingdom
Pingdom focuses on website-first monitoring (synthetics + RUM). CubeAPM covers that and the backend, correlating traces, logs, metrics, infra, errors, RUM, and synthetics, OTel-first ingestion, smart sampling, and one usage metric ($0.15/GB ingested), without stitching multiple tools.
2. Datadog
Known for
A broad, SaaS-first observability platform that brings together infrastructure monitoring, APM (distributed tracing), log management, synthetics, RUM (web & mobile), error tracking, network monitoring, and security in one place, with 900+ integrations to stitch signals across your stack.
Standout Features
- APM & service map: End-to-end distributed tracing with real-time service dependency maps for microservices troubleshooting.
- Synthetics + RUM correlation: Code-free API/browser tests and RUM sessions that link failures to backend telemetry for faster RCA.
- Error Tracking: Automatic error grouping across browser, mobile, logs, and APM traces with prioritization workflows.
- 900+ integrations: Rich ecosystem covering clouds, databases, queues, and CI/CD/incident tools for unified visibility.
Key Features
- Infrastructure Monitoring: Host, container, serverless, and network metrics with alerting and dashboards.
- APM (Tracing): Trace search & analytics, flame graphs, service maps, and tail-based controls.
- Log Management: Ingest, index (tiered), archive/forward; pipelines and optional sensitive-data controls.
- Synthetic Monitoring: API & browser tests, private locations, CI-friendly workflows.
- Real User Monitoring (Web & Mobile): Session-level visibility, Core Web Vitals, optional Session Replay add-on.
- Error Tracking: Issue-level grouping from logs, traces, browser/mobile SDKs.
Pros
- Deep product breadth spanning infra, apps, logs, user experience, and security in one platform
- Strong analytics and visualizations; mature service map and trace analytics for microservices
- Large integration catalog (900+) that eases data onboarding and correlation
Cons
- Complex and High pricing for smaller teams
- No self-hosting; only SaaS
Best for
Organizations that want a single, SaaS-hosted observability hub to monitor hybrid/multi-cloud infrastructure, microservices, and user experience, and that value a rich ecosystem of integrations and add-ons. Datadog is especially strong for teams with complex estates that benefit from linking synthetics/RUM to traces, logs, and infra metrics in one UI.
Datadog Pricing & Customer Reviews
- Pricing: Infrastructure starts at $15/host/mo; Logs Ingest at $0.10/GB; RUM at $0.15 per 1,000 sessions annual; Synthetics API at $5 per 10,000 tests annual
- G2 rating: 4.4/5
- Praised for: Wide product coverage, strong analytics and dashboards, ecosystem depth and integrations, correlation across MELT + DEM
- Criticized for: pricing complexity
Datadog vs Pingdom
Pingdom concentrates on website-first monitoring (synthetics + RUM). Datadog includes those capabilities and layers on infrastructure metrics, distributed tracing, logs, network, and security, plus 900+ integrations. For teams wanting one platform that correlates outside-in checks with backend and infra telemetry, Datadog offers a broader operational picture but at a higher cost.
3. New Relic
Known for
A unified, SaaS observability platform covering APM (distributed tracing), infrastructure monitoring, log management, synthetic monitoring, browser/mobile RUM, error tracking, and business journey analytics (Pathpoint), with 780+ integrations and first-class OpenTelemetry support.
Standout Features
- APM 360 & Transaction 360: Code-level visibility with service maps and business-transaction views for faster RCA.
- Digital Experience Monitoring: Browser + mobile RUM, Core Web Vitals, Session Replay, and DEM workflows tied to backend telemetry.
- Synthetics & Web Perf: API/browser tests, private locations, and web performance monitoring to catch regressions pre-release.
- Pathpoint (business journeys): Map customer journeys to technical entities for impact-driven prioritization.
Key Features
- Application monitoring (APM): Distributed tracing, service maps, errors, deployments/changes in one place.
- Infrastructure monitoring: Hosts, containers, Kubernetes, networks, and cloud services with alerting and dashboards.
- Log management: Ingest, search, and correlate logs with APM/infra; pipelines and retention controls.
- Browser & mobile monitoring: RUM for web and native apps, Core Web Vitals, crash/error insights, session analysis.
- Synthetics: API and browser tests with CI-friendly workflows and private locations.
Pros
- Broad end-to-end coverage (APM, infra, logs, DEM) with 780+ integrations
- Strong APM/RUM tie-ins and OpenTelemetry support
- Business-level views (Pathpoint) to connect customer journeys with technical health
Cons
- Can be expensive with a modular pricing structure (data/compute usage and user-based)
- SaaS-based; no self-hosting
Best for
Teams that want a single platform to correlate MELT signals with digital experience and business journeys—especially organizations standardizing on OpenTelemetry and looking to connect frontend issues to backend root causes without juggling multiple tools.
New Relic Pricing & Customer Reviews
- Pricing: Data ingest: 100 GB free each month, $0.40/GB beyond the free tier
- G2 rating: 4.4/5
- Praised for: Comprehensive APM + DEM workflows, quick root-cause via tracing/RUM correlation, rich dashboards/integrations
- Criticized for: High pricing
New Relic vs Pingdom
Pingdom emphasizes website-first monitoring (synthetics + RUM). New Relic includes those capabilities and extends into APM, infrastructure, logs, and business journey analytics, with 780+ integrations and OpenTelemetry support.
4. Dynatrace
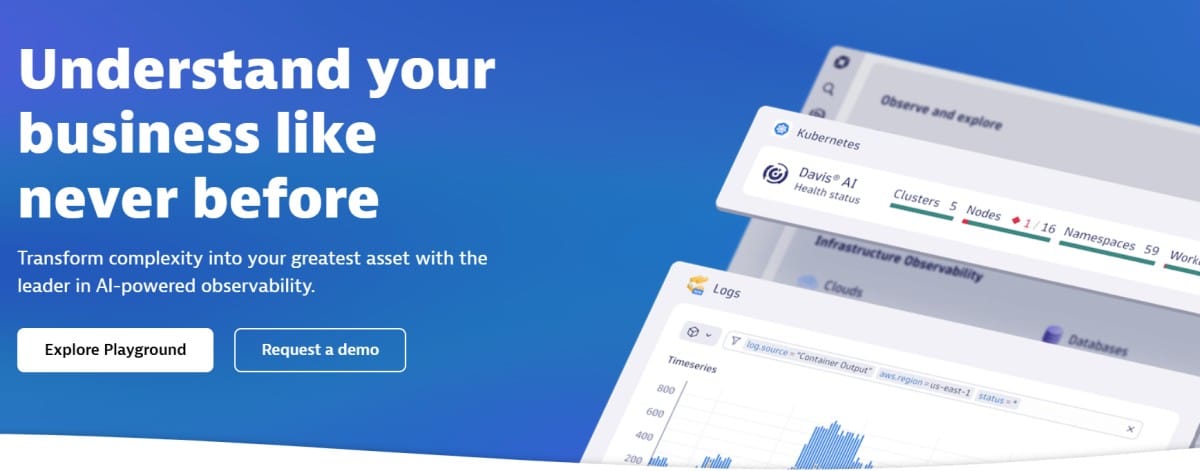
Known for
An AI-driven, SaaS observability platform that unifies application observability (APM + tracing), infrastructure observability, log management & analytics (Grail), and digital experience monitoring (RUM, synthetics, Session Replay), plus automation and business analytics—powered by Davis® AI and a large integrations catalog.
Standout Features
- Davis® AI causal analysis: Automatic problem detection with root cause and business-impact context.
- Grail data lakehouse: Unified storage/analytics for logs, traces, metrics, and events with topology and context preserved.
- Automatic topology discovery (OneAgent): Continuous dependency mapping across hosts, services, Kubernetes, and cloud.
- Frontend-to-backend DEM: RUM, synthetics, and Session Replay stitched to backend telemetry for rapid RCA.
Key Features
- Application Observability: End-to-end tracing, code-level profiling, database visibility, OpenTelemetry support.
- Infrastructure Observability: Hybrid/multi-cloud hosts, containers, Kubernetes, network, and cloud services.
- Log Management & Analytics: Ingest/search/analyze logs in context with traces, events, and metrics (Grail).
- Digital Experience: Web & mobile RUM, synthetic browser/HTTP monitors, and Session Replay.
- Automation & Business Analytics: Workflow automation, impact analytics, and journey/business KPI insights.
Pros
- Strong AI-assisted RCA and impact analysis across MELT + DEM
- Unified context in Grail reduces manual tagging and joins
- Broad product coverage and integrations for faster onboarding
Cons
- Can be expensive for smaller teams
- Learning curve is steep
Best for
Enterprises that want AI-driven answers and deep frontend-to-backend correlation across apps, infrastructure, and user experience—especially at cloud-native scale. Dynatrace is a fit when you need automatic topology discovery, Grail-backed analytics, and automation to shrink MTTR and align technical health to business impact.
Dynatrace Pricing & Customer Reviews
- Pricing: Full-Stack Monitoring at $0.08 per hour for an 8 GiB host
- G2 rating: 4.5/5
- Praised for: Davis® AI root-cause and impact analytics, Grail context preservation, automatic discovery, and deep Kubernetes/cloud coverage
- Criticized for: Pricing, learning curve
Dynatrace vs Pingdom
Pingdom centers on website-first monitoring (synthetics + RUM). Dynatrace includes those and extends into APM, infrastructure, logs, automation, and business analytics, with AI-driven root cause via Davis® and unified context in Grail.
5. Site24x7
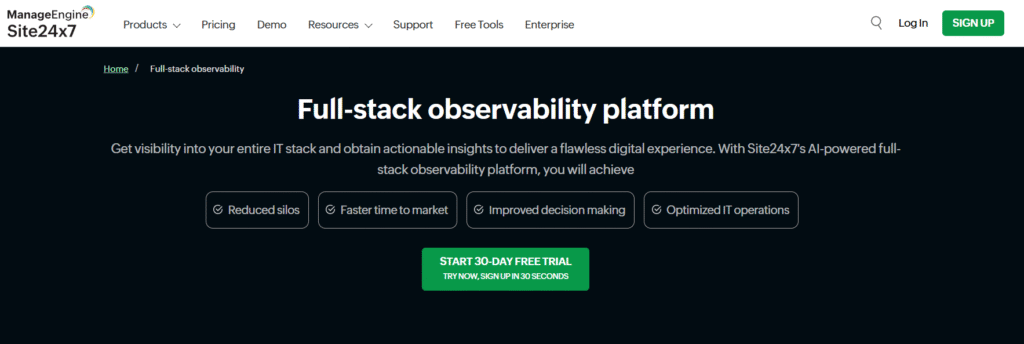
Known for
Site24x7 offers a broad, SaaS monitoring suite from Zoho/ManageEngine that brings website & synthetic monitoring, Real User Monitoring (RUM), infrastructure & network monitoring, log management, APM for apps & databases, Kubernetes & cloud (AWS/Azure/GCP/OCI), and AIOps together, with modular plans for web, infra, APM, and all-in-one needs.
Standout Features
- Website & transactions: Global uptime checks, page speed, and multi-step browser transactions with 30–60s intervals.
- Real User Monitoring: Web & mobile RUM with device/geo/browser breakdowns and Core Web Vitals.
- Infra + Network + Cloud: Servers, VMs/containers, Kubernetes, SNMP & NetFlow, plus AWS/Azure/GCP/OCI services.
- Log management: Built-in log ingestion, search, alerts, and add-ons (10GB/100GB/1TB) to scale.
Key Features
- Uptime & page performance: HTTP/HTTPS, API, SSL/TLS, DNS, mail, and website performance diagnostics.
- Synthetic transactions: Browser workflows to test carts, logins, and forms from 130+ locations.
- RUM (web & mobile): JS/mobile SDKs for real-world UX, funnels, and performance by audience.
- APM: Java/.NET/Node/PHP/Ruby monitoring with traces, slow transactions, DB visibility.
- Kubernetes monitoring: Cluster/node/pod metrics, events, and dashboards.
- Network monitoring: SNMP devices, configuration (NCM), NetFlow traffic analysis.
- Cloud monitoring: Native AWS/Azure/GCP/OCI coverage with service-level dashboards and alerts.
Pros
- Wide coverage from website/RUM to infra, network, logs, APM, and cloud
- Quick SaaS setup with 130+ global locations for synthetics
- Modular plans with entry pricing suitable for startups and SMBs
- Rich add-on catalog (RUM page views, logs, monitors, interfaces
Cons
- Alert issues
- Setup complexity
- Can be expensive for smaller teams
Best for
Teams that want a consolidated, website-to-infrastructure view with RUM, synthetics, servers, networks, logs, APM, Kubernetes, and major clouds in one vendor—especially SMBs and mid-market who value straightforward packaging, global check locations, and the ability to add RUM page views, monitors, or log capacity as they grow.
Site24x7 Pricing & Customer Reviews
- Pricing: Pro: $35/mo, Classic: $89/mo, Enterprise: $225/mo
- G2 rating: 4.6/5
- Praised for: Broad coverage across website, infra, network, logs, APM, cloud; global PoPs; flexible add-ons
- Criticized for: alert issues, setup complexity
Site24x7 vs Pingdom
Pingdom specializes in website-first monitoring (synthetics + RUM). Site24x7 offers that plus infrastructure, network, logs, APM, Kubernetes, and cloud monitoring in one console. If you want Pingdom-style uptime/RUM with adjacent infra and network visibility—and prefer modular SaaS packaging—Site24x7 is a strong all-in-one alternative.
6. UptimeRobot
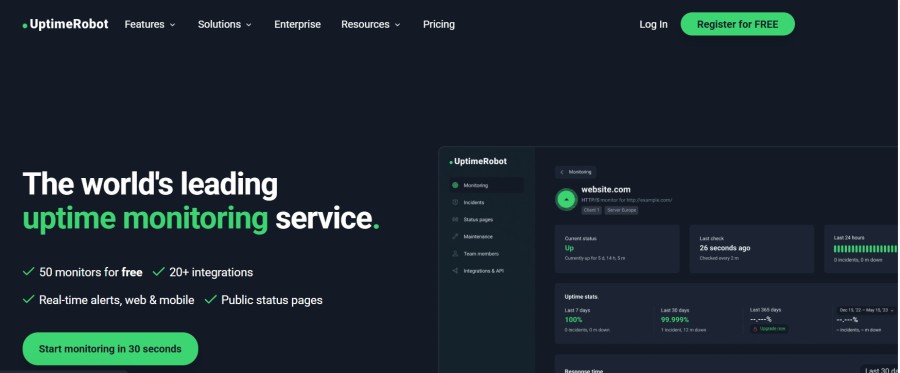
Known for
A simple, budget-friendly website uptime monitoring service with fast checks (down to 30 seconds on higher tiers), essential monitor types (HTTP(S), ping, port, DNS, SSL, domain expiry, cron/heartbeat, keyword), multi-channel alerts, and public status pages.
Standout Features
- Fast external checks: Outside-in monitors with 1-minute (Solo/Team) and 30-second (Enterprise) intervals.
- Public & internal status pages: Share uptime, incidents, and maintenance with customers and teams.
- Multi-channel alerting: Email, SMS, voice calls, plus integrations like Slack, MS Teams, Discord, Zapier, and webhooks.
- REST API: Full v3 API to create, update, group, and manage monitors and status pages programmatically.
Key Features
- Website & endpoint monitoring: HTTP(S) availability with response-time tracking and custom HTTP methods/headers.
- Ping, port & DNS: Network reachability and service availability checks, plus DNS change monitoring.
- SSL & domain expiry: Early warnings for certificate and domain renewals.
- Cron/heartbeat monitoring: Verify background jobs and schedulers are running on schedule.
- Keyword monitoring: Look for the presence/absence of text in the response body.
- Status pages: White-label options, incident posts, and basic analytics.
Pros
- Very quick to set up and easy to operate
- Affordable tiers with generous monitor counts
- 30-second checks available on Enterprise
- Status pages and API included across paid tiers
Cons
- Notification delays
- Limited features in the free plan
Best for
Teams that primarily need reliable, low-cost external uptime monitoring with rapid alerting, simple status pages, and basic network/keyword/SSL/cron coverage—ideal for startups, agencies, and SMBs that don’t require deep tracing, logging, or RUM.
UptimeRobot Pricing & Customer Reviews
- Pricing: Free for 50 monitors, 5-minute interval, 1 status page; Solo: $7/mo (annual); Team: $29/mo (annual); Enterprise: $54/mo (annual)
- G2 rating: 4.7/5
- Praised for: Reliable core monitors (HTTP(S), ping, port, keyword, heartbeat), simple status pages, 30-second checks on Enterprise
- Criticized for: Focused on uptime only (no native RUM/APM/logs)
UptimeRobot vs Pingdom
Pingdom covers synthetics + RUM for website performance, while UptimeRobot focuses on fast external uptime checks with core monitor types and status pages. Choose UptimeRobot when you want simple, affordable availability monitoring with 30-second checks and basic incident comms. Choose Pingdom if you also need page-level performance/RUM and more advanced website diagnostics.
7. Better Stack
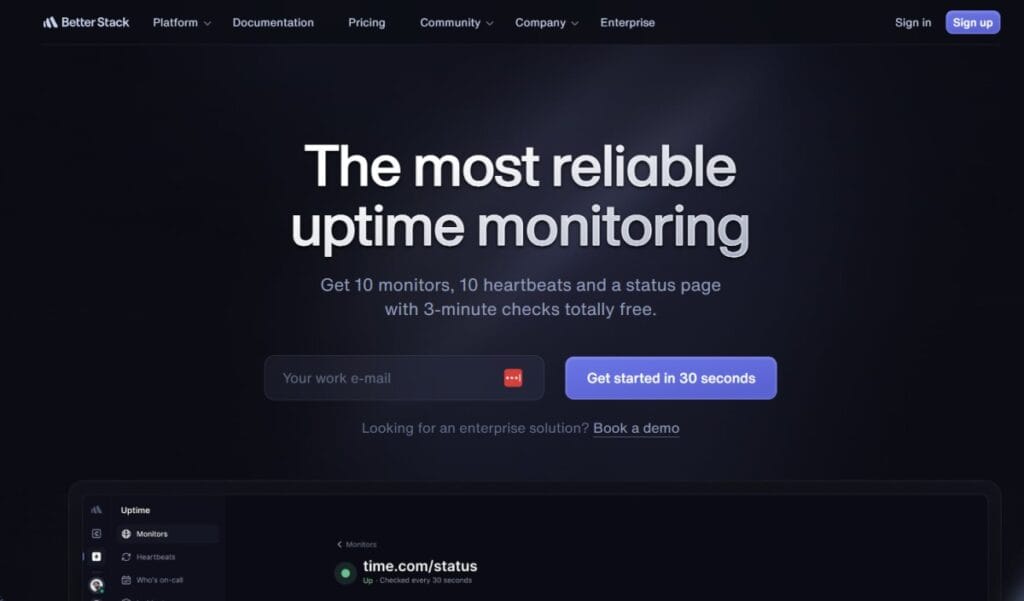
Known for
Better Stack is an observability-meets-incident platform that combines uptime & transaction monitoring, status pages, on-call & incident management, plus telemetry (logs, traces, metrics) with OpenTelemetry-native infrastructure monitoring and eBPF-based tracing—delivered as an elegant, SaaS-first experience.
Standout Features
- Uptime & transactions: 30-second checks, Playwright browser transactions, screenshots, traceroute/MTR for root cause.
- Incident management & on-call: Slack/Teams workflows, smart incident merging, escalations, unlimited phone/SMS alerts.
- Status pages: Branded status.yourdomain.com with subscribers, private pages, SSO, and white-label options.
- Telemetry (logs/traces/metrics): Bundled retention, SQL-like querying, OpenTelemetry-native pipelines.
Key Features
- Website & API monitoring: HTTP(S), keyword checks, multi-location verification, cron/heartbeat monitoring.
- Transaction monitoring: Hosted Playwright flows to test carts, sign-in, and critical user journeys.
- Log management & tracing: Centralized ingest with context; eBPF-based OpenTelemetry tracing.
- Infrastructure monitoring: OpenTelemetry-native infra & K8s visibility with dashboards and alerts.
- Incident & on-call: Calendars, call routing, alert escalations, AI post-mortems, reporting.
- Status pages: Public/private pages, subscriber management, custom CSS/JS, and branding.
Pros
- Unified uptime, incidents, status pages, and telemetry in one platform
- Clean UI and fast setup with 30-second external checks
- Strong Slack/Teams workflows for response and post-mortems
- Branded status pages with flexible privacy and SSO options
Cons
- SaaS-first; no self-hosting
- Complex configuration
Best for
Teams who want Pingdom-style uptime/transactions tightly integrated with on-call, incident automation, and status pages, while also having a path into OpenTelemetry-native logs, traces, and metrics—ideal for SaaS startups and product teams that prioritize fast incident response and customer-facing comms.
Better Stack Pricing & Customer Reviews
- Pricing: Free for 10 monitors & 10 heartbeats; paid starts $29 per license/month (annual)
- G2 rating: 4.8/5
- Praised for: Unified uptime + incidents + status pages, Playwright transactions, 30-second checks, clean UI, strong Slack/Teams workflows, unlimited phone/SMS alerts on Responder license
- Criticized for: SaaS-first (no self-hosting), learning curve
Better Stack vs Pingdom
Pingdom focuses on synthetics + RUM for website performance and availability. Better Stack delivers uptime & Playwright transactions, status pages, on-call, and incident workflows in one place, then extends into logs, traces, and metrics with OpenTelemetry support.
8. Uptime.com
Known for
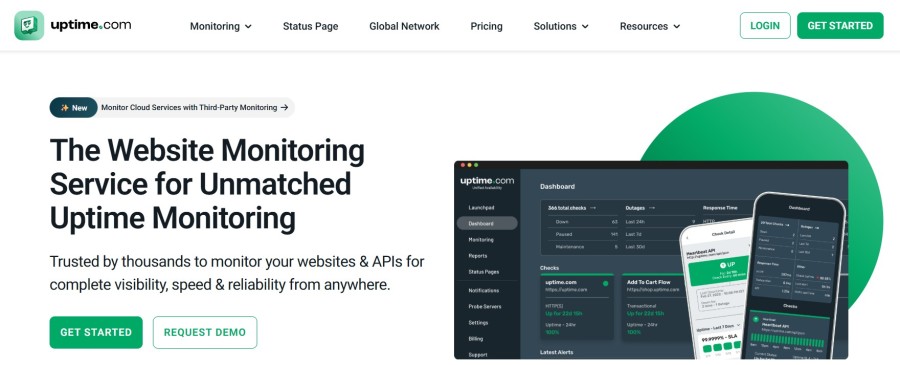
A modern website monitoring platform that brings together uptime & API checks, synthetic transactions, RUM, page speed diagnostics, status pages, and alerting—with simple packaging, unlimited users on paid plans, and an easy onboarding flow.
Standout Features
- API & synthetic monitoring: No-code API checks, browser transactions, and private locations for internal apps.
- Real-time analysis & RCA: Built-in tools to investigate incidents with traceroute/MTR, screenshots, and step logs.
- Status pages: Public pages to communicate maintenance and incidents with customers and stakeholders.
- Integrations & alerting: Email/SMS/phone and 20+ integrations, plus escalations and maintenance windows.
Key Features
- Website & endpoint monitoring: HTTP(S) availability and response-time tracking with global locations
- API monitoring: Header/auth support, custom assertions, and chained steps
- Synthetic transactions: Multi-step browser journeys for carts, logins, and other critical flows
- Real User Monitoring (RUM): Performance by device, OS, browser, and geography from real visitors
- Page speed monitoring: Waterfalls and performance scoring to spot slow resources
- Webhook monitoring: Heartbeats for cron jobs and background workers
- Status page monitoring: Branded pages with incident posts and history
- Alerting: Email, SMS/voice, integrations, escalations, and on-call routing
Pros
- Clear focus on website/API uptime with strong synthetic capabilities
- Real-time analysis aids in root cause analysis during incidents
- Paid plans include unlimited users and group checks
- Straightforward packaging and onboarding
Cons
- Complex configuration
- Expensive for smaller teams
- Notification issues
Best for
Teams that primarily need outside-in uptime and transaction monitoring with clean status pages and practical incident tooling. If your goal is to keep websites and APIs healthy, correlate checks with real user experience, and communicate clearly during downtime—without adopting a full MELT stack—Uptime.com is a strong fit.
Uptime.com Pricing & Customer Reviews
- Pricing: Website Monitoring starting at $7/month (annual billing)
- G2 rating: 4.6/5
- Praised for: Clear website/API focus with strong synthetics, real-time analysis (screenshots, traceroute/MTR), status pages, unlimited users and group checks on paid plans, easy onboarding
- Criticized for: complex setup
Uptime.com vs Pingdom
Pingdom delivers synthetics + RUM for website performance and availability. Uptime.com covers those pillars with a strong focus on API checks, synthetic transactions, page speed, and real-time analysis, plus status pages and unlimited users on paid plans.
Conclusion
Pingdom offers solid Synthetics and RUM, but is not a full-stack observability solution. It can also be costly for smaller teams with tight budgets and can introduce alert issues occasionally.
CubeAPM is the best Pingdom alternative with a full-stack observability suite – unified traces, metrics, logs, infra, errors, RUM, and synthetics. It’s OpenTelemetry-native and offers smart sampling, self-hosting, 800+ integrations, and affordable ingestion-based pricing of $0.15/GB, with no extra infra or data-transfer fees.
Book a free demo today to get started with CubeAPM.
Disclaimer: The information in this article reflects the latest details available at the time of publication and may change as technologies and products evolve.
FAQs
1. What are the best Pingdom alternatives?
Top contenders include CubeAPM, Datadog, New Relic, Dynatrace, Site24x7, UptimeRobot, Better Stack, and Uptime.com. Your choice depends on whether you need just website monitoring or full-stack observability (APM, logs, infra, RUM, synthetics).
2. Why switch from Pingdom?
Many teams outgrow Pingdom as it’s only focused on RUM and synthetics, not full-stack observability capabilities, and can be costly for smaller teams. Some users also experienced occasional alert issues.
3. Which tool is the closest like-for-like Pingdom replacement?
For outside-in monitoring with status pages and synthetics, Uptime.com, Site24x7, and Better Stack feel familiar. If you also want tracing, logs, and infra metrics in one place, consider CubeAPM, Datadog, or New Relic.
4. Which alternative is most cost-predictable at scale?
Tools that price by ingested data or offer clear unit economics are easier to forecast. CubeAPM uses $0.15/GB ingested (no extra infra or data-transfer fees) and includes RUM/synthetics, reducing surprise line items.
5. How hard is migration from Pingdom?
Basic synthetics and status pages are straightforward to re-create. For full-stack platforms, look for OpenTelemetry-native ingestion, import/migration utilities, and agent compatibility; CubeAPM supports OTel and common agents to speed cutover.


