LogRocket is a frontend monitoring and session replay platform that helps teams capture user sessions with console logs, network activity, and performance timings. Its standout features include pixel-perfect session replay, conditional recording, error tracking, and product analytics.
However, LogRocket lacks full-stack observability and offers a self-hosting option only in the Enterprise tier. Some G2 users say they experienced inconsistent session management, searching and filtering issues, and high costs with many sessions.
CubeAPM is the best LogRocket alternative with a full-stack observability suite, self-hosting options, cost-efficient pricing, and ease of setup and use. In this article, we’ll explore the top LogRocket alternatives based on features, pricing, deployment, and more.
Top 7 LogRocket Alternatives
- CubeAPM
- Datadog
- New Relic
- Dynatrace
- FullStory
- PostHog
- Smartlook
Why People Look for LogRocket Alternatives
Not a full-stack observability Solution
LogRocket is strong in session replay, frontend errors, and product analytics, but it doesn’t position itself as a full-stack observability solution. So, if you’re looking for a fully fledged observability solution, with APM, distributed tracing, infrastructure monitoring, etc., you may require additional tools.
Pricing complexity and steep scaling costs
LogRocket’s pricing is tied to the number of sessions per month and plan tier. Users on G2 also find the pricing to be expensive, which may not suit every team. For mid-size businesses capturing hundreds of thousands of sessions, LogRocket can be costly at scale.
Limited Self-Hosting
LogRocket is primarily a SaaS platform, which means data goes through their servers. Organizations with strict data residency needs must evaluate this carefully. That said, self-hosting is an option (where you can deploy LogRocket in your own cloud instance), but only available in the Enterprise tier, which may not suit all teams, especially smaller organizations.
Usability Issues
Some users on G2 express their concerns around LogRocket, citingdata masking issues in tracking, inconsistent session management, and difficulties in searching traces and filtering errors.
Criteria for Selecting LogRocket Alternatives
Full MELT coverage with backend visibility
Alternatives should go beyond replay and frontend metrics to provide true end-to-end MELT (Metrics, Events, Logs, Traces). This means capturing distributed traces, service metrics, and infrastructure health alongside user sessions. Full-stack coverage ensures teams can trace a frontend error all the way to a failing API or database query.
Native OpenTelemetry support
Look for platforms with first-class OTel support to future-proof observability investments. Native OTLP ingest makes it easier to collect telemetry from any runtime or service and avoids lock-in. OTel-based platforms also support richer trace correlation across distributed systems, which LogRocket does not offer.
Transparent and scalable pricing
Choose tools with clear $/GB or host-based pricing instead of opaque per-session tiers. This ensures costs scale predictably with telemetry volume, not traffic spikes. Transparent pricing helps avoid the “bill shock” many LogRocket users experience once they exceed session limits or require longer retention.
Smart sampling strategy
Advanced observability platforms implement tail-based or latency/error-aware sampling. Unlike session rules, these strategies retain the most valuable traces—slow requests, error-heavy flows, or anomalies—while filtering noise. This maximizes visibility while keeping storage and compute costs under control.
Deployment flexibility and compliance readiness
Enterprises increasingly require SaaS, self-host, and BYOC options. Alternatives should provide feature parity across deployments and guarantee compliance with regulations such as GDPR, HIPAA, and DPDP. Transparent data flow and storage documentation are critical for teams in finance, healthcare, and public sector environments.
Strong integration ecosystem
Top alternatives integrate with issue trackers, CI/CD pipelines, cloud providers, and Kubernetes out of the box. Seamless integration with Prometheus, Grafana, and incident management tools ensures observability fits naturally into existing DevOps workflows, reducing friction for adoption.
High-quality customer support
Finally, prioritize vendors offering fast, engineer-level support. Many LogRocket users cite delays or limited support responsiveness, especially on lower plans. Platforms that provide real-time support channels, clear SLAs, and hands-on onboarding reduce downtime and improve developer productivity.
LogRocket Overview
Known for
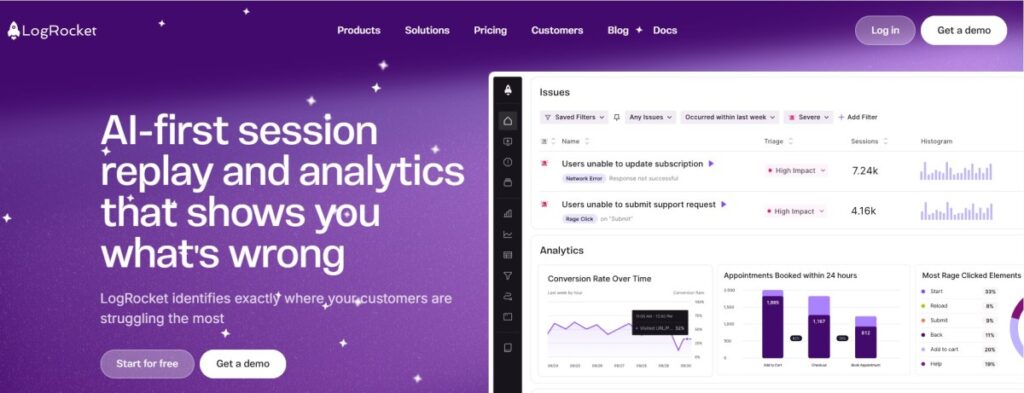
LogRocket is primarily known as a frontend monitoring and session replay platform. It helps teams record user sessions, capture performance issues, and surface errors to improve the digital experience. The tool’s focus is on enabling developers and product managers to understand exactly what users saw and did before a bug or error occurred.
Standout Features
- Pixel-perfect session replay: Provides high-fidelity replays of user actions with console logs and network events.
- Conditional recording: Allows teams to filter which sessions get recorded or retained, helping control costs.
- Galileo AI: Surfaces anomalies and user struggle points automatically using AI-driven insights.
- Self-hosting option: Offers SaaS and on-premise deployments across AWS, GCP, Azure, and Kubernetes clusters.
Key Features
- Error tracking: Captures JavaScript and mobile errors, linking them to affected sessions.
- Performance monitoring: Tracks frontend metrics such as load times, resource timing, and network requests.
- Product analytics: Includes funnels, path analysis, user flows, cohorts, and retention charts.
- Console and network logs: Automatically record console errors, warnings, and API/network calls.
- Integrations: Provides 40+ integrations with issue trackers, alerting systems, and analytics platforms.
- Data privacy controls: Enables masking or blocklisting of PII fields to meet compliance needs.
Pros
- Easy-to-use session replay for quick debugging
- Rich product analytics features like funnels and retention
- Offers SaaS and self-host deployment options
- Strong data privacy and masking controls
Cons
- Not a full-stack observability solution
- Session-based pricing can become costly at scale
- Self-hosting is only available in the Enterprise plan
Best for
LogRocket is best suited for frontend-heavy teams, SaaS companies, and digital product organizations that want to understand user journeys, replay errors, and improve product experiences. It’s ideal for product managers and developers focused on customer-facing bugs.
LogRocket Pricing & Customer Reviews
- Pricing starts at Free (1,000 sessions/month), with Team plans from $69/month, Professional from $295/month, and Enterprise at custom pricing.
- G2 rating: 4.6/5 (based on 2,100+ reviews).
- Praised for: Easy debugging, high-quality session replays, and strong product analytics.
- Criticized for: Steep pricing at higher usage levels
Top 7 LogRocket Alternatives
1. CubeAPM
Known for
CubeAPM is recognized as an OpenTelemetry-native observability platform that delivers a complete MELT stack. It combines APM, infrastructure monitoring, log analytics, synthetic checks, real user monitoring, and error tracking into one solution. Its focus is on giving enterprises end-to-end visibility at a much lower cost than legacy monitoring vendors.
Standout Features
- Smart Sampling: Prioritizes critical traces, like errors or latency spikes, while filtering noise, cutting data volume and cost.
- Bring Your Own Cloud (BYOC): Lets organizations host data in their own cloud to meet strict compliance requirements.
- Fast, developer-first support: Direct Slack and WhatsApp access with response times measured in minutes.
Key Features
- Distributed tracing: Complete service-to-service visibility with out-of-the-box OTel support.
- Log monitoring: High-volume log ingestion with contextual search and correlation.
- Infrastructure monitoring: Dashboards for Kubernetes clusters, VMs, containers, and cloud services.
- Synthetic monitoring: Automated tests for uptime and application performance.
- Real User Monitoring (RUM): Captures frontend performance and user flows.
- Error tracking: Detects and aggregates issues across frontend and backend systems.
- Deployment flexibility: Available as SaaS, self-hosted, or BYOC.
- 800+ integrations: Prebuilt connections with CI/CD pipelines, issue trackers, cloud providers, and more.
Pros
- Comprehensive MELT coverage in one tool
- Predictable pricing with strong cost efficiency
- Full OpenTelemetry support for easy instrumentation
- BYOC and self-hosting options for compliance needs
Cons
- Less ideal for teams that only want a fully managed SaaS product
- Focused on observability and does not extend into cloud security management
Best for
CubeAPM is best for SaaS providers, mid-to-large enterprises, and regulated organizations that need affordable, OpenTelemetry-first observability. It’s particularly valuable for companies seeking compliance-ready deployments, predictable pricing, and 360° visibility beyond frontend replay.
CubeAPM Pricing & Customer Reviews
- Pricing: $0.15 per GB of ingested data, with no added charges for infrastructure or data transfer.
- G2 Rating: 4.7/5
- Praised for: Transparent pricing, responsive support, and seamless OTel compatibility.
CubeAPM vs LogRocket
LogRocket focuses mainly on frontend replays and product analytics, whereas CubeAPM provides end-to-end observability across logs, traces, metrics, RUM, and infra monitoring. With smart sampling, OTel-native instrumentation, $0.15/GB pricing, and 800+ integrations, CubeAPM gives teams a broader, more predictable solution for scaling observability needs.
2. Datadog
Known for
Datadog is best known for comprehensive observability at scale, combining infrastructure monitoring, APM, logs, RUM/session replay, and synthetic tests under one roof. It’s built for cloud and hybrid environments, letting teams correlate metrics, traces, and logs across their full stack.
Standout Features
- Cross-telemetry correlation: Automatically tie together metrics, logs, traces, RUM, and synthetic tests for faster root cause.
- Modular architecture: Mix and match Datadog modules (APM, logs, security, synthetics).
- Agent & integrations: Rich agent capabilities and 900+ integrations enable capturing telemetry from nearly any component.
- Synthetic & RUM integration: Monitor frontend experience end-to-end; test APIs and user flows proactively.
Key Features
- Infrastructure Monitoring: Real-time host, container, and cloud metrics with auto-discover dashboards.
- APM / Tracing: Distributed tracing with code-level detail, correlating spans and services.
- Log Management: Ingest, archive, index logs; choose which logs are searchable.
- Real User Monitoring & Session Replay: Capture user sessions, page performance, and link to backend traces.
- Synthetic Monitoring: Run scripted and codeless API/browser tests across geographies.
- Error Tracking: Collect and group errors automatically, integrated across front and back ends.
- Custom Metrics: Track your own metric streams with scalability and tagging.
Pros
- Rich, mature feature set across observability domains
- Excellent integration coverage and telemetry correlation
- Powerful dashboards, alerting, and AI-assisted insights
- Strong scalability and enterprise trust
Cons
- Can be costky for smaller teams
- No self-hosting; only SaaS-based
Best for
Datadog is best for organizations with complex, multi-service infrastructures seeking an all-in-one observability platform that ties together frontend, backend, and infrastructure data.
Datadog Pricing & Customer Reviews
- Infrastructure Monitoring: Starts $15/host/month
- APM: $31/host/month for instrumentation and trace capture.
- Log Management: Priced in two parts — ingestion (e.g., $0.10/GB) and indexing/searchability (e.g. $1.70 per million log events to make them searchable) — which means you pay twice for the same data if you require search/alerts.
- G2 rating: 4.4/5.
- Praised for: Strong telemetry correlation, integrations, real-time observability, and feature depth.
- Criticized for: Price, learning curve
Datadog vs LogRocket
LogRocket excels at frontend session replay, UI context, and product analytics. Datadog, however, covers the full stack—from infrastructure to traces to logs—and lets you correlate user sessions with backend behavior, making it a more powerful choice.
3. New Relic
Known for
New Relic is best known for its application performance monitoring (APM) and full-stack observability, designed to help teams correlate frontend, backend, and infrastructure issues in one platform.
Standout Features
- APM 360 and Transaction 360: Deep code-level visibility with correlated service maps and transaction insights.
- Browser and RUM monitoring: Track Core Web Vitals, frustration signals, and distributed traces tied to frontend issues.
- Mobile monitoring: Crash reporting and latency analytics for iOS and Android apps.
- Pathpoint: A Business observability tool that maps user journeys to backend services to identify where business KPIs are impacted.
Key Features
- Infrastructure monitoring: Real-time metrics for hosts, containers, Kubernetes, and cloud services.
- Log management: Ingest logs at scale, decide what to make searchable, and analyze logs in context with traces and errors.
- Synthetic monitoring: API and browser checks with codeless and scripted monitors from global or private locations.
- Error tracking (Errors Inbox): Groups and prioritizes issues across frontend, backend, and serverless.
- Open standards support: Compatible with OpenTelemetry, OTLP, and 780+ prebuilt integrations.
Pros
- Broad MELT coverage in one platform
- Strong APM with advanced trace correlation
- Flexible instrumentation with agents and OpenTelemetry
- 780+ integrations and quickstarts
Cons
- Pricing can get expensive at very high volumes
- SaaS-only; no self-hosting
Best for
New Relic is best for teams that want to unify frontend monitoring, backend traces, and infrastructure visibility in one place. It’s particularly strong for enterprises seeking business observability (Pathpoint) and those that want flexibility between agent-based instrumentation and OpenTelemetry ingest.
New Relic Pricing & Customer Reviews
- Data ingest: 100 GB/month free; after that, $0.40 per GB for standard data ingest.
- Users: Free, paid starts at $49/user/month
- G2 rating: 4.4/5
- Praised for: Comprehensive APM, strong dashboards, and correlation across telemetry
- Criticized for: Pricing, learning curve
New Relic vs LogRocket
LogRocket specializes in frontend session replay and product analytics, while New Relic provides end-to-end observability—APM, logs, infra, RUM, synthetics, and business journey mapping. For organizations that need deeper backend and infrastructure visibility alongside frontend monitoring, New Relic is a broader and more powerful choice.
4. Dynatrace
Known for
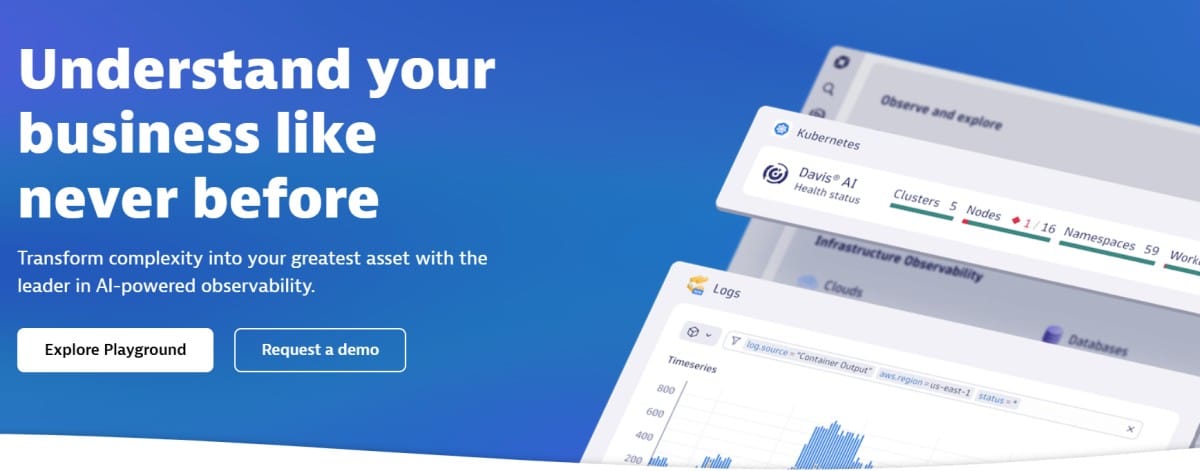
Dynatrace is known for end-to-end observability with AI-driven analytics, unifying infrastructure and application observability, logs, digital experience (RUM, Session Replay, synthetics), and business analytics on one platform. It combines automatic instrumentation (OneAgent), OpenTelemetry ingest, and Davis® causal-AI to speed root-cause analysis.
Standout Features
- Davis® AI & Smartscape: Automatic topology mapping with causal AI that correlates metrics, traces, logs, and events for precise, explainable root cause.
- Grail analytics lakehouse: Store and analyze logs, traces, metrics, and business events in one place with high-speed contextual queries.
- Digital Experience (RUM, Session Replay, Synthetics): Follow real user sessions end-to-end, replay journeys, and run global API/browser tests.
- OneAgent + OpenTelemetry: Enterprise-scale auto-instrumentation with seamless OTel ingestion for flexible data capture.
Key Features
- Application observability: Distributed tracing, code-level profiling, database visibility, and deployment analysis for modern stacks.
- Infrastructure observability: Continuous discovery across hosts, containers, Kubernetes, networks, and services with AI insights.
- Log management & analytics: High-volume ingest with contextual retention and querying in Grail.
- Digital experience monitoring: Real User Monitoring, Session Replay, Mobile monitoring, and Synthetics tied to backend health.
- Business analytics: Map journeys and KPIs to the exact services and dependencies impacting outcomes.
Pros
- Unified platform spanning MELT, DEM, and business analytics
- Causal-AI root cause with automatic topology
- Strong RUM/Session Replay and Synthetics integrated with traces
- OpenTelemetry support alongside OneAgent
Cons
- Expensive for smaller teams
- Steep learning curve
Best for
Enterprises that want a single, AI-driven observability platform linking user experience to services, databases, Kubernetes, and cloud infrastructure. It’s especially strong for complex multi-cloud estates that benefit from automatic instrumentation, topology, and cross-signal analytics.
Dynatrace Pricing & Customer Reviews
- Pricing: Full-Stack Monitoring: $0.01 per memory-GiB-hour (or ~$0.08/hour for an 8 GiB host)
- G2 rating: 4.5/5
- Praised for: AI-driven root cause analysis, full-stack observability, and seamless integration across telemetry signals.
- Criticized for: Pricing, learning curve for new users
Dynatrace vs LogRocket
LogRocket specializes in frontend session replay and product analytics, while Dynatrace extends from user sessions and replays to backend traces, infrastructure, logs, and business events—all tied together with Davis® AI and Grail. If you need to correlate UX with backend services, databases, and Kubernetes, Dynatrace offers a broader solution with AI-powered root-cause diagnostics.
5. FullStory
Known for
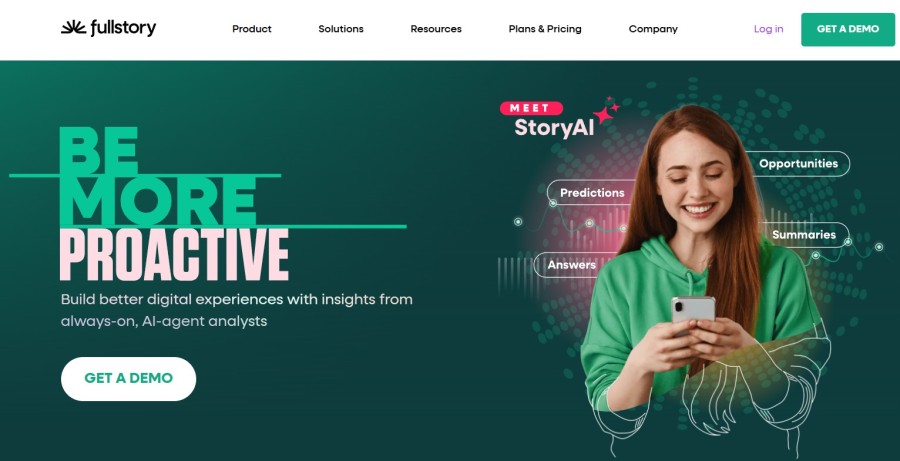
FullStory is a behavioral data platform built around autocapture (“Fullcapture”) with high-fidelity session replay, product analytics, mobile analytics, and embedded AI (StoryAI). It’s designed to connect qualitative replays with quantitative funnels, journeys, and metrics so teams can move from “what happened” to “why” fast.
Standout Features
- Fullcapture (autocapture): Tagless, retroactive data collection that maps user behavior across web and mobile without manual event setup.
- StoryAI: Built-in generative AI that summarizes sessions, surfaces opportunities, and answers questions using Fullcapture data.
- Session Replay with AI summaries: One-click summaries accelerate triage and sharing of context across teams.
- Mobile SDK performance: Lightweight capture (~100 KB/min typical payload) that records draw instructions, not screens, for privacy and speed.
- Warehouse: Hourly exports of clean, analytics-ready views (or raw events) to BigQuery, Snowflake, Redshift, S3, GCS, or Azure.
Key Features
- Product analytics: Funnels, journeys, retention, sentiment signals, dashboards, and conversion analysis tied to Session Replay.
- Session replay & dev tools: High-fidelity replays with privacy controls and developer tools for faster debugging.
- Mobile analytics: iOS/Android and cross-platform support (Flutter, React Native, etc.) with low overhead.
- Privacy by default: Sensitive data excluded in-device with configurable masking and consent options.
- Data ecosystem (Anywhere): Warehouse exports and activation to Power BI, CDP/CRM, and real-time personalization.
Pros
- Autocapture reduces tagging and speeds time-to-insight
- AI-assisted analysis (StoryAI) helps teams find opportunities faster
- Strong privacy controls and a non-screenshot capture model
- Warehouse and activation options for data teams and marketers
Cons
- Can be expensive for smaller teams
- Learning curve for advanced analytics features and configuration
Best for
Teams that want a single platform to capture behavior automatically, analyze with product analytics, and debug with high-fidelity session replay—plus the option to stream structured behavioral data into a warehouse for BI, modeling, and activation.
FullStory Pricing & Customer Reviews
- Pricing: Pricing is not published. Free trial (14 days, up to 5,000 sessions), Free plan (30,000 monthly sessions with 12-month retention), and paid Business, Advanced, and Enterprise tiers; pricing provided upon request.
- G2 rating: 4.5/5 (819+ reviews).
- Praised for: Autocapture coverage, AI-generated summaries, and privacy-by-default controls.
- Criticized for: Learning curve, expensive
FullStory vs LogRocket
Both platforms deliver session replay and product analytics; FullStory leans into tagless autocapture, StoryAI-assisted insights, and warehouse/activation pipelines for cross-team use, while LogRocket is often adopted first by engineering and product teams for replay-centric debugging with analytics. Use cases requiring AI-assisted triage and warehouse-ready behavioral data tend to favor FullStory.
6. PostHog
Known for
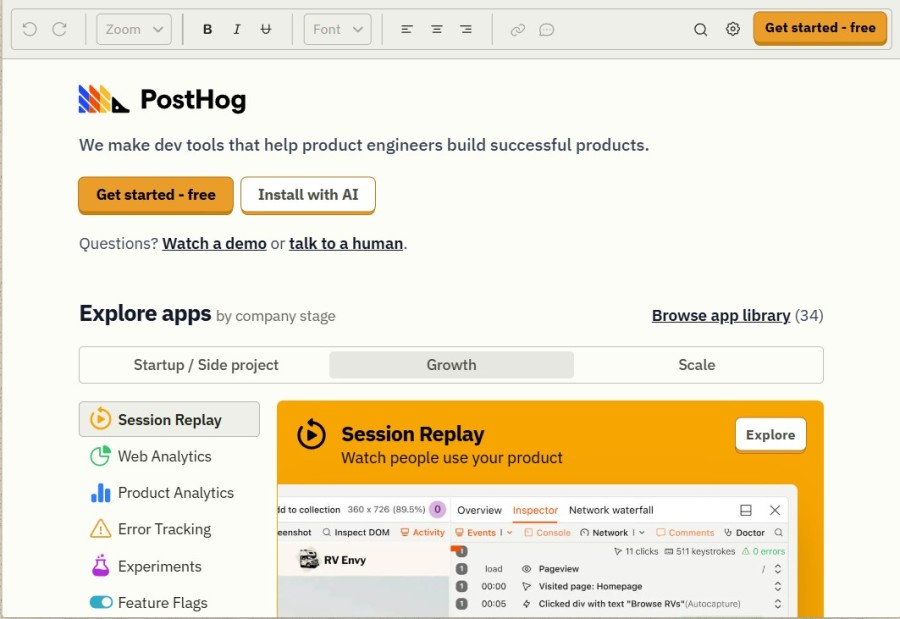
PostHog is an open-source product observability platform that combines product analytics, session replay, feature flags, A/B testing, and surveys in one toolkit. It’s designed for teams that want transparency, self-hosting flexibility, and clear usage-based pricing without vendor lock-in.
Standout Features
- All-in-one toolkit: Combines analytics, session replay, feature flags, experiments, and surveys in one platform.
- Open-source & self-hosted: Flexible deployment with cloud, your cloud, or fully self-managed options.
- Transparent usage pricing: Clear per-event and per-recording rates with generous free allowances.
- Data ownership: Options to run PostHog in your own infrastructure and control exactly where data is stored.
Key Features
- Product analytics: Funnels, trends, retention, paths, and cohorts to understand user behavior.
- Session replay: Watch user sessions to diagnose bugs and UX issues with filters and event context.
- Feature flags & experiments: Ship changes gradually, run A/B tests, and manage rollouts safely.
- Surveys: Collect user feedback directly inside your product.
- Data warehouse sync: Export events to Snowflake, BigQuery, or Redshift for advanced BI.
- Open-source extensibility: Extend the platform with plugins, APIs, and community-driven features.
Pros
- Transparent, published pricing with free allowances
- Open-source with self-hosting for compliance and control
- Reduces tool sprawl by unifying analytics, replay, and experimentation
- Strong developer community and plugin ecosystem
Cons
- Steep learning curve
- Complex UI
Best for
PostHog is best for engineering-led product teams that want full visibility into user behavior while retaining control of their data. It’s especially useful for companies that prefer open-source tools, want to avoid vendor lock-in, and need an all-in-one toolkit to replace multiple SaaS subscriptions.
PostHog Pricing & Customer Reviews
- Pricing: Free plan includes 1 million events and 15,000 session recordings per month; then $0.000045 per event and $0.005 per session recording. Feature flags, experiments, and surveys are included at no extra cost.
- G2 rating: 4.5/5 (900+ reviews).
- Praised for: Transparent pricing, self-hosting flexibility, and powerful all-in-one coverage.
- Criticized for: Steeper learning curve and occasional UI issues
PostHog vs LogRocket
LogRocket focuses primarily on session replay and frontend debugging, while PostHog adds analytics, experiments, feature flags, and surveys on top of replay. For teams that want a single open-source toolkit with predictable pricing and data control, PostHog offers a broader and more flexible alternative.
7. Smartlook
Known for
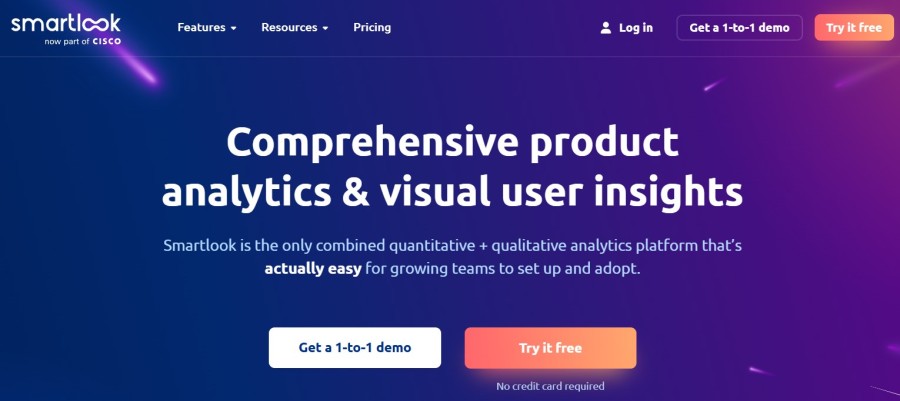
Smartlook is known for session recording and product analytics for web and mobile apps. It helps teams visualize user behavior through replays, heatmaps, funnels, and events, making it easier to uncover friction points and optimize digital experiences.
Standout Features
- Session recordings: High-quality replays that show exactly how users interact with websites or apps.
- Heatmaps: Visualize clicks, scrolls, and attention patterns to identify where users engage or drop off.
- Events: Track custom user actions without extra coding using no-code event tracking.
- Funnels: Combine events into funnels to find where users abandon critical journeys.
- Crash reports: Diagnose crashes by linking error logs directly to replay sessions.
Key Features
- Mobile app analytics: Session recording, heatmaps, and crash reporting tailored for iOS and Android apps.
- Website analytics: Analyze user journeys, clicks, and engagement on web platforms.
- Retention tracking: Measure how often users return and how long they stay active.
- Integrations: Works with tools like Slack, Google Analytics, and others for smoother workflows.
- Privacy controls: Options to mask sensitive data and configure GDPR-compliant tracking.
Pros
- Easy setup with no-code event tracking
- Combines session replays with analytics (heatmaps, funnels, events)
- Works across both web and mobile apps
- Crash reports tied directly to replay sessions
Cons
- Cluttered UI
- Limited features
Best for
Smartlook is best for product, UX, and engineering teams in SMBs and mid-market companies that need actionable insights into how users interact with their digital products. It’s ideal for teams that want an affordable, easy-to-use replay and analytics platform for both websites and mobile apps.
Smartlook Pricing & Customer Reviews
- Pricing: Free plan includes up to 3,000 sessions/month; paid Pro plan starts at $55/month with higher session limits; Enterprise plan offers custom pricing and advanced features.
- G2 rating: 4.6/5 (870+ reviews).
- Praised for: Ease of setup, intuitive session recordings, and value for money.
- Criticized for: UI issues
Smartlook vs LogRocket
LogRocket emphasizes developer-focused debugging and frontend error tracking, while Smartlook prioritizes UX insights with recordings, heatmaps, funnels, and events. For teams that want a more accessible, design- and product-focused replay tool covering both web and mobile, Smartlook offers a simpler and more affordable alternative.
Conclusion
While LogRocket delivers solid session replay and product analytics, it is not a full-stack observability solution, has limited self-hosting, and can have issues with session management.
CubeAPM is the best LogRocket alternative, offering full-stack observability solution, self-hsoting, ease of use, and rich features, such as smart sampling, 800+ integrations, and more. It’s also cost-efficient with just $0.15/GB of data ingested with no extra infra or egress charges.
Book a free demo with CubeAPM today.
Disclaimer: The information in this article reflects the latest details available at the time of publication and may change as technologies and products evolve.
FAQs
1. What are the best LogRocket alternatives in 2025?
Some of the best LogRocket alternatives include CubeAPM, Datadog, New Relic, Dynatrace, FullStory, PostHog, and Smartlook. These tools vary in focus, from full-stack observability (CubeAPM, Datadog, Dynatrace) to behavior analytics and product insights (FullStory, Smartlook).
2. Why should teams consider LogRocket alternatives?
Teams look for LogRocket alternatives because of its limited observability features, self-hosting only available in the Enterprise plan, and a learning curve for beginners.
3. Which LogRocket alternative is best for full observability?
CubeAPM is the best LogRocket alternative with full observability, complete MELT coverage, OTEL-native instrumentation, smart sampling, and support for self-hosted deployment—all at $0.15/GB with no hidden costs.
4. Are there free LogRocket alternatives available?
Yes. Tools like PostHog and FullStory provide free plans with session replay and analytics features, though they have usage limits. CubeAPM also offers cost-effective pricing that scales, making it a practical option for teams moving beyond free tiers.
5. Which LogRocket alternative is best for startups?
For startups, CubeAPM and PostHog are strong options. CubeAPM ensures predictable costs and enterprise-grade observability from day one, while PostHog’s open-source model and free allowances help early-stage teams manage budgets effectively.


