The main difference between Azure Monitor, Sentry, and CubeAPM is based on their primary focus: cloud-native infrastructure monitoring, developer-centric error tracking, or full-stack, self-hosted observability.
Azure Monitor is designed for organizations running workloads inside Microsoft Azure, offering deep integration with Azure services and centralized cloud monitoring. Sentry focuses on application-level error tracking, release visibility, and developer debugging workflows across frontend and backend environments.
CubeAPM provides OpenTelemetry-native, full MELT observability with self-hosted deployment options, predictable ingestion-based pricing, and control over data residency. It’s suitable for teams operating distributed microservices at scale.
In this Azure Monitor vs Sentry vs CubeAPM comparison, we evaluate deployment models, pricing structure, sampling strategy, data retention, support, and practical use cases.
Azure Monitor vs Sentry vs CubeAPM Comparison
This comparison is based on publicly available information from official vendor documentation and standard production deployment patterns as of today. Actual pricing, retention limits, sampling behavior, and support response times may vary depending on region, configuration, workload scale, and selected plan or support tier.
| Feature | CubeAPM | Azure Monitor | Sentry |
| Known for | Unified MELT, native OTEL, self-hosting, cost predictability | Native Azure monitoring & diagnostics | Error tracking and developer-focused APM |
| Multi-Agent Support | Yes (OTel, New Relic, Datadog, Elastic, etc.) | Limited (Azure Monitor Agent, OTel) | Limited (OTel & multiple SDKs) |
| MELT Support | Full MELT coverage | Full MELT coverage | Limited (infra); traces & logs focused |
| Deployment | Self-hosted with vendor-managed | SaaS (Fully managed AWS service) | SaaS; self-hosted |
| Pricing | Ingestion-based: $0.15/GB | Logs: $0.50/GB Metrics: $0.16/10 million samples ingested | OSS: Free; paid: $26-$80 per month; Enterprise: custom |
| Sampling Strategy | Smart sampling, automated, context-aware | Fixed-percentage, rate-limited sampling | Dynamics (rule-based) sampling |
| Data Retention | Unlimited Retention | Basic Logs: 30dCustom Metrics: 90d | Free: 30d; Paid: 90d; Enterprise: custom |
| Support Channel & TAT | Slack, WhatsApp; response in minutes | Email, chat, phone; TAT: 8 hr to 15 min (plan-based) | Community-based & email, Enterprise: account manager |
Azure Monitor vs Sentry vs CubeAPM: Feature Breakdown
Known For
CubeAPM: CubeAPM is positioned as a unified observability and APM platform that collects and correlates telemetry from applications and infrastructure, offering dashboards, alerts, and visual analysis tools to help teams visualize and query data. It supports MELT-style signals (metrics, events, logs, traces) and integrates with OpenTelemetry agents for standardised telemetry ingestion across environments.
Azure Monitor: Azure Monitor is Microsoft’s comprehensive cloud monitoring service for Azure and hybrid environments. It collects, analyses, and responds to telemetry from applications and Azure resources using a common data platform, helping teams maximise availability and performance across infrastructure, applications, and services.
Sentry: Sentry is a developer-centric observability tool that specialises in error tracking, performance monitoring, and distributed tracing for applications. It emphasises real-time error detection, stack traces, and transaction performance, allowing developers to diagnose and fix issues that affect user experiences.
Multi-Agent Support
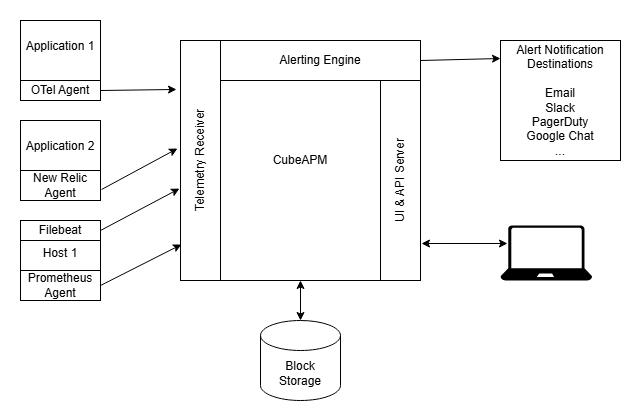
CubeAPM: CubeAPM’s official documentation shows that it supports multiple instrumentation agents and data sources, including OpenTelemetry agents natively, and can receive telemetry from existing agents like Datadog, New Relic, or Elastic instruments, making it easier to adopt without re-instrumenting everything from scratch.
Azure Monitor: Azure Monitor supports telemetry collection through the Azure Monitor Agent, Azure Monitor OpenTelemetry distro, and Application Insights SDKs. It can ingest OpenTelemetry-based telemetry for traces, logs, and metrics using the Azure Monitor OpenTelemetry exporter and SDKs for languages such as .NET, Node.js, and Python.
Sentry: Sentry supports OpenTelemetry for tracing and can ingest telemetry via the OpenTelemetry SDK or OTLP endpoints, allowing traces and spans instrumented with OpenTelemetry tooling to be sent to Sentry, alongside its native SDKs.
MELT Support
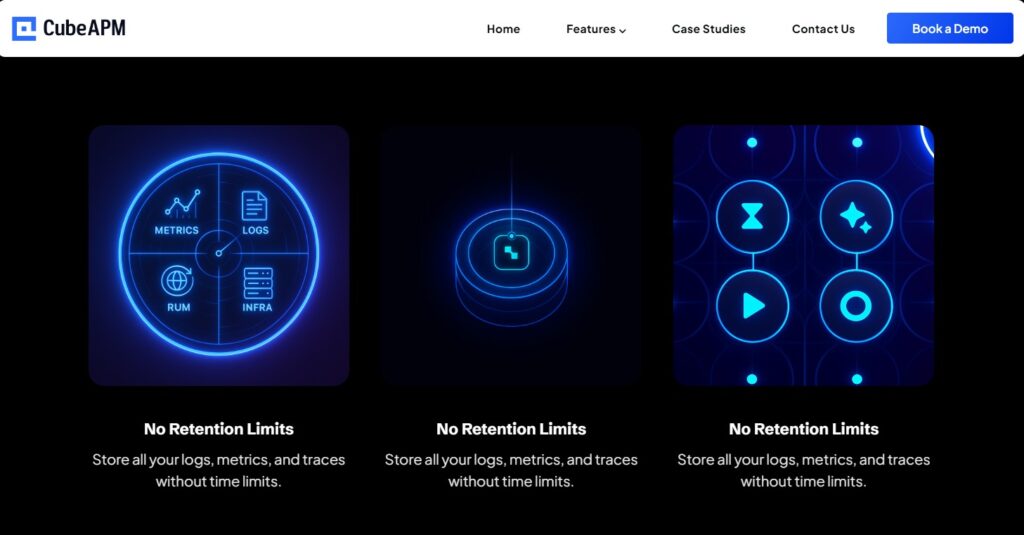
CubeAPM: CubeAPM officially positions itself as a unified observability platform that supports full MELT telemetry, metrics, events, logs, and traces, in a correlated and searchable dataset. It integrates telemetry from OpenTelemetry agents and other sources into a single backend with dashboards, alerts, and analysis tools. This comprehensive coverage helps teams troubleshoot both application performance and infrastructure health.
Azure Monitor: Azure Monitor collects and analyses metrics, logs, and traces across Azure services and applications. It uses Azure Monitor Metrics, Azure Log Analytics, and Application Insights to provide a full view of cloud and hybrid environments, though some advanced features (e.g., deep trace sampling configuration) can depend on specific components within the Azure Monitor family.
Sentry: Sentry focuses on application-level telemetry, specialising in error tracking and performance monitoring with traces and events. While it provides logs and trace data tied to application errors and transactions, it does not position itself as a full infrastructure monitoring platform covering all MELT signals in the same way that general observability platforms do.
Deployment
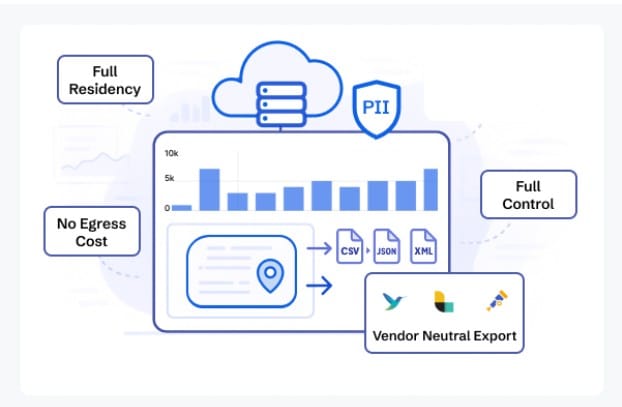
CubeAPM: CubeAPM supports both self-hosted deployment and vendor-managed options. You can deploy the observability stack within your own cloud or on-prem environment, giving you control over where telemetry data resides and how it’s managed. CubeAPM’s docs cover installation on Kubernetes and other environments using Helm charts and standard deployment workflows.
Azure Monitor: Azure Monitor is offered as a fully managed SaaS service within the Microsoft Azure ecosystem. Telemetry collection and storage are handled by Azure’s backend, with no infrastructure for users to host or manage. This simplifies setup but means control over the backend resides with Microsoft.
Sentry: Sentry is primarily available as a hosted SaaS service provided by Sentry.io. It also offers a self-hosted open-source option that you can deploy on your own infrastructure, though this requires more operational management compared to the SaaS alternative.
Pricing for Small, Mid, and Large Teams
*All pricing comparisons are calculated using standardized Small/Medium/Large team profiles defined in our internal benchmarking sheet, based on fixed log, metrics, trace, and retention assumptions. Actual pricing may vary by usage, region, and plan structure. Please confirm current pricing with each vendor.
| Approx. cost for teams (size) | Small (~30) | Mid-Sized (~125) | Large (~250) |
| CubeAPM | $2,080 | $7,200 | $15,200 |
| Azure Monitor | $2,064 | $5,232 | $13,228 |
| Sentry | $3,560 | $12,100 | $32,400 |
CubeAPM Costs in Detail
CubeAPM: CubeAPM uses a transparent, usage-based pricing model listed on its official pricing page. Telemetry ingestion (traces, logs, and metrics) is billed at around $0.15 per GB ingested, with predictable costs and no per-host or per-user fees. This model applies uniformly across CubeAPM’s APM, infrastructure, logs, RUM, and synthetic monitoring features.
Pricing for different team sizes:
- Small teams (~ 30): $2,080
- Mid-sized teams (~ 125): $7,200
- Large teams (~250): $15,200
Azure Monitor Cost in Detail
Azure Monitor: Azure Monitor’s pricing is largely data-usage and feature-tier based. According to Azure’s official pricing documentation, log ingestion is charged at approximately $0.50 per GB, and custom metric ingestion (e.g., for detailed telemetry beyond standard metrics) can be priced around $0.16 per 10 million samples ingested. These figures come directly from Azure’s published pricing calculator and Log Analytics pricing pages, though exact regional prices can vary. Retention beyond included days incurs additional charges (e.g., ~$0.10 per GB/month).
Here’s how pricing looks for different team sizes:
- Small teams: $2,064
- Mid-size teams: $5,232
- Large teams: $13,228
Sentry Cost in Detail
Sentry: According to Sentry’s official pricing page, Sentry offers a tiered subscription model where plans start with a Free tier, then paid plans such as Team (~$26/month) and Business (~$80/month). All plans include a base volume of logs/events, and additional log volume above included quotas is typically billed at around $0.50 per GB of extra logs ingested. Enterprise options with custom pricing are available via sales. (source: sentry.io/pricing).
Pricing for different team sizes:
- Small teams: $3,560
- Mid-size teams: $12,100
- Large teams: $32,400
Teams begin noticing these pricing differences once telemetry volume increases beyond early-stage usage, especially in microservices environments with sustained traffic or high-cardinality logs. At that point, observability shifts from a predictable tooling cost to a variable operational expense that requires active monitoring and forecasting.
Sampling Strategy

CubeAPM: CubeAPM uses smart, context-aware sampling that prioritises storing high-value traces (for example, slow or error-related spans) and reduces low-value noise to optimise cost and diagnostic clarity. This automated approach goes beyond fixed percentages, adjusting sampling based on workload patterns and contextual signal importance.
Azure Monitor: Azure Monitor’s Application Insights supports configurable sampling, including fixed-percentage and adaptive rate-limiting sampling, to help control data volume and cost. Users set sampling rates or thresholds, but the behaviour is generally defined by configured percentages rather than real-time context analysis.
Sentry: Sentry offers dynamic (rule-based) sampling, letting teams define rules to keep or drop events based on environment, transaction name, error rate, or performance characteristics. This approach gives developers flexible control over how much telemetry and which types of events are captured and stored.
Data Retention
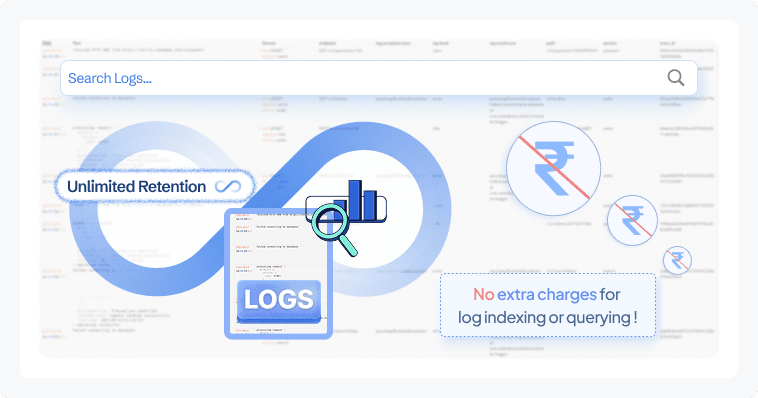
CubeAPM: CubeAPM offers unlimited data retention for telemetry by default with no additional retention-based charges. Whether you retain traces, logs, metrics, or events for months or years, there is no per-GB retention fee on top of ingestion costs. This is consistent across self-hosted and managed options based on CubeAPM’s official documentation and pricing positioning.
Azure Monitor: Azure Monitor’s retention policies and default retention lengths are published in Microsoft’s documentation:
- Log Analytics (Azure Monitor logs):
- 31 days free retention included for logs in a workspace by default.
- You can configure retention up to 730 days (2 years) or beyond.
- Retention beyond the included 31 days incurs additional charges (billed per GB per month). Microsoft’s pricing calculator shows extended retention at region-dependent rates typically starting around ~$0.10 per GB per month (varies by region/workspace tier).
- Metrics:
- Platform metrics are retained for 93 days by default with no extra charge.
- Custom metric samples and Prometheus metric data can be retained for up to 2 years when using Azure Monitor managed Prometheus, which may incur retention charges if configured.
Sentry: Sentry’s official pricing page and documentation specify the following typical retention windows based on plan:
- Free tier: 30 days of data retention.
- Team plan: 90 days of retention.
- Business plan: 90 days of retention.
- Enterprise plans: Custom retention can be negotiated, often extending beyond 90 days based on contract terms.
This retention covers error events, transaction traces, sessions, and performance data, depending on plan level.
Support Channel & TAT
CubeAPM: CubeAPM provides direct support channels, including Slack and WhatsApp access to core engineers, with response times typically described as minutes-level turnaround based on official sales and support materials. Email support is also available. Enterprise customers may receive priority handling depending on agreement terms.
Azure Monitor: Azure Monitor support is delivered through Microsoft Azure’s official support plans. Response time depends entirely on the selected support tier:
- Basic plan: No technical support included.
- Developer plan: Initial response typically within 8 business hours.
- Standard plan:
- Severity A (critical): < 1 hour
- Severity B: < 4 hours
- Professional Direct:
- Severity A: < 1 hour
- Severity B: < 2 hours
- Unified/Premier Support: Can provide as low as 15-minute response targets for critical cases.
Support channels include Azure Portal support tickets, email, and phone depending on plan.
Sentry: Sentry’s support varies by plan:
- Free plan: Community support via forums and documentation.
- Team & Business plans: Email support included.
- Business plan: Access to enhanced support and faster response SLAs (exact response times are not publicly fixed).
- Enterprise plan: Dedicated account manager and contractual SLA response times (custom-defined per agreement).
How Teams Evaluate These Platforms at Scale
Once feature comparisons are clear, the decision usually shifts from “what does it do?” to “how will this behave in production?” At scale, observability choices affect cost control, compliance posture, incident response speed, and long-term operational complexity.
Who Is Involved in the Decision
- Engineering teams evaluate instrumentation effort, trace visibility, debugging workflows, and integration complexity across microservices.
- Finance teams focus on cost predictability, ingestion growth, retention pricing, and whether the pricing model scales linearly or becomes variable with traffic spikes.
- Security and compliance teams assess data residency, access controls, encryption, and whether telemetry is stored inside the organization’s own cloud boundary or in a vendor-managed SaaS environment.
In many mid-to-large organizations, observability is no longer a purely engineering decision. It becomes cross-functional once data volume and compliance risk increase.
What Questions Typically Block Decisions
- Will telemetry costs increase unpredictably as traffic grows?
- How much operational overhead does self-hosting introduce?
- Do we need full MELT coverage, or is error tracking sufficient?
- Can we meet regional data localization requirements?
- How does sampling impact trace completeness during incidents?
These questions often delay procurement more than feature gaps.
Why Comparisons Alone Aren’t Enough
Side-by-side tables help narrow options, but real-world evaluation usually requires modeling actual ingestion volume, expected retention periods, and peak traffic scenarios. A platform that looks similar at 5 GB per day may behave very differently at 500 GB per day.
Teams often run proof-of-concept deployments or cost simulations before committing, especially in distributed systems with high-cardinality telemetry.
Azure Monitor vs Sentry vs CubeAPM: Use Cases
Each of these platforms serves a different operational need. The right choice depends less on features alone and more on architecture, scale, compliance requirements, and cost behavior in production.
Choose CubeAPM if:
CubeAPM is suited for teams that need full-stack visibility with deployment flexibility and predictable cost behavior as telemetry volume grows.
- You need full MELT observability (metrics, events, logs, traces) across microservices and infrastructure in one correlated system.
- You want a self-hosted, OpenTelemetry-based alternative where telemetry data stays inside your own cloud for strict data residency or compliance requirements.
- You are operating high-throughput Java services (Spring Boot, Micronaut, Quarkus) and require distributed tracing across JVM-based microservices with minimal instrumentation overhead.
- You need end-to-end tracing across microservices to reduce mean time to resolution (MTTR) during production incidents.
- You are a scaling startup or mid-sized SaaS company concerned about observability costs becoming unpredictable as traffic increases.
- You want predictable ingestion-based pricing (~$0.15/GB based on official pricing) instead of host-based or per-user pricing tiers.
- You require unlimited data retention for long-term trend analysis, audits, or historical debugging (based on official product documentation).
- You are migrating from tools like Datadog or New Relic and want OpenTelemetry-native compatibility without re-instrumenting your stack.
- You operate in regulated industries (fintech, healthcare, government) where telemetry must remain within specific regions or VPC boundaries.
Based on demo and sales discussions, teams often consider CubeAPM when observability shifts from a debugging tool to a cost-managed operational platform.
Choose Azure Monitor if:
Azure Monitor is best suited for organizations deeply integrated into the Microsoft Azure ecosystem.
- Your workloads primarily run on Azure services such as Azure VMs, Azure Kubernetes Service (AKS), Azure SQL, or App Services.
- You want native integration with Azure resource diagnostics, Activity Logs, and platform metrics without deploying additional infrastructure.
- You prefer a fully managed SaaS monitoring solution tightly coupled with Azure identity, RBAC, and security models.
- You are already standardized on Azure support plans and want consolidated billing through Microsoft.
- You need centralized monitoring for hybrid or multi-region Azure deployments with built-in integration to Azure Policy and governance tools.
- Your team is comfortable managing Log Analytics workspaces and ingestion-based pricing models as documented on Microsoft’s official pricing pages.
- You require managed Prometheus for Kubernetes metrics within Azure Monitor’s ecosystem.
Azure Monitor is commonly selected by enterprises that prioritize Azure-native integration over cross-cloud flexibility.
Choose Sentry if:
Sentry is optimized for developer-centric error tracking and performance debugging at the application layer.
- You are primarily focused on frontend and backend error tracking rather than full infrastructure observability.
- You need real-time stack traces, release tracking, and issue grouping tied to code deployments.
- You are a startup or product engineering team looking for lightweight, easy-to-deploy APM focused on debugging.
- You want dynamic, rule-based sampling for performance monitoring tied directly to application transactions.
- You need strong visibility into JavaScript, React, Node.js, Python, or mobile application crashes affecting user experience.
- You prefer a SaaS-first deployment with optional self-hosted capability.
- Your use case centers around identifying and fixing user-facing errors quickly rather than managing infrastructure telemetry at scale.
Sentry is typically chosen when engineering productivity and rapid debugging are the primary goals, especially in product-focused teams.
Conclusion
Azure Monitor, Sentry, and CubeAPM address different observability priorities. Azure Monitor fits organizations deeply invested in the Azure ecosystem and looking for native cloud integration. Sentry excels at developer-focused error tracking and application performance visibility. CubeAPM focuses on unified MELT observability with self-hosted flexibility and predictable ingestion-based pricing.
For teams operating distributed microservices, high-traffic systems, or regulated environments, deployment control and cost behavior often influence the final decision. CubeAPM stands out for OpenTelemetry-native support, unlimited retention, and context-aware sampling while remaining infrastructure-agnostic.
Evaluate your architecture, scale, and compliance needs carefully. If full-stack, predictable observability matters, explore CubeAPM’s demo to see how it fits your environment.
Disclaimer: The information in this article reflects the latest details available at the time of publication and may change as technologies and products evolve.
FAQs
1. Can Azure Monitor, Sentry, and CubeAPM be used together?
Yes. Some teams use Azure Monitor for Azure infrastructure metrics, Sentry for application error tracking, and a full observability platform like CubeAPM for centralized MELT correlation. However, running multiple tools increases telemetry duplication and operational overhead, so teams often consolidate once scale increases.
2. Which tool is better for multi-cloud environments?
Azure Monitor is optimized for Azure workloads, though it supports hybrid scenarios. Sentry is cloud-agnostic for application monitoring. CubeAPM is infrastructure-agnostic and OpenTelemetry-native, which can simplify multi-cloud or hybrid deployments where telemetry needs to be standardized across environments.
3. How do these tools handle OpenTelemetry adoption?
Azure Monitor supports OpenTelemetry via Azure Monitor OpenTelemetry exporters and SDKs. Sentry supports OpenTelemetry for tracing alongside its native SDKs. CubeAPM is built around OpenTelemetry ingestion, making it suitable for teams standardizing on OTEL as their primary telemetry framework.
4. Which platform is more suitable for Java-heavy architectures?
Sentry provides strong Java SDK support for error tracking and performance monitoring. Azure Monitor integrates with Java applications via Application Insights and OpenTelemetry. CubeAPM supports OpenTelemetry-based Java instrumentation (e.g., Spring Boot, JVM services) for distributed tracing across microservices, which is useful in large-scale Java environments.
5. How does vendor lock-in differ between these platforms?
Azure Monitor is tightly integrated with Azure services, which can increase ecosystem dependency. Sentry is application-layer focused and easier to integrate across platforms. CubeAPM’s OpenTelemetry-native approach allows teams to instrument once using open standards, which may reduce switching friction compared to proprietary agent ecosystems.


