The main difference between Datadog, Grafana, and CubeAPM is how they approach observability ownership and cost.
Datadog is a SaaS-first platform optimized for fast adoption and breadth of features. Grafana is a modular, open-source stack focused on visualization and flexibility. CubeAPM is a full-stack observability platform with predictable pricing and self-hosted deployment.
Teams are comparing these tools as observability costs rise and architectures become more distributed. In this Datadog vs Grafana vs CubeAPM comparison, we break down how each platform differs across deployment, pricing, sampling, retention, and real-world use cases.
Datadog vs Grafana vs CubeAPM Comparison
| Feature | CubeAPM | Datadog | Grafana |
| Known for | Unified MELT, self-hosting, OTel-native, predictable cost | Large enterprise SaaS ecosystem with 900+ integrations. | Open-source dashboards; composable observability stack |
| Multi-Agent Support | Yes (OTel, New Relic, Datadog, Elastic, etc.) | Yes (Datadog Agent, OTel, third-party agents) | Yes (OTel, Prometheus exporters, Loki, Tempo) |
| MELT Support | Full MELT coverage | Full MELT coverage | Full MELT coverage via separate systems |
| Deployment | Self-hosted with vendor-managed | SaaS-only | SaaS, self-hosted, & self-managed |
| Pricing | Ingestion-based pricing of $0.15/GB | APM: $31/host/ month; Infra: $15 /host/month; Logs: $0.10/GB | OSS: Free; Cloud: $19/month; Enterprise: $25,000/yr |
| Sampling Strategy | Smart sampling – fully automated, context-aware | Head-based, tail-based, and adaptive sampling | Head & tail (OTel Collector/Tempo) |
| Data Retention | Unlimited Retention (no extra cost) | 15-30d based on plan | Free: 14d (logs/merics/ traces); pro: 30d (logs/ traces), 13m (metrics) |
| Support Channel & TAT | Slack, WhatsApp; response in minutes | Community-based; email & chat (paid); TAT: <2-48 hrs | Free: Community-based Pro: 8×5 email; Enterprise: 24×7 |
Datadog vs Grafana vs CubeAPM: Feature-by-Feature Breakdown
This section explains how Datadog, Grafana, and CubeAPM differ across core observability capabilities, focusing on what each platform is fundamentally designed to do well in real-world environments.
Known for
CubeAPM is known for delivering unified MELT observability in a self-hosted or BYOC model, with OpenTelemetry-native ingestion and predictable, ingestion-based pricing. It is designed for teams that want Datadog-level visibility without SaaS lock-in, unpredictable bills, or fragmented tooling. CubeAPM is often chosen by organizations that prioritize data residency, cost control, and faster root-cause analysis across distributed systems.
Datadog is known for its SaaS-first observability platform and broad enterprise ecosystem, offering hundreds of integrations across cloud providers, managed services, and application frameworks. Datadog excels at fast onboarding and centralized monitoring for large, cloud-native environments, especially where teams prefer a fully managed experience.
Grafana is known primarily for dashboards and visualization, acting as the front-end layer for metrics, logs, and traces collected by separate systems. Rather than providing a single opinionated APM product, Grafana enables teams to build observability by combining Prometheus, Loki, Tempo, and OpenTelemetry. This approach is popular with engineering teams that value flexibility and open-source control.
Multi-Agent Support
Multi-agent support describes how a platform ingests telemetry from different agents, SDKs, and collectors across metrics, logs, and traces.
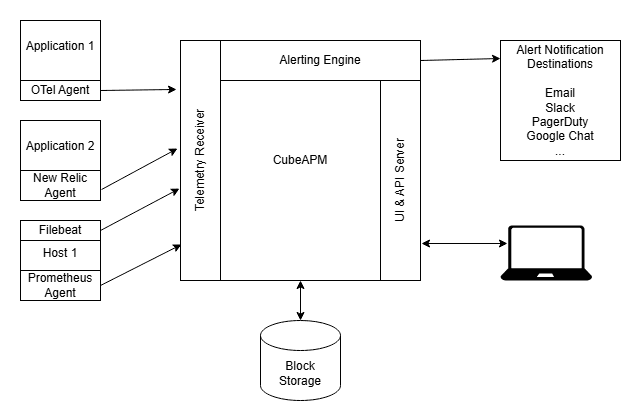
CubeAPM supports ingestion from multiple agents and formats, including OpenTelemetry, Prometheus exporters, and compatibility with Datadog- and New Relic-style agents. This allows teams to collect telemetry using standard or existing instrumentation and route it into CubeAPM without being tied to a single proprietary agent.
Datadog primarily uses the Datadog Agent to collect metrics, logs, traces, and events from hosts, containers, and cloud services. Datadog also supports OpenTelemetry ingestion and selected third-party integrations, but most platform features and workflows are designed around the Datadog Agent as the central collection mechanism.
Grafana does not rely on a single unified agent. Telemetry is typically collected using OpenTelemetry SDKs or collectors, Prometheus exporters for metrics, and log and trace agents compatible with Loki and Tempo. Grafana focuses on accepting data from these standard collectors rather than enforcing a specific agent, leaving agent selection and configuration to the user.
MELT Support (Metrics, Events, Logs, Traces)
MELT support refers to how a platform collects, stores, and correlates metrics, events, logs, and traces to provide end-to-end observability across systems.
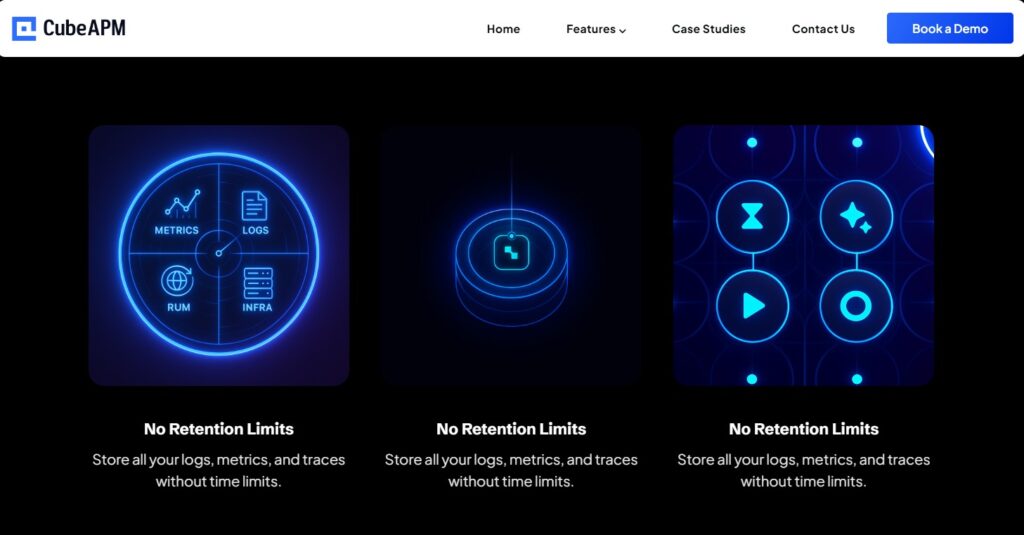
CubeAPM provides MELT support as a unified platform, where metrics, logs, traces, errors, and related events are ingested and analyzed within a single system. This design allows shared context across signals, enabling engineers to move between metrics, logs, and traces during investigation without switching tools or backends.
Datadog supports full MELT observability through its SaaS platform, covering infrastructure metrics, application metrics, logs, distributed traces, and events. Datadog’s documentation shows that these signals are available as integrated products within the platform, though they are enabled, configured, and billed as separate components depending on usage and plan. Correlation across signals is handled through Datadog’s unified UI and tagging model.
Grafana supports MELT coverage by combining multiple systems: Prometheus for metrics, Loki for logs, Tempo for traces, and OpenTelemetry for instrumentation and context propagation. Grafana itself functions as the visualization and correlation layer, while ingestion, storage, retention, and sampling are managed independently by each backend. This approach provides full MELT coverage but does not operate as a single, unified observability control plane.
Deployment Model
The deployment model determines where observability data is processed and stored, who operates the platform, and how much control teams have over infrastructure, security, and data residency.

CubeAPM supports self-hosted and BYOC (bring your own cloud) deployments, where the observability stack runs inside the customer’s infrastructure while remaining vendor-managed. This model allows organizations to keep telemetry data within their own cloud or on-prem environment while offloading platform operations, upgrades, and maintenance to CubeAPM. This approach suits teams with strict data residency, security, or compliance requirements.
Datadog is offered exclusively as a SaaS platform. All telemetry data is ingested, processed, and stored in Datadog-managed environments, with customers accessing the platform through the web interface and APIs. Datadog’s documentation emphasizes a fully managed experience, where infrastructure, scaling, and upgrades are handled by Datadog, and customers do not deploy or operate the core platform themselves.
Grafana supports multiple deployment models. Grafana can be self-managed as open-source software running on customer infrastructure, deployed as a self-hosted enterprise edition, or consumed as a fully managed SaaS through Grafana Cloud. Official Grafana documentation highlights this flexibility, allowing teams to choose between full operational control or a hosted service depending on their needs and maturity.
Pricing for Small, Mid, and Large Teams
To summarize the pricing:
*All pricing comparisons are calculated using standardized Small/Medium/Large team profiles defined in our internal benchmarking sheet, based on fixed log, metrics, trace, and retention assumptions. Actual pricing may vary by usage, region, and plan structure. Please confirm current pricing with each vendor.
| Approx. cost for teams (size) | Small (~30) | Mid-Sized (~125) | Large (~250) |
| CubeAPM | $2,080 | $7,200 | $15,200 |
| Datadog | $8,185 | $27,475 | $59,050 |
| Grafana | $2,290 | $8,625 | $17,750 |
CubeAPM Costs in Detail
CubeAPM uses a predictable ingestion-based pricing model of $0.15 per GB. There are no separate per-host or per-user charges, with retention and additional features bundled rather than metered individually. The costs for teams of different sizes*:
- Small teams (~ 30): $2,080
- Mid-sized teams (~ 125): $7,200
- Large teams (~250): $15,200
Datadog Cost in Detail
According to Datadog’s official pricing pages, Infrastructure Monitoring starts at $15 per host per month when billed annually and $18 per host per month on demand. APM starts at about $31 per host per month for tracing and profiling capabilities. Datadog’s logs pricing is $0.10 per GB ingested. Additional modules such as custom metrics, synthetics, and RUM have separate charges. The pricing for different team sizes*:
- Small teams: $8,185
- Mid-size teams: $27,475
- Large teams: $59,050
Grafana Cost in Detail
Grafana follows a tiered pricing model depending on deployment choice. Grafana OSS is free to use, with costs driven by the infrastructure and storage you manage. For Grafana Cloud, pricing includes a base platform fee (e.g., $19 per month in the Pro tier).
Usage-based charges: metrics are billed at roughly $6.50 per 1,000 active series, logs and traces are billed at about $0.50 per GB ingested, and free allotments (e.g., 10k series, 50 GB logs, and 50 GB traces per month) apply before usage charges. Enterprise plans begin with a minimum annual commitment (often $25,000/year) and offer custom pricing, advanced SLAs, and extended retention. Costs for different teams*:
- Small teams: $3,870
- Mid-size teams: $11,875
- Large teams: $26,750
Sampling Strategy
Sampling strategy determines how a platform decides which traces to keep or drop, balancing observability depth, cost, and volume control.
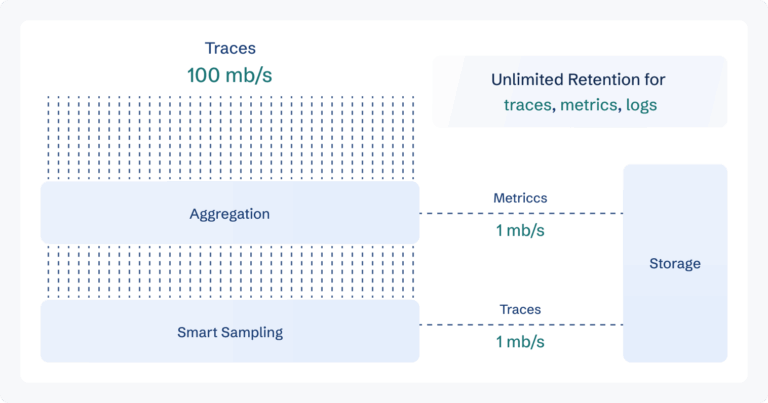
CubeAPM uses context-aware sampling that automatically prioritizes high-value traces (such as those with errors, high latency, or other diagnostic signals) while reducing overall volume. CubeAPM’s design emphasizes maintaining trace relevance with minimal manual configuration, helping teams manage telemetry costs without losing critical observability visibility.
Datadog primarily uses head-based sampling by default, where the decision to sample a trace is made at the start of the request and then applied consistently to all spans in that trace. Datadog’s ingestion controls allow configuration of sampling rates per service or resource, and OpenTelemetry-based setups can enable additional sampling processors, including probabilistic and tail-based sampling rules at the collector level via the OTel Collector. Datadog also offers adaptive sampling, which automatically adjusts sampling rates based on ingestion targets and workload patterns to help control trace volume.
Grafana does not implement sampling at the platform UI level; sampling is configured before telemetry reaches the backend using the OpenTelemetry Collector or Grafana Alloy (Grafana’s supported OTEL distribution). Official Grafana Labs documentation states that both head-based sampling (make a sampling decision early in the trace) and tail-based sampling (evaluate spans after the trace completes to sample based on latency, errors, or other criteria) can be applied at the collector layer. This flexibility is controlled through sampling processors in the pipeline rather than by Grafana itself.
Data Retention
Data retention defines how long each signal (metrics, logs, traces, events) is stored and queryable in a platform, whether limits are fixed by vendor policy or configurable by the customer.

CubeAPM offers unlimited data retention. Customers can control retention based on their deployment and storage configuration. In self-hosted or bring-your-own-cloud setups, telemetry data (metrics, logs, traces) is stored in the customer’s own infrastructure, meaning retention duration is determined by storage lifecycle policies you configure rather than fixed vendor limits.
Datadog retention policies vary by signal type and plan. According to official documentation, APM traces and indexed spans are retained by default for 15 days, with plan-based options for extending to 30 days via custom filters; error traces are also retained within similar windows. Datadog’s metric data can be retained for up to 15 months for certain metric types, and log retention depends on your indexed log retention settings tied to your plan. Retention for other signals (browser RUM, profiling, audit trails) also follows documented defaults or customer-configured policies.
Grafana handles retention differently depending on deployment choice. In Grafana Cloud, retention limits are tied to the subscription tier: the Free tier generally provides 14-day retention for metrics, logs, and traces, while Pro/On-Demand tiers extend to 30 days for logs and traces and up to 13 months for metrics. Enterprise plans can include custom retention policies based on annual commitments. In Grafana OSS or self-managed setups, retention is controlled by your own backend storage and lifecycle configurations (e.g., Prometheus retention flags, Loki/Tempo compactor policies).
Support Channel & Turnaround Time (TAT)
CubeAPM offers direct communication channels that connect users with the product team and engineers. Customers can receive assistance via Slack or WhatsApp with access to core engineers for rapid issue resolution. Reported turnaround times are typically within minutes for supported channels, reflecting a model focused on real-time engagement rather than traditional ticketing.
Datadog provides tiered support plans that vary by subscription level. Official documentation lists multiple support channels, including a support portal, email, and in-app live chat (available during specified business hours under standard plans). Response times depend on the severity of the issue and the support tier: for Standard Support, initial responses for business-critical incidents are typically within 2 hours (24×7), degraded service incidents within 12 hours, and general issues within 48 hours; Premier Support tiers aim for even faster responses (e.g., under 30 minutes for critical issues).
Grafana OSS relies on community support through public forums and documentation. Grafana Cloud Free users similarly depend on documentation and community resources, with limited ticketing for account-related issues via the Cloud Portal.
For paid plans, Grafana Cloud Pro includes 8×5 email support during business hours, while Grafana Cloud Enterprise plans provide premium support with contract-defined SLAs, including faster response times and enhanced support coverage. All support requests are handled through the Grafana Cloud Portal, and response times vary based on plan and issue severity as outlined in Grafana’s official support terms.
Which tool is best for you? Why brands choose CubeAPM
This section gives a direct answer to which observability platform fits different team needs, based on deployment model, cost control, and operational complexity.
Datadog is suitable for teams that want a fully managed SaaS observability platform with broad integrations and minimal operational overhead. Grafana suits engineering-heavy teams that prefer open-source tooling and are willing to assemble and operate separate systems for metrics, logs, and traces to gain flexibility and control.
CubeAPM is best for teams that need full-stack observability with strong cost control, OpenTelemetry-native instrumentation, and deployment flexibility without managing a complex DIY stack. Why brands choose CubeAPM:
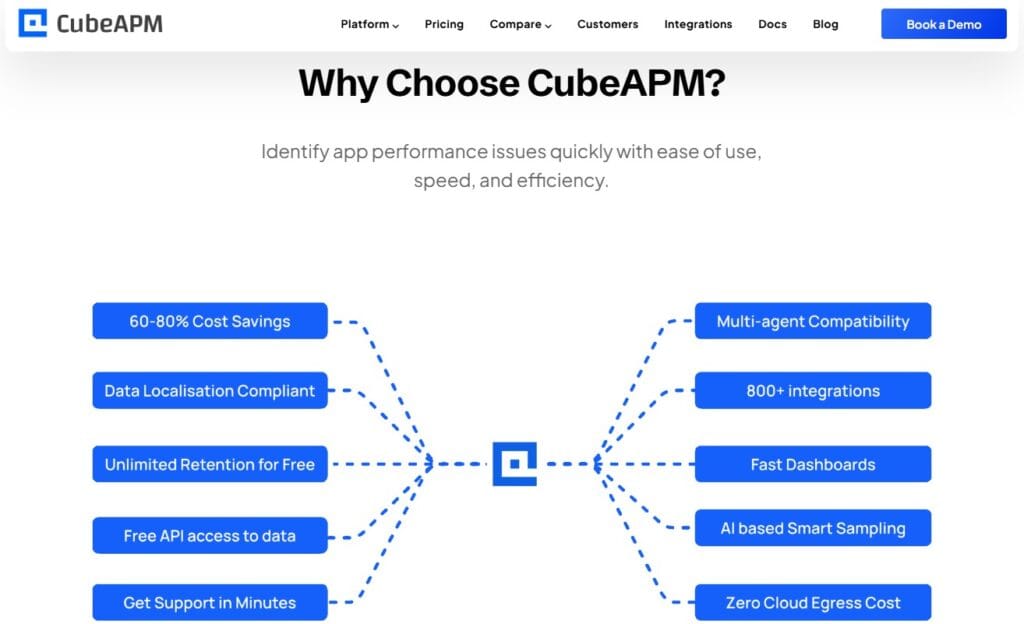
- Predictable cost model: Pricing is driven by telemetry ingestion, helping teams forecast and manage observability spend as data volumes grow.
- Unified MELT observability: Metrics, events, logs, and traces are available in one platform with shared context, reducing investigation time and improving MTTR.
- Deployment flexibility: Supports self-hosted and BYOC deployments, making it suitable for strict data residency, security, and compliance requirements.
- OpenTelemetry-native design: Built around OpenTelemetry standards, allowing teams to avoid vendor lock-in and reuse existing instrumentation across environments.
Datadog vs Grafana vs CubeAPM: Use Cases
Each observability platform serves different operational and organizational needs depending on scale, architecture, compliance requirements, and cost sensitivity.
Choose CubeAPM if:
CubeAPM fits teams that want full-stack observability with strong cost control, modern standards, and deployment flexibility, without operating a complex DIY stack.
- For startups and fast-scaling SaaS teams that need lightweight, easy-to-deploy APM without worrying about compounding per-host or per-feature costs. Based on our demo and sales data, teams often adopt CubeAPM early to avoid re-platforming later.
- For organizations looking for full-stack observability (metrics, events, logs, traces) in a single platform, enabling faster root-cause analysis and reduced mean time to resolution (MTTR).
- For teams that want to perform Java monitoring for tools built using Java.
- For teams standardizing on OpenTelemetry and wanting an OpenTelemetry-native platform that avoids vendor lock-in and supports existing instrumentation.
- For companies with strict data residency, security, or compliance requirements that need self-hosted or BYOC observability while still using a vendor-managed platform.
- For engineering and SRE teams that want predictable observability costs tied to telemetry volume, with long or unlimited retention driven by storage rather than SaaS limits, based on our research into customer deployments.
- For microservices and distributed systems where end-to-end tracing across services is critical for debugging latency, errors, and cross-service dependencies.
Choose Datadog if:
Datadog is suited for organizations that prioritize a fully managed SaaS experience and broad ecosystem coverage over cost predictability or deployment control.
- For large enterprises and cloud-first teams that want rapid onboarding, minimal operational responsibility, and deep integrations across cloud providers, managed services, and third-party tools.
- For teams that prefer an all-in-one SaaS platform where infrastructure, scaling, and upgrades are handled entirely by the vendor, based on Datadog’s documented SaaS delivery model.
- For organizations that are comfortable with usage-based pricing across hosts, logs, traces, and retention, and have budgets aligned with ongoing observability spend growth.
Choose Grafana if:
Grafana works best for teams that value flexibility and open-source control and are prepared to manage observability infrastructure themselves.
- For engineering-driven teams that want to build observability using open-source components like Prometheus, Loki, Tempo, and OpenTelemetry, based on Grafana’s official architecture.
- For organizations with strong DevOps maturity that can design, deploy, and operate separate pipelines for metrics, logs, and traces.
- For teams that prioritize custom dashboards and visualization, and are willing to trade a unified APM experience for modularity and control.
- For cost-conscious teams using Grafana OSS, where software licensing is free but infrastructure, storage, and operational overhead are managed internally.
Conclusion
In this Datadog vs Grafana vs CubeAPM comparison, we saw that Datadog delivers a powerful SaaS experience but often introduces cost unpredictability and limited deployment control as telemetry volumes grow. Grafana offers flexibility and open-source control, but requires teams to assemble and operate multiple systems to achieve full observability.
CubeAPM addresses these gaps by combining unified MELT observability, OpenTelemetry-native instrumentation, smart sampling, and flexible self-hosted or BYOC deployment. It gives teams end-to-end visibility without SaaS lock-in, fragmented tooling, or complex cost models.
If you’re looking for a modern, scalable observability platform with control, clarity, and confidence, CubeAPM is built for you. Book a demo to see it in action.
Disclaimer: The information in this article reflects the latest details available at the time of publication and may change as technologies and products evolve.
FAQs
1. Can I migrate from Datadog or Grafana to CubeAPM without re-instrumenting my applications?
Yes. CubeAPM is OpenTelemetry-native and can ingest telemetry from existing OpenTelemetry pipelines, Prometheus exporters, and Datadog-style agents. This allows teams to migrate incrementally without rewriting instrumentation or disrupting production systems.
2. Which tool works best for hybrid or multi-cloud environments?
CubeAPM and Grafana both support hybrid and multi-cloud setups. CubeAPM runs inside customer-controlled infrastructure across clouds with a unified control plane, while Grafana can span environments but requires managing multiple backends. Datadog supports multi-cloud monitoring, but telemetry is processed in a vendor-managed SaaS environment.
3. How do these tools handle data privacy and regulatory compliance?
CubeAPM is well suited for regulated environments because telemetry remains within customer-controlled infrastructure, supporting data residency and compliance needs. Grafana OSS provides similar control but requires teams to manage security and governance themselves. Datadog offers compliance certifications, but operates as a SaaS platform with data stored in vendor-managed regions.
4. Which platform is easier to operate with a small SRE or DevOps team?
CubeAPM is designed for teams that want a managed experience without operating a complex observability stack. Datadog is also operationally simple due to its SaaS model. Grafana typically requires more hands-on effort, as teams must run and maintain Prometheus, Loki, Tempo, storage, and upgrades.
5. Is CubeAPM suitable for production workloads at scale?
Yes. CubeAPM is built for production use in distributed and microservices-based systems, supporting end-to-end tracing, unified MELT observability, smart sampling, and predictable pricing, making it suitable for both fast-growing startups and high-volume enterprise environments.


