Ruby application monitoring tools are more important than ever as Ruby apps, Rails, Sinatra, Sidekiq, are increasingly distributed. Even minor performance issues in queries, background jobs, or external services can lead to massive cost and latency impacts. About 70% of app latency in these apps still comes from database operations like slow queries and N+1 issues.
So, teams choosing a Ruby application monitoring tool run into several pain points. Some include unpredictable costs as error volume, log ingestion, and tracing increase; lack of visibility into deep internals like garbage collection, method-level profiling, difficulty in tracking metrics, logs, traces, and real user monitoring; overhead concerns; and compliance or retention issues.
CubeAPM is the best Ruby application monitoring tool provider designed to address these exact gaps. It provides deep Rails and Sidekiq integration, method-level tracing, unified logs/metrics/traces, an efficient memory & GC profiler, and predictable cost models. It offers long retention, strong compliance support, alerting & dashboards tuned for heavy workload. In this article, we’ll examine the top Ruby application monitoring tools, comparing features, pricing, user reviews, and best use cases.
Top 8 Ruby Application Monitoring Tools
- CubeAPM
- New Relic
- Dynatrace
- Datadog
- AppSignal
- Sentry
- Scout APM
- Raygun
What is a Ruby Application Monitoring Tool?
A Ruby application monitoring tool is a specialized solution that tracks the health, performance, and reliability of applications built in Ruby frameworks like Rails, Sinatra, or Sidekiq. It continuously collects telemetry signals—metrics, logs, traces, and events—to help teams detect slow database queries, background job delays, API bottlenecks, or memory issues before they affect users. By correlating these signals into a single pane of glass, engineers gain full-stack visibility into how their Ruby applications behave under real workloads.
Modern businesses need greater visibility, lightning-fast load times, and flawless digital experiences. Without monitoring, problems like N+1 queries, garbage collection stalls, or external API timeouts often go unnoticed until users complain. With the rise of microservices and cloud-native architectures, Ruby apps are no longer isolated—they interact with dozens of services, databases, and containers. With Ruby application monitoring tools, these moving parts stay reliable, compliant, and cost-efficient, enabling organizations to scale with confidence.
Example: Diagnosing slow Rails requests with CubeAPM
A SaaS team using CubeAPM instruments their Rails app with the OpenTelemetry-compatible Ruby agent. When users report latency spikes, CubeAPM’s trace waterfall pinpoints the slowdown to PostgreSQL queries triggered by a background job. Metrics confirm rising DB load, while error logs show transaction timeouts. Instead of hours of guesswork, engineers immediately know the root cause to optimize queries or scale infrastructure. Smart sampling ensures detailed traces are retained during anomalies, while keeping costs predictable.
Why Teams Choose Different Ruby Application Monitoring Tools
Cost Predictability for Rails and Sidekiq
Ruby on Rails applications paired with Sidekiq background workers often generate heavy volumes of traces, logs, and errors. Each controller action, database query, and queued job can add up, leading to sudden cost spikes in usage-based tools like Datadog or New Relic. Developers on Reddit frequently mention being caught off guard by escalating bills when their Rails apps scale in traffic or job volume. For smaller Ruby teams or startups, predictable pricing is often the deciding factor that won’t punish them for growth.
OpenTelemetry-First Instrumentation for Ruby
Ruby teams are increasingly standardizing on OpenTelemetry to avoid vendor lock-in. The official OTel Ruby libraries offer auto-instrumentation for Rails, Rack, ActiveRecord, and Sidekiq, allowing developers to capture traces and metrics with minimal effort. Tools that don’t fully support OTel require duplicating instrumentation or sticking with proprietary agents, something Ruby developers are keen to avoid. As a result, many teams actively seek alternatives.
Strong Signal Correlation for Rails Bottlenecks
Performance issues in Ruby apps often boil down to N+1 queries, inefficient ActiveRecord scopes, or noisy external API calls. Teams want monitoring tools that can link a slow Rails controller trace directly to the exact SQL queries and log lines causing the slowdown. Without this correlation, debugging is guesswork. Guides on Rails performance optimization repeatedly highlight N+1 queries as one of the most common bottlenecks developers face. Choosing a tool that unifies traces, logs, and metrics is key to diagnosing these Ruby-specific pain points.
Kubernetes and Multi-Cloud Readiness for Ruby Services
Modern Ruby apps are increasingly deployed on Kubernetes, often alongside services like Redis, PostgreSQL, and external APIs. When a Sidekiq worker Pod crashes or a Rails service is throttled, developers need monitoring that not only traces the request but also maps it back to the Pod, Node, or cluster resource that failed. As teams embrace hybrid and multi-cloud strategies, Ruby monitoring tools that provide cloud-agnostic, Kubernetes-native visibility are becoming essential
Practicality and Learning Curve for Ruby-First Teams
For small Ruby teams, heavy “all-in-one” observability platforms can feel like overkill. On forums, developers often complain about steep learning curves and dashboard complexity when using enterprise-grade tools. Ruby-centric platforms like AppSignal or Scout are praised for offering ready-made Rails and Sidekiq dashboards that let developers focus on fixing performance issues rather than managing the observability tool itself (Reddit).
Deployment Flexibility and Compliance
Rails continues to dominate in regulated industries such as fintech, healthcare, and ed-tech, where compliance with HIPAA or GDPR is non-negotiable. In these environments, monitoring tools must offer long-term data retention and data residency options. Many SaaS vendors charge extra for extended retention or store data outside required jurisdictions, which is a dealbreaker.
Top 8 Ruby Application Monitoring Tools
1. CubeAPM
Overview
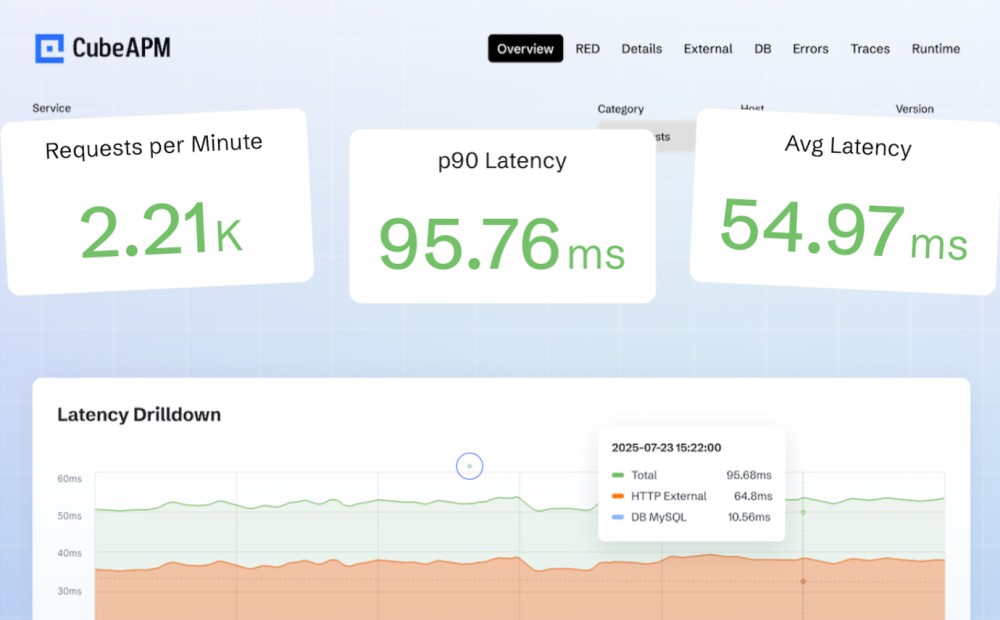
CubeAPM is known for providing end-to-end observability for Ruby applications, combining deep Rails and Sidekiq visibility with a pricing model that scales cleanly with data volume. Its market position is strong among engineering teams that prefer OpenTelemetry-first, self-hosted solutions where data residency, unlimited retention, and compliance matter. With integrations for existing agents and rapid setup, CubeAPM is positioned as the go-to choice for Ruby teams that want powerful monitoring without unpredictable costs.
Key Advantage
Seamless Ruby observability with predictable pricing, making it easier for teams to ingest, retain, and analyze data without surprise overruns.
Key Features
- Rails auto-instrumentation: Captures request, controller, and database performance data out of the box.
- Sidekiq monitoring: Tracks background job execution time, errors, and retries with full trace correlation.
- ActiveRecord insights: Surfaces N+1 queries, slow transactions, and database bottlenecks quickly.
- Trace-to-log correlation: Connects Ruby errors and exceptions directly to logs for faster debugging.
- Real User Monitoring (RUM): Measures frontend load times and user interactions tied back to Rails endpoints.
Pros
- Keeps data within your own infrastructure for compliance and cost control
- OpenTelemetry-first design that plugs into existing Ruby instrumentation
- Unlimited data retention without tiered pricing penalties
- Direct engineer support via Slack and WhatsApp with rapid response times
Cons
- Less suited for teams that require fully SaaS, off-prem monitoring options
- Focused on observability, does not extend into broader cloud security features
CubeAPM Pricing at Scale
CubeAPM uses a transparent pricing model of $0.15 per GB ingested. For a mid-sized business generating 45 TB (~45,000 GB) of data per month, the monthly cost would be ~$7,200/month.
Tech Fit
Best for Ruby on Rails and Sidekiq applications running on Kubernetes, hybrid, or on-prem environments. Strong fit for teams using PostgreSQL/Redis backends and organizations that value OpenTelemetry compatibility and compliance-ready deployments.
2. New Relic
Overview
New Relic is a long-standing choice for Ruby application monitoring, known for a mature Ruby agent that auto-instruments Rails, Sinatra, Rack middleware, ActiveRecord, and common background job frameworks. Its market presence comes from pairing deep Ruby visibility (transactions, errors, traces, runtime metrics) with a larger observability suite—logs, browser monitoring, service maps, and analytics—so Rails teams can move from a slow endpoint to the exact SQL call, job, or front-end event in one workflow.
Key Advantage
A proven Ruby agent with broad ecosystem tie-ins—APM, logs, browser, and analytics—so Rails teams can correlate code-level issues with infrastructure and user experience signals.
Key Features
- Rails/Rack auto-instrumentation: Traces controllers, middleware, DB calls, external HTTP, and templates for quick bottleneck isolation.
- Background jobs (Sidekiq/Resque/delayed_job): Measures job throughput, concurrency, errors, and resource usage with transaction visibility.
- Ruby runtime & GC metrics: Tracks heap, GC cycles, threads, and custom attributes to explain latency or memory pressure.
- Browser monitoring via Ruby agent: Injects JS automatically to link real user performance back to Rails transactions.
- Rails 7 guidance & agent updates: Official how-to and frequent agent releases keep Ruby support current, including newer Ruby versions.
Pros
- Mature Ruby agent with clear docs and examples
- Strong correlation across APM, logs, browser, and service maps
- Background job visibility for Sidekiq/Resque with actionable metrics
- Frequent Ruby agent updates and broad framework support
Cons
- Usage-based data pricing plus user seats can add up at high ingest volumes
- SaaS-only; no self-hosting
New Relic Pricing at Scale
New Relic’s billing is based on data ingested, user licenses, and optional add-ons. The free tier offers 100 GB of ingest per month, then it costs $0.40 per GB after that. For a business ingesting 45 TB of logs per month, the cost would come around $25,990/month.
Tech Fit
Best for Ruby on Rails and Sinatra teams that want a well-documented, battle-tested agent and benefit from a connected toolkit—browser monitoring, logs, analytics, and service maps—especially in multi-service Rails environments or when linking front-end UX to back-end Ruby performance is a priority.
3. Dynatrace
Overview
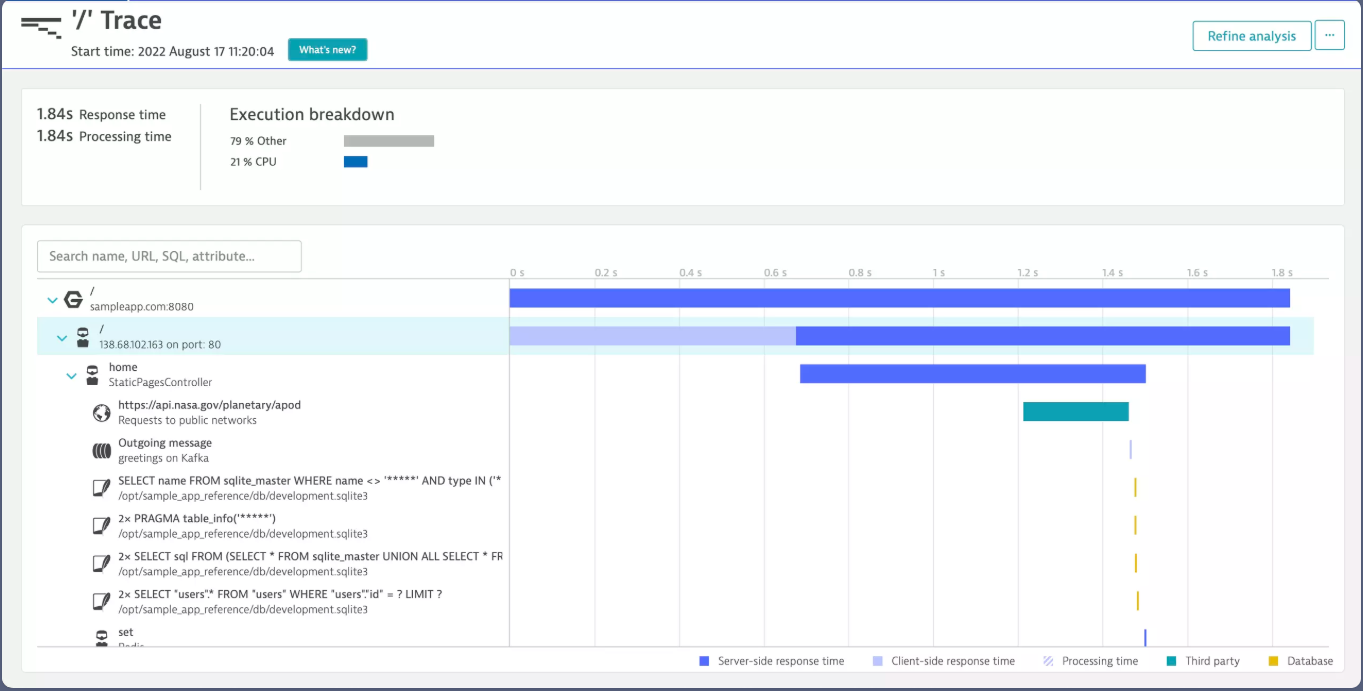
Dynatrace brings an enterprise-first approach to observability, offering Ruby support through OpenTelemetry ingestion rather than a native agent. Ruby applications built on Rails, Sinatra, or Sidekiq can be instrumented with the OTel Ruby SDK, sending traces and metrics directly into Dynatrace where they’re enriched with service topology, AI-driven analysis, and full-stack context. Its position in the market is strong among large organizations that need to monitor complex, multi-cloud Ruby deployments with automated correlation across infrastructure and applications.
Key Advantage
AI-driven causal analysis that ties Ruby traces into Smartscape topology, automatically detecting and surfacing root causes across distributed services and infrastructure.
Key Features
- OpenTelemetry Ruby support: Ingests OTLP traces from Rails, Sinatra, and Sidekiq applications.
- Context propagation: Ensures trace continuity across Ruby services and downstream dependencies.
- Service flow visualization: Maps Ruby service interactions and highlights latency hotspots.
- Kubernetes and infra correlation: Aligns Ruby spans with pod, node, and host health when OneAgent is enabled.
- Real user impact linkage: Connects browser sessions back to Ruby endpoints for full journey monitoring.
Pros
- OpenTelemetry-first approach keeps instrumentation portable
- Davis AI and Smartscape provide automated root-cause analysis
- Strong Kubernetes and multi-cloud support
- Unified data lake for querying traces, logs, and metrics together
Cons
- Pricing spans ingestion, retention, and optional modules, which can be complex
- Learning curve is steep
Dynatrace Pricing at Scale (Ruby APM)
- Full stack: $0.01/8 GiB hour/month or $58/month/8GiB host
- Log Ingest & process: $0.20 per GiB
For a similar 45 TB (~45,000 GB/month) volume, the cost would be $21,850/month.
Tech Fit
Ideal for Ruby on Rails and Sidekiq teams running in Kubernetes or multi-cloud environments that need OTel-based instrumentation integrated with enterprise-grade AI analysis, Smartscape topology mapping, and optional full-stack monitoring.
4. Datadog
Overview
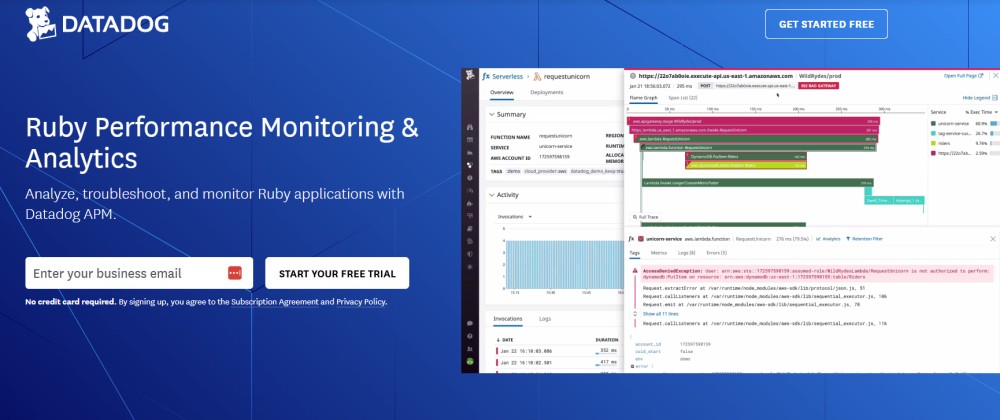
Datadog is widely adopted for Ruby application monitoring, pairing mature APM for Rails, Sinatra, and Sidekiq with a broad ecosystem that includes service maps, anomaly detection, continuous profiling, logs, and RUM. Ruby teams value its auto-instrumentation and TraceID log correlation, which makes it possible to move seamlessly from a slow controller span to the exact SQL query or background job log line. Its market position is strong among organizations that need deep Ruby visibility as part of a larger, multi-service monitoring strategy.
Key Advantage
Ecosystem-wide correlation for Ruby—traces, logs, profiler, RUM, and service maps all tied together to accelerate root-cause analysis in Rails applications.
Key Features
- Rails/Sinatra auto-instrumentation: Out-of-the-box tracing for controllers, middleware, database calls, and external HTTP requests.
- TraceID log correlation: Link a slow or errored Ruby span directly to relevant log lines for faster debugging.
- Ruby Continuous Profiler: Profile Ruby code in production to identify hot methods and memory hotspots.
- Service Map & App Analytics: Visualize Ruby service dependencies and slice trace data at high cardinality.
- Ruby runtime & GC metrics: Track heap usage, garbage collection cycles, and thread activity in production.
Pros
- Strong Ruby integrations with broad feature depth across APM, logs, RUM, and profiling
- Excellent cross-signal correlation and real-time service mapping for complex Rails systems
- Large integration library supports polyglot stacks and multi-cloud deployments
- Extensive documentation and resources for Ruby developers
Cons
- Pricing can become complex at scale due to host fees plus ingested and indexed span charges
- No self-hosting; only SaaS-based deployment
Datadog Pricing at Scale (Ruby APM)
Datadog charges differently for different capabilities. APM starts at $31/month; infra starts at $15/month; logs start at $0.10/GB, and so on.
For a mid-sized business ingesting around 45 TB (~45,000 GB) of data per month, the cost would come around $27,475/month.
Tech Fit
Well-suited for Ruby on Rails and Sidekiq teams running complex services in Kubernetes or multi-cloud environments. Works best for organizations that benefit from Datadog’s large ecosystem and advanced correlation features across APM, logs, and RUM.
5. AppSignal
Overview
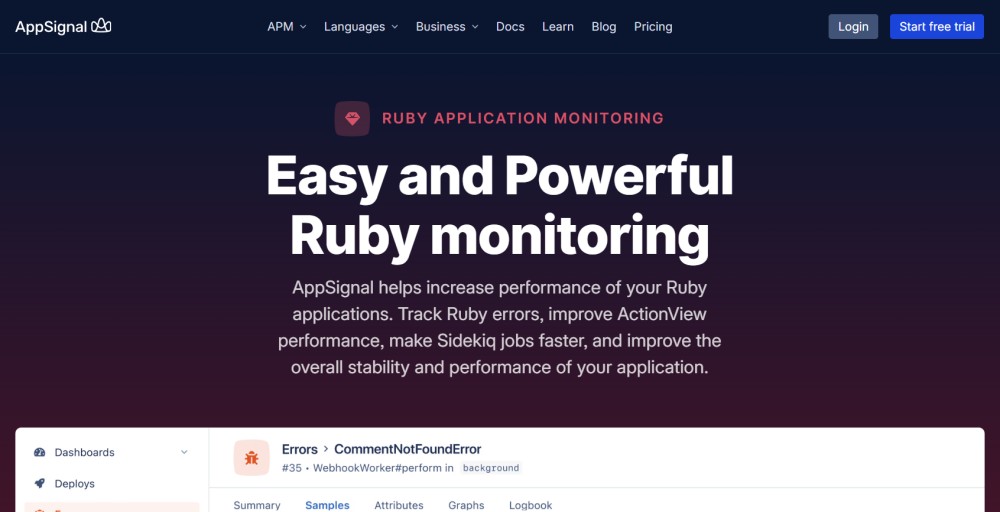
AppSignal is a Ruby-first APM that many Rails and Sidekiq teams adopt for its opinionated, developer-friendly experience: out-of-the-box visibility into controllers, ActiveRecord, background jobs, and alerts, plus “time detective” timelines and automated dashboards. It’s positioned as a focused alternative to heavyweight suites—strong Ruby coverage, simple setup, and predictable request-based pricing.
Key Advantage
Rails and Sidekiq depth with low-friction setup—teams get meaningful traces, slow-query insights, and job visibility in minutes.
Key Features
- Rails auto-instrumentation: Captures controllers, views, DB calls, and external HTTP for fast endpoint triage.
- Sidekiq & background jobs: Measures runtime, retries, and errors across Sidekiq/Resque/Delayed Job/Que with dashboards.
- ActiveRecord insights: Surfaces N+1 queries and slow SQL with links to offending code paths.
- Custom & method instrumentation: Add spans via helpers or ActiveSupport::Notifications to trace app-specific code.
- Logs & uptime (add-ons): Centralize Rails logs and ping uptime; optional long-term log storage and status pages.
Pros
- Ruby-centric UX that feels native to Rails and Sidekiq
- Clear timelines and automated dashboards reduce setup toil
- Request-based pricing with unlimited users and projects
- Solid docs, active Ruby blog, and straightforward custom instrumentation
Cons
- SaaS-only deployment; not ideal if you require self-hosting or strict on-prem data control
- Narrower integration ecosystem than large suites
AppSignal Pricing at Scale
AppSignal charges based on requests (web requests + background jobs), with all features included. Plans start at $19/month for up to 250K requests and scale up linearly. For example, a team processing around 10 million requests per month would pay a few hundred dollars, while high-volume teams with 100M+ requests typically fall near the $1,000/month range depending on the tier. There are no added charges for hosts, metrics, or users, making costs predictable as Ruby apps grow.
Tech Fit
Best for Ruby on Rails APIs and monoliths with Sidekiq/ActiveJob, Postgres/Redis stacks, and teams that value a Ruby-centric APM with fast setup and clear guidance over a sprawling, multi-product suite.
6. Sentry
Overview
Sentry is best known for error monitoring, but its Ruby SDK also provides performance tracing for Rails, Sinatra, and Sidekiq—letting teams follow a slow request from controller to SQL to external calls, then tie that trace back to the exact error. The platform layers logs, profiling, and release health on top of issues and traces, with plan tiers that include base quotas and pay-as-you-go or reserved “event” budgets for scale.
Key Advantage
Best-in-class error tracking woven directly into Ruby performance traces, so developers move from exception → transaction → culprit query or API call in a single workflow.
Key Features
- Rails auto-instrumentation: Captures transactions/spans for controllers, DB queries, views, and HTTP calls with minimal setup.
- Sidekiq & background jobs: Monitors job runtime, retries, and failures with tracing across services.
- Sampling controls: Use traces_sample_rate and traces_sampler to balance detail vs. cost for Ruby transactions.
- Trace ↔ issue linking: Jump from a slow Ruby span to the exact error and related context to accelerate fixes.
- Release health: Connect deploys to performance/error regressions to catch Ruby issues early.
Pros
- Developer-centric workflow that unifies errors, traces, logs, and profiling
- Quick setup for Rails and Sidekiq with good docs and examples
- Flexible quotas with reserved volume or pay-as-you-go and spike protection
- Strong integrations for source control and alerting
Cons
- Can be costly for smaller teams
- Error reporting delays can happen
Sentry Pricing at Scale (Ruby APM)
Sentry: Free up to 5K events/month; Teams: from $26/month; Business: usage-based, with tiers for performance monitoring and session replay, starting from $80/month. For mid-sized teams ingesting 45 TB of data, the cost could be $12,100/month.
Tech Fit
A great fit for Rails/Sidekiq teams that prioritize developer speed and issue resolution—especially when error tracking is the center of gravity, but you still want Ruby performance traces, sampling controls, and release health without per-host billing.
7. Scout APM
Overview
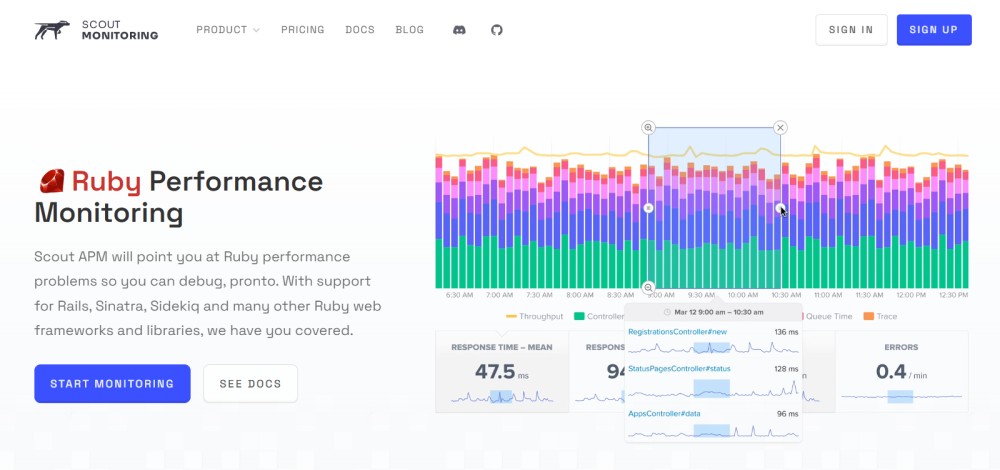
Scout APM is a developer-friendly, Ruby-focused APM known for pinpointing Rails and Sidekiq bottlenecks like N+1 queries, slow ActiveRecord scopes, and memory bloat with minimal overhead. Its market position is strong among small to mid-sized Ruby teams that want clear, code-level insights and simple, request-based pricing instead of complex GB/host meters.
Key Advantage
Method-level visibility for Ruby that quickly surfaces hot spots (queries, allocations, slow endpoints) without heavy configuration.
Key Features
- Rails/Rack auto-instrumentation: Captures controllers, views, middleware, SQL, and external HTTP to triage slow endpoints fast.
- N+1 and slow query detection: Flags inefficient ActiveRecord patterns and surfaces problematic SQL with backtraces.
- Memory bloat & object allocations: Highlights memory growth and noisy allocators to resolve leaks and GC churn.
- Background jobs (Sidekiq/Resque/Delayed Job/Que): Tracks runtimes, retries, and errors with trace context across workers.
- Request queueing & throughput: Measures time spent waiting before Rails, revealing capacity issues under load.
Pros
- Ruby-centric UX with quick setup and low overhead
- Clear code-level traces and backtraces that speed up debugging
- Simple request-based pricing with unlimited users and apps
- Helpful docs and open-source Ruby agent for transparency
Cons
- SaaS delivery only; not ideal if you require self-hosting or strict on-prem controls
- Documentation and pricing need improvements
Scout APM Pricing at Scale
Scout APM charges by transactions (web requests + background jobs), with all features included and unlimited users/apps. Plans include Free (100K transactions/month), Startup ($19 for 500K), Small ($39 for 1M), Medium ($99 for 3M), and Large ($249 for 8M). Above 8M transactions/month, teams move into Enterprise with custom pricing.
For example, a Ruby team processing around 10M transactions/month would exceed the Large plan and typically pay in the $300–$400/month range depending on negotiated terms. Optional add-ons include Logs ($40/month for 30 GB, then $0.50/GB) and Error Monitoring ($19/month for 50K errors, then $0.39 per 1,000 errors).
Tech Fit
A strong fit for Rails and Sidekiq apps on Postgres/Redis (including Heroku deployments) where developers want fast, code-first diagnostics and predictable request-based pricing, and don’t need a heavyweight, multi-product observability suite.
8. Raygun
Overview
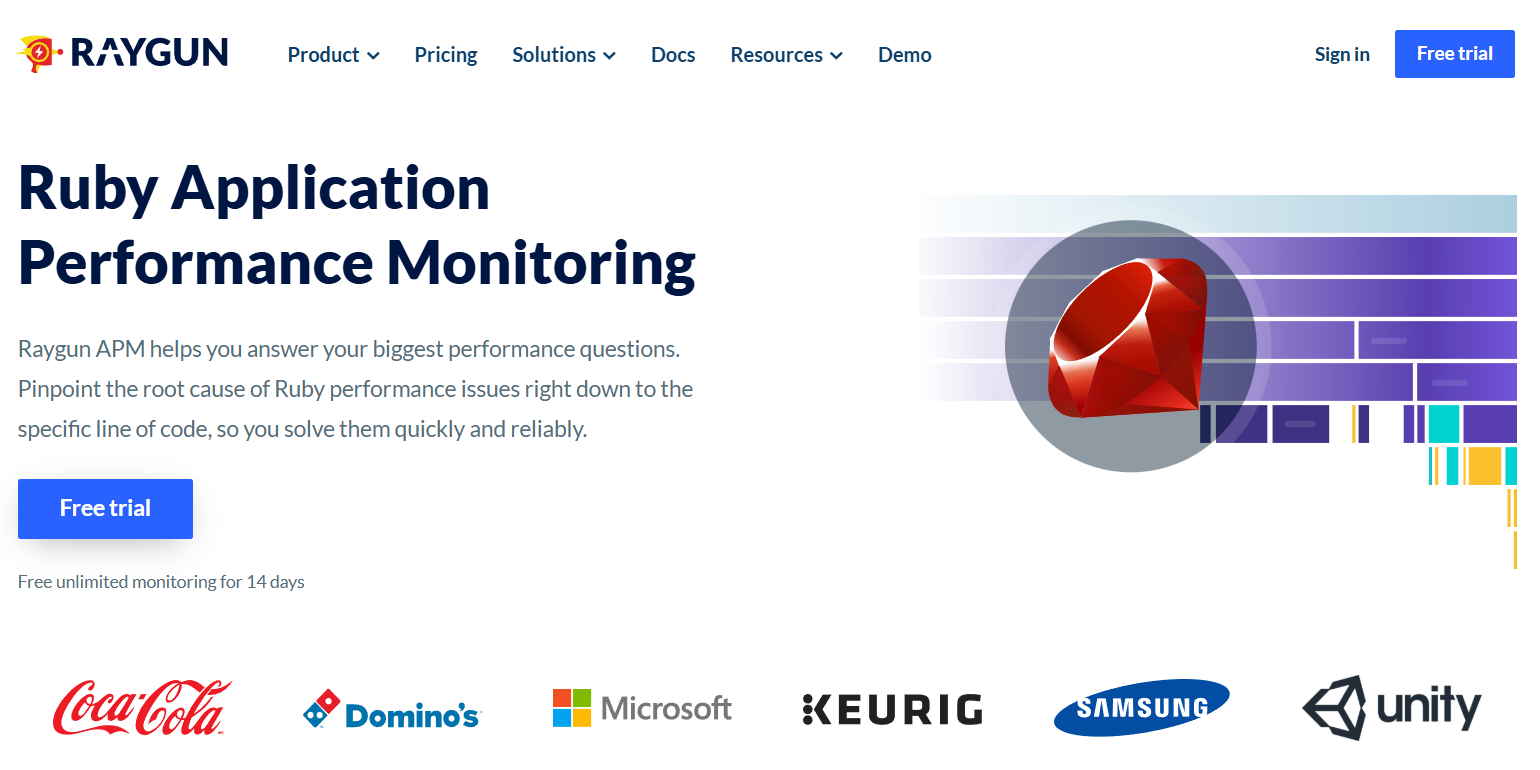
Raygun is known for developer-centric Ruby APM with flame charts, trace timelines, and code-level context pulled straight from your repo—so Rails and Sinatra teams can jump from a slow endpoint to the exact method, SQL, or external call in a click. In the market, it’s a good fit for engineering orgs that want lightweight Ruby performance monitoring paired with Raygun’s Crash Reporting and Real User Monitoring modules for a fuller picture.
Key Advantage
Trace-level clarity with flame charts and native source linking that shortens the path from “this Rails action is slow” to “this line of code is the culprit.”
Key Features
- Rails & Rack instrumentation: Use the raygun-apm-rails gem to capture controllers, views, middleware, SQL, and external HTTP as rich traces.
- Sidekiq tracing: Optional Sidekiq gem adds background job spans so you can follow work off the web thread.
- Flame charts & timelines: Visualize where time is spent in each Ruby request, from method calls to DB and HTTP.
- Source code integration: Pulls code snippets from GitHub/Bitbucket/Azure Repos into the trace for faster fixes.
- Filtering & sampling: Inbound filters and sampling controls help cut noise and keep spend aligned to signal.
Pros
- Clear, code-first UX that feels natural for Rails and Sidekiq
- Strong trace visuals (flame charts) and native code linking improve time-to-diagnosis
- Plays nicely with Raygun Crash Reporting and RUM for end-to-end visibility
- Usage capping and reserved events help teams control budgets at scale
Cons
- Usage-based, per-trace pricing can be costly for smaller teams
- SaaS delivery only; no self-hosted option
Raygun Pricing at Scale
Raygun APM is priced by traces (events). Each plan includes a base allocation of reserved traces, and any usage above that is billed on-demand at $0.002 per trace. Teams can purchase additional reserved events at discounted rates to control costs.
For example, if a Ruby app generates 10M traces/month and the plan includes 1M reserved traces, the remaining 9M traces would cost around $18,000/month at on-demand rates. With reserved event packages or enterprise terms, this cost can be significantly reduced.
Tech Fit
A solid choice for Ruby on Rails/Sinatra APIs and Sidekiq workers where teams want fast, visual diagnosis, source-linked traces, and simple add-ons (errors/RUM). Best when you’re comfortable managing sampling and reserved events to keep per-trace costs predictable.
How to Choose the Right Ruby Application Monitoring Tool
Prioritize database-first diagnostics for Rails
Most Rails bottlenecks start with the database. A good Ruby APM should highlight ActiveRecord inefficiencies—N+1 queries, missing indexes, and slow scopes—and map every controller action to its SQL. Tools that surface slow queries with backtraces and support EXPLAIN ANALYZE help teams resolve performance issues faster and validate fixes.
Correlate traces, logs, and metrics to pinpoint DB pain
It’s not enough to know a request was slow—you need to know why. Look for tools that link Ruby spans directly with logs and database metrics (connection usage, cache hit ratio, query latency). This correlation closes the loop between code, SQL, and infrastructure, making it easier to isolate root causes.
Ensure Sidekiq-aware visibility
Many Ruby teams use background processing with Sidekiq or similar job frameworks. Monitoring should extend beyond web requests to capture job runtimes, retries, and queue latency per queue. Without this, bottlenecks just move from controllers to workers, leaving database pressure unchecked.
Standardize on OpenTelemetry for Ruby
Vendor lock-in is a recurring worry in developer forums. Choosing a Ruby APM that supports OpenTelemetry lets you auto-instrument Rails, Sidekiq, and ActiveRecord while keeping your data portable. You can also add custom spans for unique code paths (like serializers or reporting jobs), future-proofing your instrumentation.
Make infra context actionable for database issues
For teams running Rails in Kubernetes or multi-cloud, traces should map to pods, nodes, and services so you can see if a Postgres or Redis slowdown is actually infra-related (e.g., CPU throttling, noisy neighbors, or exhausted DB connections). While not every Ruby app is containerized, those operating at scale benefit from this correlation.
Control observability costs with sampling and quotas
Ruby applications generate high telemetry volume from requests, jobs, and logs. Without controls, bills can spike during traffic surges or incidents. Select a tool that lets you sample traces intelligently, cap ingestion, and balance data retention—keeping insights without runaway costs.
Validate Postgres insights inside the workflow
The best APMs don’t just say “the DB is slow.” They help developers act by surfacing slow queries, showing missing eager loads, and integrating with Postgres diagnostics (like rails-pg-extras). This makes it easier to fix query patterns, reduce seq scans, and validate changes with benchmarks.
Align Sidekiq concurrency with DB connection pools
A common Rails/Sidekiq gotcha is raising concurrency without increasing the Postgres pool size, leading to timeouts. Choose monitoring that shows job throughput alongside pool usage and flags when workers are starved. This alignment is critical for scaling background workloads reliably.
Conclusion
Choosing the right Ruby application monitoring tool is often challenging for teams. Developers face issues like hidden N+1 queries, database pool timeouts, Sidekiq latency, and unpredictable pricing models that spike as applications scale. These pain points slow down incident response and inflate costs when teams can least afford it.
CubeAPM solves these challenges by offering an OpenTelemetry-native platform built with Ruby teams in mind. It provides deep visibility into Rails, Sidekiq, and ActiveRecord, with smart sampling, cost-efficient $0.15/GB pricing, and the flexibility to run self-hosted or in the cloud—without surprise overages.
Schedule a free demo with CubeAPM.
Disclaimer: The information in this article reflects the latest details available at the time of publication and may change as technologies and products evolve.
FAQs
1. What’s the difference between Ruby application monitoring and infrastructure monitoring?
Ruby application monitoring focuses on code-level performance, such as controller response times, SQL queries, and background job runtimes. Infrastructure monitoring, on the other hand, tracks host, container, or cloud resource health. Many teams combine both for a full picture, and tools like CubeAPM unify these layers in one platform.
2. Can Ruby monitoring tools help with compliance requirements?
Yes. Monitoring tools can support compliance by offering data retention controls, audit trails, and deployment flexibility. For example, CubeAPM allows self-hosting, enabling organizations to meet stricter regulatory requirements while still gaining observability into their Ruby workloads.
3. How do Ruby APMs handle high-traffic spikes without losing visibility?
Most tools use sampling and quotas to manage data volume during spikes. The key is finding a balance between detail and cost. CubeAPM uses Smart Sampling to capture critical traces and errors without overspending, ensuring teams don’t lose visibility when it matters most.
4. Do Ruby monitoring tools integrate with modern DevOps workflows?
Yes. Leading tools integrate with CI/CD pipelines, GitHub, Slack, and issue trackers. This means alerts from a slow Ruby endpoint can automatically trigger tickets or deploy checks, keeping monitoring aligned with DevOps practices.
5. Are open-source Ruby monitoring tools viable for production use?
They can be, but many open-source libraries provide only basic metrics or tracing. For production-grade reliability and enterprise support, teams often pair them with full-featured APM platforms that ensure scalability, security, and support.


