Incident management has become mission-critical for modern businesses. When systems crash or services slow down, the ripple effects can mean lost revenue, unhappy customers, and sleepless nights for engineers.
Incident management tools help you detect problems quickly, coordinate response, and minimize downtime. But choosing the right solution is tricky. Teams often face confusion around pricing, integrations, and scalability. Research shows that only 55% of organizations maintain a fully documented incident response plan, leaving businesses exposed during critical outages.
This is where CubeAPM stands out as the best incident management tool provider. With AI-driven triage, smart alerting, flexible on-call workflows, and 800+ integrations, CubeAPM equips teams to resolve incidents faster and prevent repeat issues.
In this article, we’ll dive into the top incident management tools, exploring their features, pricing, and best use cases to help you make the right choice.
Top 8 Incident Management Tools
- CubeAPM
- Datadog
- New Relic
- Dynatrace
- PagerDuty
- Atlassian Opsgenie (via Jira Service Management)
- Splunk On-Call (VictorOps)
- incident.io
What Is an Incident Management Tool?
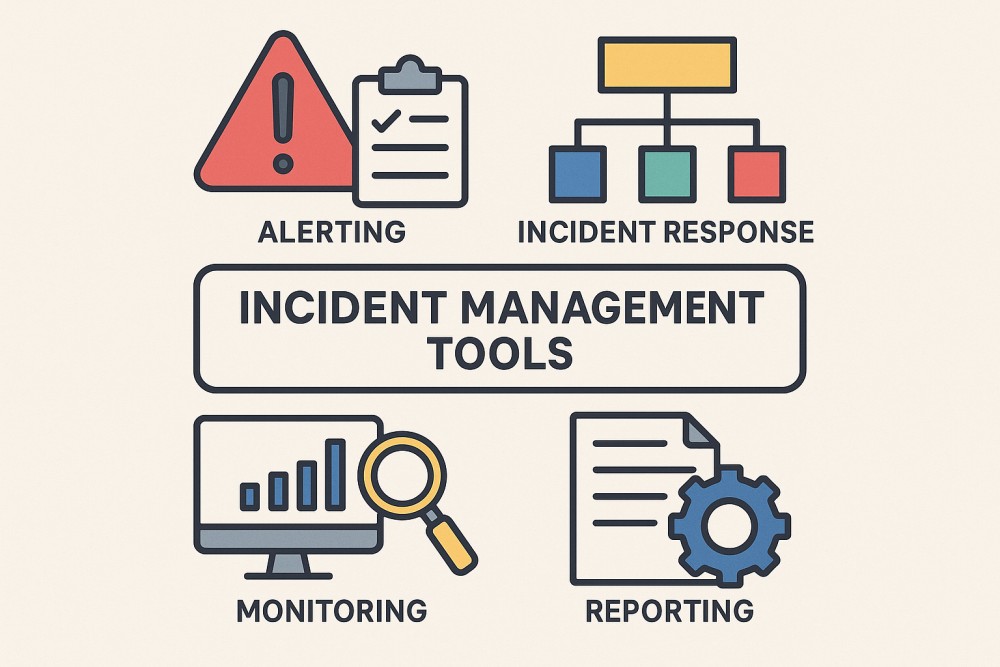
An incident management tool is software that helps organizations detect, respond to, and resolve unplanned disruptions like application crashes, infrastructure failures, or service outages. It centralizes monitoring signals, automates escalation workflows, and equips teams with the right context so they can act quickly and minimize downtime.
For modern businesses, these tools are critical. Customers today expect always-on services, and even a few minutes of downtime can mean lost revenue, churn, and reputational damage. With digital ecosystems spanning cloud, Kubernetes, APIs, and microservices, manual processes simply can’t keep pace. Incident management platforms ensure that teams stay ahead of problems, reduce mean time to resolution (MTTR), and protect both customer trust and business continuity.
Incident Management Use Case: Flagging Latency with CubeAPM
Imagine a SaaS company experiencing sudden API slowdowns during peak traffic. With CubeAPM, the platform immediately flags latency issues through Smart Sampling, retaining only the most valuable traces tied to errors or performance degradation. At the same time, real-time alerts trigger on-call workflows and notify engineers directly on Slack or WhatsApp, backed by logs, metrics, and distributed trace context. Instead of just knowing something is broken, the team instantly sees why, helping them resolve the issue before it impacts thousands of end-users.
Why Teams Choose Different Incident Management Tools
No two organizations handle incidents in exactly the same way. Some operate lean SaaS teams with simple alerting needs, while others run global, multi-cloud infrastructures where milliseconds of downtime cost millions. Because of these differences, teams often evaluate incident management tools based on very specific challenges.
The need for predictable costs
Pricing is often the first pain point. Many popular platforms use layered models—charging separately for hosts, custom metrics, log volumes, or retention. In dynamic environments like Kubernetes, where workloads scale up and down constantly, this can trigger surprise bills that are hard to justify. Teams now favor tools with transparent, volume-based pricing or flat-rate models that allow them to budget incident response without financial guesswork. Predictability isn’t just about cost savings—it’s about avoiding the stress of explaining sudden spikes to finance teams.
Correlation across signals to speed up triage
During an outage, every minute matters. Engineers don’t want to waste time flipping between dashboards; they need strong correlation across metrics, traces, logs, and user experience data. A good tool links an alert directly to the relevant trace, highlights error logs from the same timeframe, and shows how the issue affected end users. This level of cross-signal visibility cuts down mean time to resolution (MTTR) by helping teams move from “what happened” to “why it happened” in seconds.
Handling Kubernetes and multi-cloud environments
Modern incidents rarely stay confined to a single server. They span ephemeral pods, containerized services, and distributed cloud regions. Traditional host-based tools struggle with the high cardinality and short-lived workloads common in Kubernetes. Multi-cloud adoption adds another layer of complexity, with teams needing consistent visibility across AWS, Azure, and GCP. Organizations therefore seek incident management solutions that are cloud-native at their core, with auto-discovery for pods, services, and clusters, plus the ability to adapt pricing models to bursty traffic patterns.
Reducing alert fatigue and improving on-call life
On-call engineers are often buried under a flood of alerts, many of which are false positives or duplicates. This “alert fatigue” not only slows down response times but also increases the risk of missing a critical issue. Modern incident management platforms tackle this by offering event deduplication, noise suppression, and intelligent grouping of related incidents. By reducing unnecessary pings, tools keep on-call shifts manageable and ensure engineers can focus their attention where it matters most.
Using automation to save critical minutes
The first few minutes of an incident often set the tone for the entire response. Platforms that offer automation and AI-assisted triage help responders by enriching alerts with context, suggesting likely root causes, or automatically routing tickets to the right teams. Some even integrate with runbooks, allowing predefined actions—like restarting a service or scaling resources—to be triggered automatically. This combination of automation and human oversight shortens MTTR and reduces cognitive load during high-pressure incidents.
Meeting compliance and data residency requirements
For businesses in finance, healthcare, or government, where regulations like HIPAA, GDPR, or India’s data localization laws apply, data residency is non-negotiable. Storing sensitive incident data in overseas servers can be a compliance risk. That’s why teams often reject cloud-only solutions and choose tools that support self-hosting, private cloud deployment, or hybrid models. This flexibility ensures they meet compliance requirements while still benefiting from advanced incident management capabilities.
Seamless integration with everyday workflows
An incident rarely happens in isolation—it usually triggers a flurry of Slack messages, Jira tickets, and CI/CD rollbacks. If an incident management tool doesn’t fit naturally into these workflows, it slows teams down. Engineers now expect native integrations with chat platforms, ticketing systems, and CI/CD pipelines, plus the ability to automate status updates and escalation policies. The smoother the integration, the faster teams can move from alert to action.
Turning incidents into learning opportunities
Resolving an incident is only half the battle; the real value comes from learning why it happened and preventing it from recurring. High-performing teams look for platforms that make post-incident reviews easy, capturing timelines, decisions, and key evidence. Tools that generate structured retrospectives or link directly to runbooks ensure insights don’t get lost in the chaos. This focus on continuous improvement helps teams not just put out fires, but also build long-term resilience.
Top 8 Incident Management Tools
1. CubeAPM
Overview
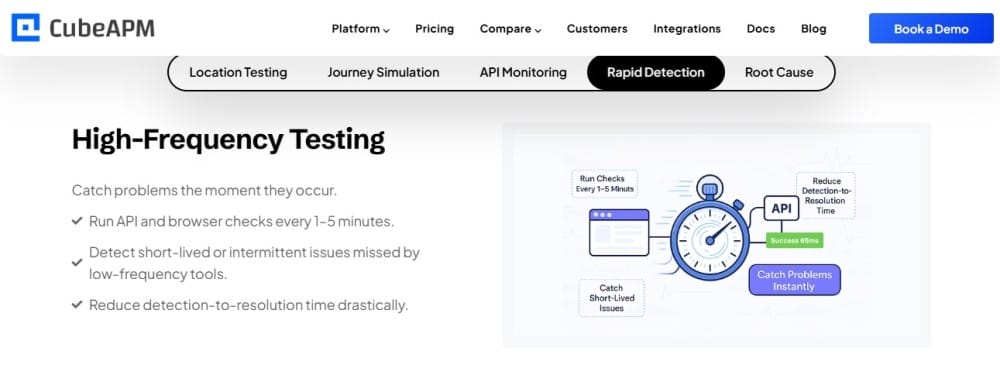
CubeAPM is known for being an OpenTelemetry-native, full-stack observability platform purpose-built to streamline incident management. Positioned as a modern alternative to legacy APMs, it unifies logs, metrics, traces, RUM, synthetics, and error tracking into one flow. Its standout Smart Sampling engine filters out noise while retaining high-value traces, helping teams cut costs without losing context. With deployment flexibility across SaaS, hybrid, and on-prem, CubeAPM offers the predictability and control that growing businesses need.
Key Advantage
Context-aware Smart Sampling with cross-signal correlation—alerts automatically link to relevant traces, logs, infrastructure, and user impact, giving teams faster triage without alert fatigue.
Key Features
- Error tracking: Automatically groups and prioritizes recurring issues, helping teams resolve incidents faster.
- Smart Sampling: Captures high-value traces tied to errors or latency while filtering noise to control cost.
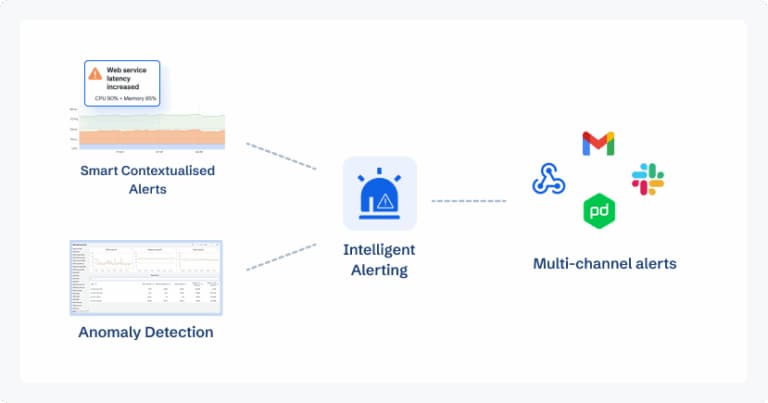
- Real-time alerting & correlation: Connect alerts to traces, logs, infrastructure, and user sessions for quick root-cause analysis.
- Synthetic monitoring & RUM: Simulates user journeys and tracks real user experience to gauge incident impact.
- OpenTelemetry-first with 800+ integrations: Ensures seamless adoption across cloud, DevOps, and enterprise workflows.
Pros
- Strong correlation across MELT signals for faster incident resolution
- Smart Sampling reduces noise while preserving critical incident data
- Flexible deployment: SaaS, hybrid, or on-prem for compliance and data residency
- Direct Slack/WhatsApp access to core engineers for rapid support
- 800+ integrations covering cloud, DevOps, and enterprise ecosystems
Cons
- Less suited for teams seeking exclusively cloud-only, off-prem solutions
- Focused on observability and incident management, not broader cloud security management
CubeAPM Pricing at Scale
CubeAPM uses a transparent pricing model of $0.15 per GB ingested. For a mid-sized business generating 45 TB (~45,000 GB) of data per month, the monthly cost would be ~$7,200/month.
*All pricing comparisons are calculated using standardized Small/Medium/Large team profiles defined in our internal benchmarking sheet, based on fixed log, metrics, trace, and retention assumptions. Actual pricing may vary by usage, region, and plan structure. Please confirm current pricing with each vendor.
Tech Fit
Best suited for cloud-native and multi-cloud environments, CubeAPM integrates smoothly with Kubernetes, serverless, and enterprise workloads. It supports major languages and frameworks (Java, Node.js, Python, Go, .NET) via OpenTelemetry SDKs, and offers out-of-the-box compatibility with Prometheus exporters and legacy Datadog/New Relic agents. Its hybrid and self-hosted options make it especially strong for industries like finance and healthcare, where compliance and data residency are critical.
2. Datadog
Overview
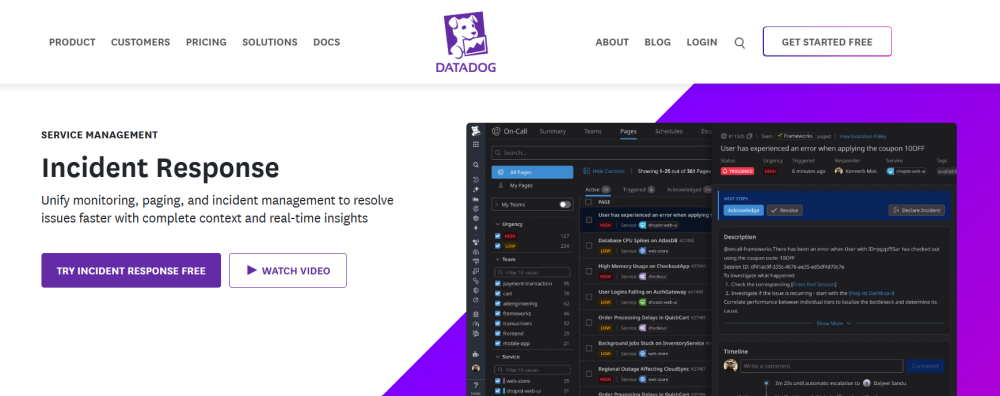
Datadog is widely recognized as a cloud-native monitoring and security platform with strong adoption across enterprises. Beyond its APM and infrastructure monitoring, it offers a built-in Incident Management module that lets teams declare incidents directly from dashboards, coordinate responders, and generate AI-powered postmortems. Its deep integrations with cloud providers and DevOps tools make it a go-to option for organizations running large multi-cloud estates. However, its layered pricing and seat-based licensing for incident response often raise cost concerns as teams scale.
Key Advantage
Integrated incident lifecycle management—from auto-detection and incident declaration to collaboration, escalation, and retrospective reporting, all within the Datadog ecosystem.
Key Features
- Incident declaration from telemetry: Create incidents directly from metrics, logs, traces, or monitors with one click.
- Collaboration & escalation workflows: Native integrations with Slack, Teams, Jira, and ServiceNow streamline communication.
- AI-powered summaries: Automatically build incident timelines and postmortems to cut down manual effort.
- On-call integration: Connects seamlessly with PagerDuty, Opsgenie, and other on-call platforms.
- Runbook automation: Trigger pre-defined workflows and corrective actions to save time during response.
Pros
- Unified observability and incident management inside one platform
- Strong collaboration features with chat and ticketing tools
- AI-driven summaries and postmortems reduce manual workload
- Large ecosystem of integrations across cloud, DevOps, and security
Cons
- Complex pricing with multiple SKUs and hidden add-on costs
- SaaS-only model; no self-hosting
Datadog Pricing at Scale
Datadog charges differently for different capabilities. APM starts at $31/month; infra starts at $15/month; logs start at $0.10/GB, and so on.
For a mid-sized business ingesting around 45 TB (~45,000 GB) of data per month, the cost would come around $27,475/month.
Tech Fit
Datadog is a strong fit for enterprises running on AWS, Azure, or GCP with complex multi-cloud or Kubernetes deployments. It supports a wide variety of languages and frameworks (Java, Python, Go, Ruby, Node.js, .NET) and suits teams that want observability and incident management from a single SaaS vendor. However, companies with strict compliance requirements or cost sensitivities may find its SaaS-only model and unpredictable pricing challenging.
3. New Relic
Overview
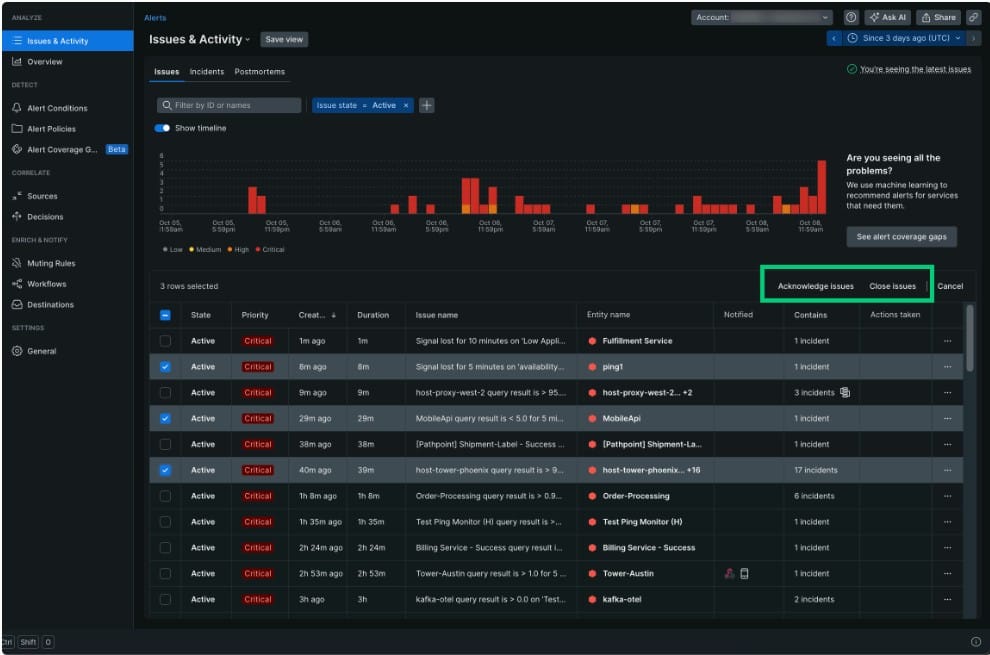
New Relic is a full-stack observability platform with built-in incident workflows that turn noisy alerts into actionable “issues,” layer AI analysis on top, and guide responders from detection to post-incident review. Its Applied Intelligence correlates related incidents, reduces alert noise, and enriches context so teams can investigate faster inside one console.
Key Advantage
AI-assisted correlation and investigation—New Relic groups related incidents into issues, applies correlation logic, and surfaces a single, context-rich view to speed triage and reduce MTTR.
Key Features
- Issues & incident grouping: Consolidates related incidents into a single “issue” with tags, timelines, and impacted entities for faster root-cause analysis.
- Applied Intelligence (AIOps): Detects anomalies, correlates events in seconds, and prioritizes remediation to cut MTTR.
- Correlation decisions: Lets teams tune correlation logic (e.g., by monitor, location) to reduce noise without losing signal.
- Guided response & postmortems: Centralizes incident timelines, context, and follow-ups to standardize reviews.
- Platform integrations: Ties incident workflows to the wider New Relic platform across apps, infra, and cloud providers.
Pros
- Mature “issues” model and AI correlation for faster triage
- Strong first-party console for timelines, impact, and follow-ups
- Broad platform coverage across apps, infra, and cloud
- Tunable correlation to match real-world alert patterns
Cons
- Usage-based ingest fees can rise quickly at high volumes
- SaaS-only deployment; no self-hosting
New Relic Pricing at Scale
New Relic’s billing is based on data ingested, user licenses, and optional add-ons. The free tier offers 100 GB of ingest per month, then it costs $0.40 per GB after that. For a business ingesting 45 TB of logs per month, the cost would come around $25,990/month.
Tech Fit
Well-suited to teams already standardized on New Relic’s SaaS platform across applications and infrastructure, with polyglot stacks and public-cloud footprints. Organizations needing AI-assisted correlation and a unified incident console will find a tight, integrated experience—while highly regulated teams that require self-hosted or hybrid deployments may need to weigh data-residency needs against a SaaS-only model.
4. Dynatrace
Overview
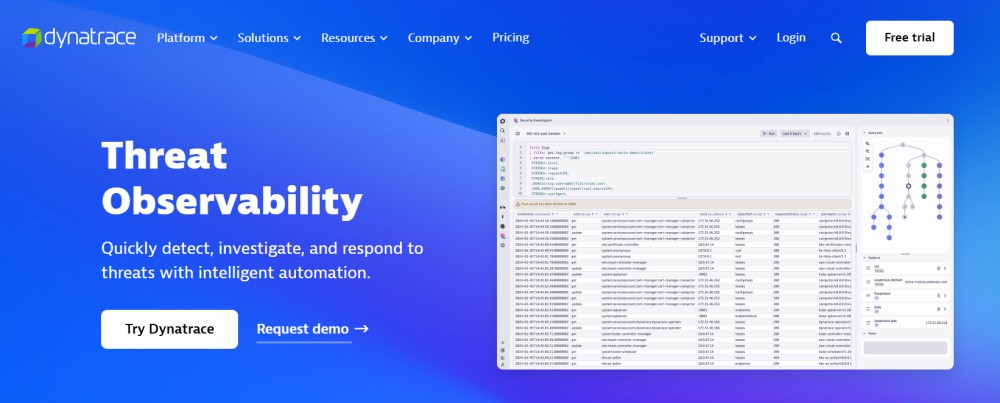
Dynatrace is a unified observability and security platform that centers incident response around “problems”—AI-correlated bundles of related alerts—so teams triage one issue instead of dozens. Davis® AI continuously analyzes topology, metrics, logs, traces, and events, pinpoints the likely root cause, and keeps the incident record updated in real time. Paired with Automations and Grail™ (Dynatrace’s data lakehouse), it turns detection, investigation, and remediation into a guided, problem-centric flow.
Key Advantage
Problem-centric triage with Davis AI—Dynatrace auto-correlates symptoms to a single root cause and drives guided investigation and remediation steps from one place.
Key Features
- Davis AI correlation: Groups related events into one “problem,” suppressing alert storms and focusing responders on impact and root cause.
- Root-cause analysis with topology: Evaluates causal relationships across services, pods, and infra to highlight the precise breaking point.
- Runbooks & Automations: Orchestrate context-aware workflows (rollback, scale, restart) to shorten MTTR and standardize response.
- Grail-backed incident data: Ingest logs/traces/events into Grail for fast queries and timelines during live incidents and postmortems.
- Remediation intelligence: Blends Davis root-cause and community/internal knowledge to guide the “what to do next” step.
Pros
- Mature AI correlation that compresses many alerts into a single problem
- Strong guided investigation with clear impact and dependency context
- Built-in automations to execute standardized remediation
- Scales well in Kubernetes and multi-cloud environments
Cons
- Consumption model spans multiple meters (hosts, logs, traces, events), which requires careful cost governance
- Learning curve around Grail/DQL and platform concepts for teams new to Dynatrace
Dynatrace Pricing at Scale
Dynatrace charges:
- Full stack: $0.01/8 GiB hour/month or $58/month/8GiB host
- Log Ingest & process: $0.20 per GiB
For a similar 45 TB (~45,000 GB/month) volume, the cost would be $21,850/month.
Tech Fit
A strong match for enterprises running large, distributed, Kubernetes-heavy or multi-cloud estates that want AI-driven triage, guided remediation, and tight topology context. Broad language coverage across Java, .NET, Node.js, Go, Python, and more, plus deep cloud/K8s discovery, makes it compelling when teams value problem-centric workflows and built-in automation.
5. PagerDuty
Overview
PagerDuty is a purpose-built incident response platform that mobilizes the right people fast, orchestrates collaboration in Slack/Teams, and standardizes response from first alert through post-incident review. Its product suite spans on-call scheduling, alert routing, AIOps noise reduction, incident workflows, runbook automation, status pages, and stakeholder comms—so ops and engineering teams can handle major incidents without chaos.
Key Advantage
Orchestrated response at scale—on-call, ChatOps, automations, and status comms in one place, so teams can declare, mobilize, and resolve incidents quickly with less manual coordination.
Key Features
- Incident declaration & mobilization: Spin up incidents from signals, auto-page responders, and assign roles for clear command and control.
- ChatOps & stakeholder updates: Create dedicated Slack/Teams bridges and send templated status updates to execs and customers.
- AIOps noise reduction: Deduplicate events, group related alerts, and surface probable cause to speed triage.
- Incident workflows & runbook automation: Trigger standardized actions (create tickets, open bridges, rollback, restart) via no/low-code workflows.
- Post-incident reviews & learning: Capture timelines and evidence to improve processes and prevent repeats.
Pros
- Mature on-call scheduling and escalation used widely in production
- Deep Slack/Teams experience with status pages for business visibility
- AIOps and automation to cut alert fatigue and accelerate response
- 700+ integrations across monitoring, cloud, ITSM, and collaboration
Cons
- Seat-based pricing can scale up quickly for large responder teams
- Alert issues
- Complex configuration
PagerDuty Pricing at Scale
PagerDuty’s Incident Management plans are billed per user: $21/user/month (Professional) and $41/user/month (Business) on a monthly basis. For a mid-sized team with 50 responders, costs range from $1,050–$2,050/month just for incident management seats. Adding AIOps (starting at $699/month) and Runbook Automation (at $125/user/month plus platform fees) can push monthly spending significantly higher.
Tech Fit
Best for organizations that want battle-tested incident response with rich on-call, ChatOps, and automation, and are comfortable with a SaaS, seat-based model. Works well alongside observability tools (Datadog, New Relic, Prometheus, CubeAPM, etc.) and across AWS/Azure/GCP. Teams with strict data-residency or tight per-seat budgets may weigh alternatives or pair PagerDuty with a lower-cost ingest platform for telemetry.
6. Atlassian Opsgenie (now within Jira Service Management)
Overview
Opsgenie is Atlassian’s on-call and incident orchestration solution, letting teams respond to alerts by mapping them to services, dispatching responders, and managing communications—all within a highly structured workflow. Since 2025, Atlassian has begun consolidating Opsgenie into Jira Service Management (JSM) and Compass. Existing users can continue leveraging Opsgenie while transitioning to JSM before full migration. This integration tightens incident response across service catalogs, ITSM, and DevOps workflows.
Key Advantage
Service-aware incident response—Opsgenie ties alerts to the correct team and services, automatically triggering communications, bridging, and tracking within one incident lifecycle (and soon within JSM natively).
Key Features
- Incident templates & roles: Preconfigure responders, communication channels, and escalation paths so incidents kick off cleanly.
- Alert clustering: Auto-group related alarms into one incident to reduce noise and streamline triage.
- Incident timeline & postmortems: Automatically capture all incident events and messages into a structured overview for review.
- Stakeholder updates & status pages: Push templated status messages internally, and optionally link with Statuspage for customer-facing updates.
- Deep Jira/JSM integration: Bi-directional syncing ensures incidents spawn correct issues and SLAs are tracked without switching contexts.
Pros
- Trusted on-call, alert routing, and stakeholder communication layered into Jira/JSM
- Templates and incident timelines boost clarity and post-incident learning
- Seamless bi-directional integration with Jira/JSM enables tight follow-up workflows
Cons
- Seat-based pricing plus incident caps in lower tiers require careful planning
- UI can be confusing
Opsgenie Pricing at Scale
Current public pricing for existing customers shows:
- Free tier: basic usage at $0/user/month
- Essentials: $9.45/user/month
- Standard: $19.95/user/month
- Enterprise: $31.90/user/month
For a mid-sized team with 50 responders, that translates to $472.50/month on Essentials, $997.50/month on Standard, or $1,595/month on Enterprise.
Tech Fit
Best for teams already deep into the Atlassian ecosystem (Jira, Confluence, JSM) that want service-aware incidents and a smooth transition into unified ITSM workflows. Going forward, expect Opsgenie features to be natively supported within JSM—so planning migration and tooling alignment now will help maintain continuity.
7. incident.io
Overview
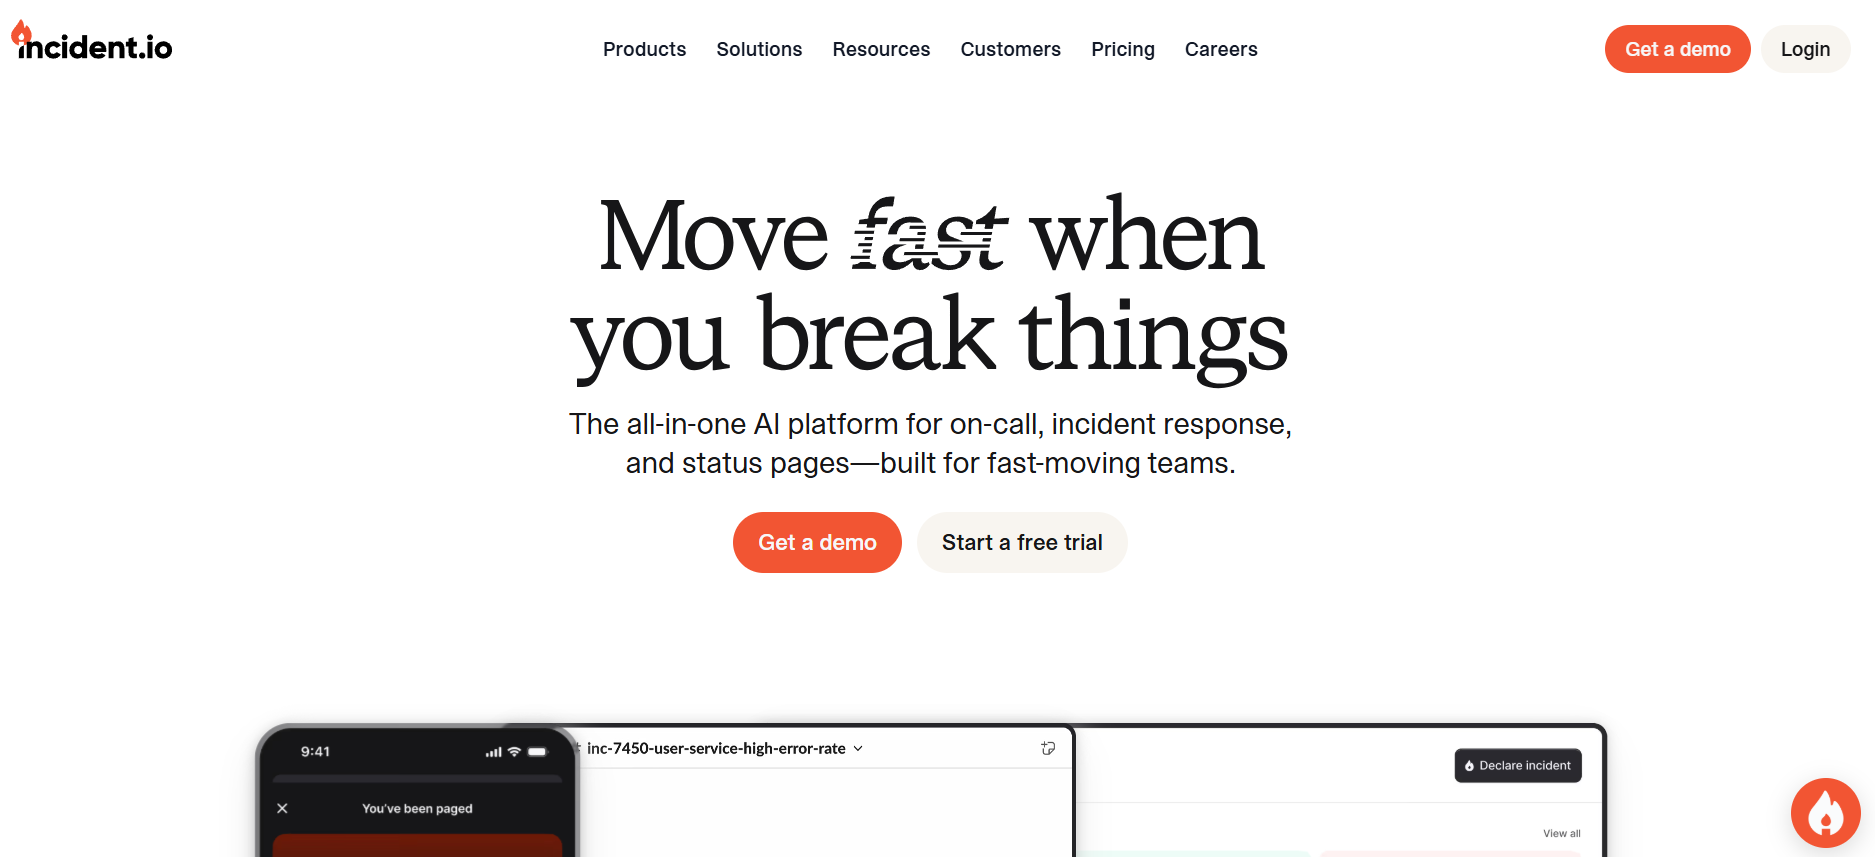
incident.io is a Slack-native incident management tool built for speed and simplicity. From declaring incidents to running playbooks and managing escalations—all happens where engineers already collaborate. Lightweight in setup yet potent in impact, it serves teams that want frictionless incident response with clear pricing.
Key Advantage
Zero-integration setup inside Slack—declare incidents, run workflows, auto-document response, and generate retros all in the same chat where you’re already working.
Key Features
- Slack-first incident declaration: Launch an incident right from Slack, complete with dedicated threads and channels.
- Embedded playbooks & automation: Run structured response routines in-channel to keep everyone aligned.
- Auto-generated summaries & retros: At incident close, auto-capture decisions, timelines, and actions into a tidy report.
- Custom workflows: Define incident types, routing logic, and automated steps natively within Slack.
- Transparent tiered pricing: One per-user rate with clear benefits—no hidden add-ons or seat surprises.
Pros
- Ultra-fast setup—live in Slack within minutes
- One-click retros and summaries reduce manual documentation
- Transparent, simple pricing with no hidden complexity
- Lightweight UX keeps users in a familiar context, reducing friction
Cons
- Limited features
- Configuration can be made easier
incident.io Pricing at Scale
The pricing tiers are:
- Basic: Free forever, covers one team with essential automation and a status page.
- Team: $15 per user/month (with an annual discount, originally $19), includes multi-team alerts, Slack-native response, plus AI and automation. Adding On-call adds $10/user/month.
- Pro: $25 per user/month, unlocks advanced insights, custom post-incident flows, private incident types, and policy controls. On-call add-on is $20/user/month.
- Enterprise: Custom pricing for full-scale deployments, with added controls, training, and environments.
For a mid-sized team of 50 responders using the Team tier plus on-call add-on, costs are:
- Base tier: 50 × $15 = $750/month
- On-call add-on: 50 × $10 = $500/month
- Total: $1,250/month
Tech Fit
Best for teams deeply embedded in Slack who value speed, simplicity, and transparency in incident response. If you also need observability data (metrics, logs, traces), CubeAPM offers a more cost-efficient and unified solution.
8. Splunk On-Call (VictorOps)

Overview
Splunk On-Call (formerly VictorOps) is a dedicated on-call and incident response platform focused on getting the right people involved fast. It centralizes alert routing, escalations, runbooks, and collaboration (web, mobile, and chat) so responders can acknowledge, triage, and resolve incidents without friction. With deep integrations into monitoring/observability stacks and ITSM tools, it’s a popular choice for teams that want lightweight, dependable incident coordination on top of their existing telemetry.
Key Advantage
On-call scheduling and intelligent routing built for speed—escalation policies, rotations, and targeted paging ensure incidents land with the right responder, with mobile-first workflows to reduce time to acknowledge.
Key Features
- On-call schedules & escalations: Define rotations, handoffs, and multi-step escalation policies to page the right people quickly.
- Routing & deduplication: Ingest alerts from your monitoring stack, de-noise them, and route by service, team, or priority.
- Runbooks & annotations: Attach playbooks and notes to incidents so responders have immediate, actionable guidance.
- ChatOps & collaboration: Open bridges, push updates, and coordinate in Slack/Teams alongside the web and mobile apps.
- Integrations marketplace: Connects with major observability tools, CI/CD, cloud services, and ITSM platforms for end-to-end flow.
Pros
- Reliable, battle-tested on-call and escalation workflows
- Strong mobile experience for acknowledging, reassigning, and collaborating on the go
- Broad integrations across monitoring, cloud, and ITSM ecosystems
- Simple to layer on top of any existing observability stack
Cons
- Seat/tier limits mean costs can step up as teams grow beyond entry tiers
- Complex UI and navigation
Splunk On-Call Pricing at Scale
Splunk lists an entry price of $5/month for up to 10 seats (starter tier), with higher tiers for larger teams and advanced features. For a mid-sized responder group of 50 users, you’ll move beyond the entry tier—expect seat-based costs that scale with headcount and features. Remember this covers incident coordination only; you’ll still need observability/telemetry.
Tech Fit
Great for teams that want a lightweight, dependable on-call layer with strong mobile and ChatOps support, and that already rely on separate tools for metrics/logs/traces. Works well in mixed environments (Kubernetes, multi-cloud, on-prem) where the priority is dependable paging, escalations, and clean handoffs—while pairing with a cost-efficient observability backend like CubeAPM for telemetry.
How to choose the right Incident Management tool
Picking an incident management platform isn’t just about checklists—it’s about aligning tooling to your risk model, data governance, and response workflow. Use these criteria to evaluate vendors.
Security-by-design & NIST alignment
Favor tools that map cleanly to the NIST Incident Response lifecycle (Preparation → Detection/Analysis → Containment/Eradication/Recovery → Post-Incident). Ask how the product supports each phase (playbooks, evidence capture, containment actions) and how it integrates with your CSF 2.0 controls.
Data residency, deployment model, and access controls
Confirm where incident data lives (region, cloud, on-prem), who can access it, and how it’s encrypted at rest/in transit. Regulated teams often require self-hosting or regional data stores; SaaS-only tools may be a non-starter. Require SSO/SAML, SCIM, RBAC, audit logs, and least-privilege defaults.
Correlation and context (metrics ↔ logs ↔ traces ↔ users)
During an incident, jumping from an alert to the right trace span, log lines, impacted service, and user journeys is what cuts MTTR. Evaluate first-class correlation and pivots: alert → service dependency → trace/log slice → user/session impact → change events. Atlassian’s handbook emphasizes correlation and service context for faster triage.
Noise reduction, on-call ergonomics, and comms
Look for deduplication, alert grouping, auto-suppression, and priority routing to fight alert fatigue. Strong tools also standardize stakeholder updates and create chat bridges (Slack/Teams) with a clear incident timeline. Atlassian and industry guides highlight purpose-built comms and humane on-call as essentials.
Automation & runbooks (AIOps where it helps)
Minutes matter. Prefer platforms with runbook automation (safe rollbacks, quorum restarts, feature-flag flips) and AI-assisted enrichment/summaries that reduce manual toil. Validate cost and scope—many vendors price automation separately.
Integration surface: SIEM, SOAR, ITSM, CI/CD, cloud
Your tool must plug into SIEM/SOAR for security signals, ITSM (Jira/ServiceNow) for tickets/SLAs, chat for real-time ops, and cloud/K8s discovery. Shortlist vendors that centralize alerts and bi-directionally sync with service catalogs and runbooks.
Scalability for Kubernetes & multi-cloud
K8s and multi-cloud create high-cardinality, short-lived signals. Ensure the vendor supports pod/service awareness, autoscaling churn, and cross-region incidents—without exploding cost or losing visibility. Community threads regularly call out platforms that struggle (or charge heavily) here.
Pricing transparency & TCO modelling
Seat fees + data ingest + retention + add-ons (AIOps, runbooks, status pages) = surprise invoices. Model 12 months of TCO including incident seats, telemetry volume, and required add-ons. Practitioner discussions frequently flag multi-SKU pricing as a pain point; demand clear caps/controls.
Post-incident learning & auditability
High-performing teams rely on structured retros with timelines, actions, and evidence—exportable for audits. Verify searchable timelines, immutable logs, and links back to code/changes so fixes actually stick. Atlassian’s handbook underlines this continuous-improvement loop.
Conclusion
Choosing the right incident management tool often feels overwhelming. Teams struggle with alert fatigue, unpredictable pricing, siloed data, and complex multi-cloud environments, all of which make incidents harder to resolve quickly. These challenges not only increase downtime but also put unnecessary pressure on engineering teams.
That’s where CubeAPM stands out. By combining full-stack observability with incident management built in, it delivers real-time alerting, Smart Sampling to cut noise, and seamless correlation across logs, metrics, and traces at a predictable rate. This gives teams both clarity and cost control at scale.
Book a free demo today and experience how CubeAPM can streamline your response and keep systems always on.
Disclaimer: The information in this article reflects the latest details available at the time of publication and may change as technologies and products evolve.
FAQs
1. What industries benefit the most from incident management tools?
Industries like finance, healthcare, e-commerce, and SaaS rely heavily on incident management tools because downtime directly impacts revenue, compliance, and customer trust.
2. How do incident management tools help reduce downtime costs?
By automating alerting, escalation, and correlation, these tools shorten mean time to resolution (MTTR), which reduces financial losses from outages.
3. Can incident management tools integrate with DevOps workflows?
Yes. Most modern tools integrate with CI/CD pipelines, ticketing systems like Jira, and chat platforms such as Slack or Microsoft Teams to streamline response.
4. What’s the difference between incident management and problem management?
Incident management focuses on quickly restoring service after disruptions, while problem management digs deeper to identify root causes and prevent future issues.
5. Which incident management tools are best for teams worried about unpredictable pricing?
Tools with usage-based pricing models are ideal. For example, CubeAPM charges a simple $0.15/GB of data ingested, making costs transparent even for teams ingesting 45 TB/month.


