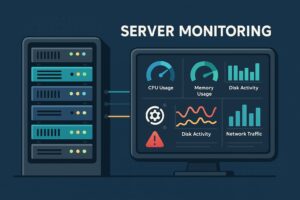
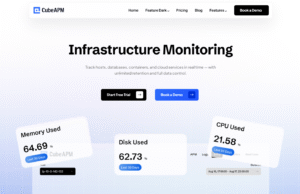
By 2025, nearly half of global cloud workloads run on AWS. From tracking EC2 instance performance and RDS query health to monitoring Kubernetes clusters on EKS and detecting cold starts in AWS Lambda, businesses rely on AWS monitoring tools to track performance, correlate telemetry, and ensure resilient, cost-efficient operations.
Yet finding the right AWS monitoring tool is challenging. Teams often struggle with unpredictable pricing models, limited visibility into serverless workloads, and the complexity of managing data across multi-account and multi-region AWS environments. High-volume telemetry from EKS clusters adds noise, while incomplete correlation between logs, metrics, and traces slows root-cause analysis and inflates operational costs.
CubeAPM is the best AWS monitoring tool provider, as its AWS integrations go beyond standard CloudWatch polling by supporting Metric Streams and Kinesis Firehose pipelines for real-time ingestion at scale. It also provides direct OTLP ingestion for services like RDS, MSK, and OpenSearch. Combined with OpenTelemetry-native support, smart sampling, and transparent pricing, CubeAPM delivers full-stack observability without vendor lock-in.
In this article, we’ll explore the top AWS monitoring tools to help you choose the right fit for your AWS workloads.
Table of Contents
ToggleTop AWS Monitoring Tools
- CubeAPM
- Datadog
- Dynatrace
- New Relic
- Amazon CloudWatch
- Grafana Cloud
- AWS CloudTrail
- AWS Config
What is an AWS Monitoring Tool?

An AWS monitoring tool is a platform that collects and analyzes telemetry—metrics, logs, traces, and events—from AWS services like EC2, EKS, RDS, and Lambda. It helps teams detect issues, optimize performance, and ensure cloud resources are reliable and cost-efficient.
Example of AWS Monitoring Tools in Action
Suppose an e-commerce site running on AWS experiences slow checkout. An AWS monitoring tool can trace the request across API Gateway → Lambda → DynamoDB, highlighting where latency or errors occur. Engineers get actionable insights to fix the root cause quickly, while business teams see service health at a glance.
The benefits go beyond troubleshooting: these tools enable real-time visibility, speed up incident resolution, improve customer experience, and provide the data needed for smarter scaling and cost management. In short, AWS monitoring tools are the nerve center of cloud operations, turning raw telemetry into decisions.
Why Teams Choose Different AWS Monitoring Tools
1. Information Overload & Alert Fatigue
AWS environments create high data volumes from tools like CloudWatch, EKS, and Lambda. When monitoring tools lack smart filtering, teams drown in alerts and dashboards that are hard to prioritize, turning observability into noise instead of clarity.
2. Surprise Billing & Hidden Complexity
Unpredictable costs are one of the biggest frustrations. Data transfer across regions, custom metrics, and retention fees can cause AWS monitoring bills to spike unexpectedly, leaving teams struggling with budgeting and cost control.
3. Limited Visibility in Serverless Workloads
Serverless adoption is booming, but many tools still struggle with short-lived Lambda functions or asynchronous Step Functions. This makes it difficult to trace requests end-to-end and troubleshoot performance issues in real time.
4. Fragmented Multi-Account & Multi-Region Monitoring
Most enterprises operate multiple AWS accounts and regions, often with Kubernetes clusters layered on top. Without unified views and standardized pipelines, monitoring becomes siloed, creating operational blind spots.
5. Lack of Context for Root-Cause Analysis
When incidents happen, engineers need to see how failures link to specific deployments, services, or availability zones. Tools that can’t tie telemetry to topology and metadata slow down root-cause analysis and extend outages.
6. AWS-Native vs. Third-Party Extendability
Some teams stick with AWS-native tools like CloudWatch, X-Ray, and ADOT for tight integration and ownership alignment. These native tools cover logs, metrics, and traces, with deep integration into services like EC2, Lambda, and OpenTelemetry agents. However, teams adopting multi-cloud strategies or seeking advanced analytics often opt for third-party platforms (e.g., Datadog or Dynatrace) that integrate AWS telemetry with broader observability features.
Top 8 AWS Monitoring Tools
1. CubeAPM
Overview
CubeAPM is an OpenTelemetry-first observability platform built for AWS-native teams. It’s known for simplicity, speed, and transparent pricing while offering full-stack observability—APM, infrastructure monitoring, logs, and error tracking—integrated closely with services like CloudWatch, EKS, and Lambda.
Key Advantage
CubeAPM’s Smart Sampling ensures AWS users capture the most valuable traces tied to errors, slowdowns, or anomalies while filtering out noise, delivering deep insights without ballooning storage costs. This gives engineering teams the ability to troubleshoot faster while keeping monitoring costs under control.
Key Features
- AWS CloudWatch integration: Supports Metric Streams and Firehose pipelines to monitor RDS, MSK, and OpenSearch in near real time.
- Distributed tracing: Tracks requests across EC2, EKS pods, Lambda, and API Gateway to identify bottlenecks quickly.
- Error tracking: Groups recurring issues and links them to specific AWS services for faster resolution.
- Infrastructure monitoring: Collects CPU, memory, and network metrics from EC2, containers, and managed AWS services.
- Alerting & SLOs: Provides multi-window alerts with Slack, PagerDuty, and webhook integrations for AWS operations.
Pros
- Smart sampling reduces AWS telemetry noise
- Transparent pricing with no hidden fees
- Strong AWS service integrations out of the box
- 800+ integrations included
- No cloud egress charges
- Clean dashboards and intuitive onboarding
Cons
- May not suit those businesses that need SaaS-only tools
- No cloud security management features; an observability-focused provider
CubeAPM Pricing at Scale
CubeAPM uses an ingestion-based model at $0.15/GB. A mid-sized company ingesting 10 TB of AWS telemetry each month would pay about $1,500/month. Costs scale linearly with data growth, making budgeting predictable compared to per-host or custom metric billing.
Tech Fit
CubeAPM is ideal for AWS-native environments running EKS, Lambda, EC2, and RDS. With full OpenTelemetry and Prometheus compatibility, it fits multi-language microservices, serverless applications, and Kubernetes-heavy deployments, aligning with AWS observability best practices.
2. Datadog
Overview
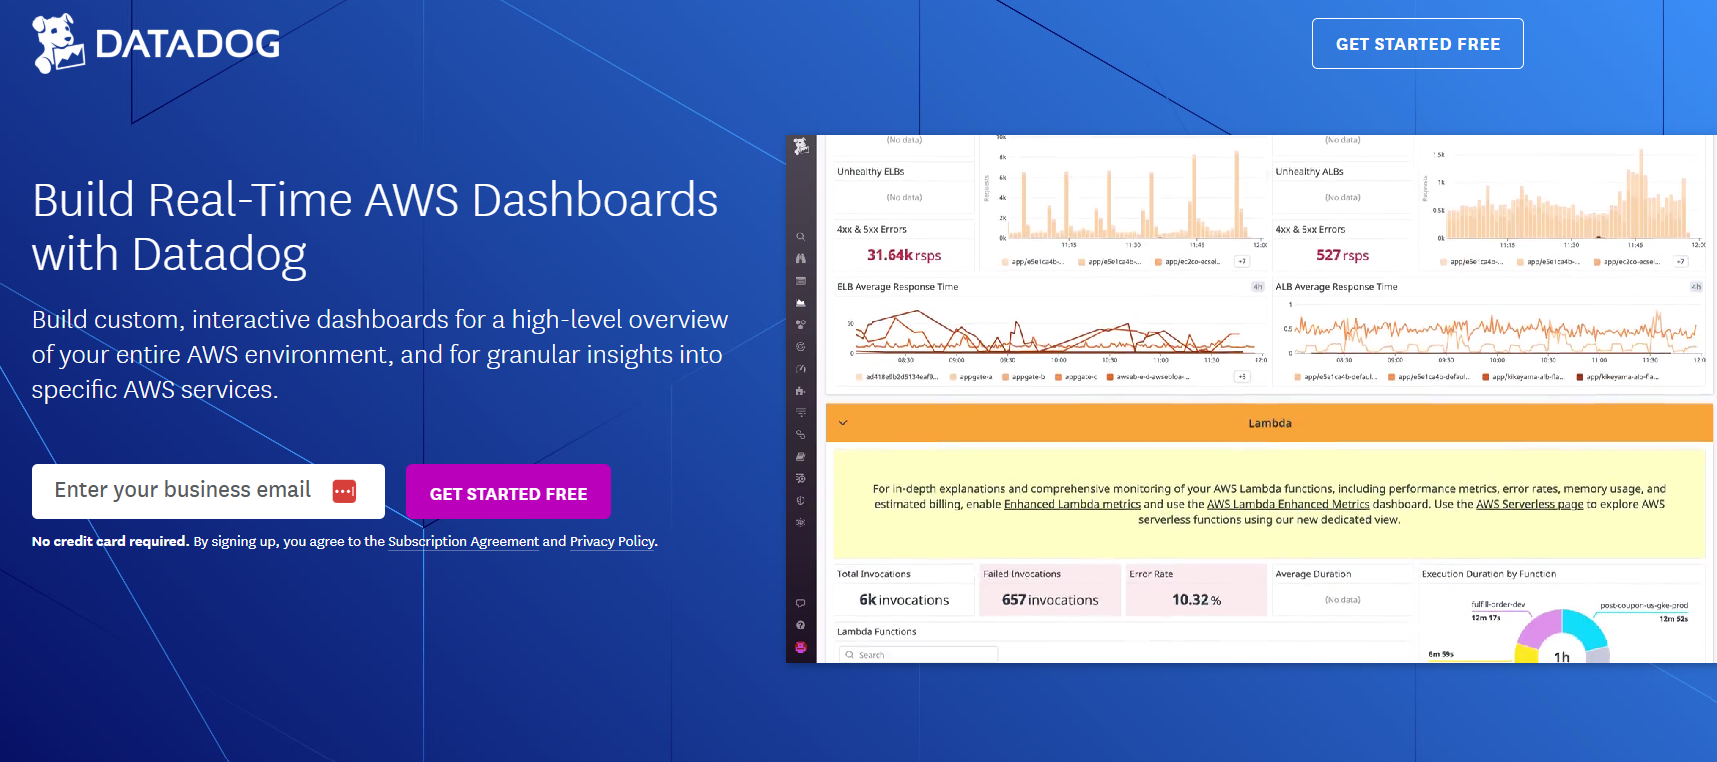
Datadog is a SaaS-first observability platform widely adopted on AWS for end-to-end visibility across infrastructure, applications, and digital experience. It offers deep integrations with 90+ AWS services, including CloudWatch, Lambda, EKS, RDS, and API Gateway, along with a massive product surface spanning APM, logs, RUM, synthetics, and security.
Key Advantage
Datadog’s strength lies in its breadth—combining infrastructure, APM, logs, user experience monitoring, and security into one platform. This unified approach makes it easier for AWS teams to troubleshoot issues quickly without switching between multiple tools.
Key Features
- AWS integration: Connects with 90+ AWS services via CloudWatch with guided setup and prebuilt dashboards.
- APM & tracing: Host-based APM with options for both ingested and indexed spans for deeper analysis.
- Serverless monitoring: Provides visibility into Lambda with per-invocation pricing for serverless traces.
- Log management: Separates ingestion and indexing to control retention and query costs.
- Cloud cost management: Helps optimize AWS bills by correlating usage data with observability insights.
Pros
- Extensive AWS coverage and integrations
- Covers all important observability aspects: infra, APM, logs, RUM, synthetics, and security
- Mature SaaS model with fast onboarding and automation
- Strong ecosystem and community support
Cons
- The pricing model is complex with multiple SKUs
- Bills can spike with high-cardinality data and long log retention
- Auto-scaling adds overhead due to host-based billing
- OpenTelemetry support still requires Datadog-specific configuration
Datadog Pricing at Scale
Datadog uses multiple pricing levers that scale differently:
- Infrastructure monitoring: Around $18 per host/month (medium tier).
- APM monitoring: Around $36 per APM host/month.
- Log ingestion: $0.10 per GB ingested.
- APM spans: Ingested and indexed spans are billed separately per GB or per million.
For a mid-sized company ingesting 10 TB of data each month, just ingestion costs reach about $1,000/month. When you add APM hosts, infra hosts, and indexed log/spans, the total typically rises well beyond that.
In contrast, CubeAPM charges a flat $0.15/GB with transparent pricing—about $1,500/month for 10 TB—with no hidden host or indexing fees, making it a far more predictable and affordable option.
Tech Fit
Datadog fits organizations with diverse AWS workloads—EC2, EKS, and Lambda—where teams want one managed platform for monitoring, logging, and user experience analytics. It works best for teams that value breadth and prebuilt AWS integrations, and are comfortable managing complex pricing trade-offs to balance visibility with cost.
3. Dynatrace
Overview
Dynatrace is an enterprise observability platform with deep AWS coverage. It ingests CloudWatch metrics (including Metric Streams through Firehose) and augments them with full-stack visibility using its OneAgent on EC2, EKS, and Lambda. Its Davis AI engine adds automated problem detection and root-cause analysis, making it a strong choice for complex cloud estates.
Key Advantage
Dynatrace excels at automated context and causality. By continuously mapping AWS topologies and correlating telemetry across services, it highlights the most likely root cause of an incident so engineers can act faster without manual correlation.
Key Features
- AWS data ingestion: Supports remote ingestion from CloudWatch, including Metric Streams via Firehose, to achieve near real-time coverage of AWS services.
- Full-stack agents: OneAgent extends visibility to EC2, EKS, and Lambda for code-level details, service maps, and automatic problem detection.
- Logs, traces, metrics in Grail: Unified storage and analytics with usage-based pricing for ingest, retention, and query.
- Cost and usage transparency: Clear rate card pricing for ingest, retention, and queries to forecast spend against data growth.
Pros
- Strong automated root-cause analysis for complex AWS estates
- Mature full-stack coverage across EC2, EKS, and Lambda
- Unified data platform with logs, traces, and metrics together
- Well-suited for multi-account, multi-region enterprises
Cons
- Retention and query charges can add up quickly
- Yearly commitment model of pricing may feel heavy for mid-market teams
- Steeper learning curve for advanced configuration
Dynatrace Pricing at Scale
- Logs & traces ingestion: ~$0.20 per GiB.
- Retention: ~$0.02 per GiB-day with included queries.
- Metrics: ~$0.15 per 100k data points.
10 TB/month example: 10 TB ≈ 9,313 GiB → around $1,863/month for ingestion alone. With 7-day retention, add ~$1,300/month; for 30-day retention, this climbs to over $5,500/month—before metric and query costs.
For comparison, CubeAPM offers a transparent $0.15/GB model, meaning the same 10 TB would cost around $1,500/month with no hidden retention or query add-ons. This makes CubeAPM significantly more affordable and predictable for mid-sized AWS teams, while Dynatrace’s layered pricing is better suited for large enterprises with bigger budgets.
Tech Fit
Dynatrace is a strong fit for enterprises running large, distributed AWS environments—multi-account, multi-region setups with EKS at scale, a mix of EC2, Lambda, and managed services. Its automated dependency mapping and AI-assisted root cause analysis are especially valuable in complex architectures, while mid-sized AWS-first teams may lean toward CubeAPM for simpler and more cost-predictable monitoring.
4. New Relic
Overview
New Relic is a SaaS-based observability platform with deep AWS integrations. It pulls telemetry via CloudWatch (including Metric Streams) and augments it with application and infrastructure insights across EC2, EKS, Lambda, and many other AWS services, all in a single UI.
Key Advantage
A unified data plane for cloud telemetry. New Relic centralizes AWS metrics, logs, and application signals in one workspace, so teams can pivot from infrastructure symptoms to code-level evidence without leaving the platform.
Key Features
- AWS onboarding: Quickstart integrations for EC2, EKS, Lambda, Fargate, RDS, and more with prebuilt dashboards and guided setup.
- CloudWatch Metric Streams: Real-time streaming of AWS metrics via Firehose for fresher visibility than API polling.
- Full-stack observability: APM, infra monitoring, logs, RUM, and synthetics accessible in one place to accelerate triage.
- Agentless AWS coverage: API-based integrations for services where agents don’t run, such as Lambda, DynamoDB, and S3.
- Multi-account visibility: Connect multiple AWS accounts and regions to unify monitoring across environments.
Pros
- Broad and well-documented AWS integrations
- Single UI for infra, APM, logs, and user experience
- Mature SaaS with fast onboarding
- Large ecosystem and quickstarts
Cons
- Data and user-based pricing can become expensive at scale
- Managing ingest vs. retention trade-offs adds complexity
- Some teams prefer OpenTelemetry-first pipelines over vendor agents
New Relic Pricing at Scale
- Data ingest (mid/high tier): On Data Plus, New Relic bills per GB ingested, often in the $0.50–$0.55/GB range, with only 100 GB free each month.
- 10 TB/month example: ~10,000 GB × $0.55 ≈ $5,500/month for ingest alone, not including user seats or premium features.
In comparison, CubeAPM’s transparent ingest model is $0.15/GB, so the same 10 TB is about $1,500/month with no extra host or indexing fees—making it far more predictable and affordable for mid-sized AWS teams.
Tech Fit
New Relic fits AWS users who want a single, managed platform covering EC2, EKS, and Lambda with near-real-time CloudWatch streaming and curated dashboards. It works well for polyglot microservices and platform teams that value SaaS speed, while cost-conscious teams often lean toward CubeAPM for simpler, OTel-first observability.
5. Amazon CloudWatch
Overview
Amazon CloudWatch collects metrics, logs, and events from virtually every AWS service, supports alarms and dashboards, and ties directly into services like Lambda and SNS—making it the default first stop for many AWS teams.
Key Advantage
Seamless, first-party coverage. Because CloudWatch is built into AWS, it discovers services automatically, streams platform metrics without extra agents, and offers turnkey setup for alarms, dashboards, and service integrations.
Key Features
- Unified AWS coverage: Pulls metrics, logs, and events from core services (EC2, EKS, RDS, Lambda, API Gateway) with native dashboards and alarms.
- CloudWatch Logs: Centralizes application and service logs with ingestion, storage, and query (Logs Insights) for troubleshooting.
- Metric Streams: The tool provides metrics to partners or your own pipeline in near-real time to avoid heavy API polling.
- 15-month metrics retention: Enables trend analysis with up to one-second granularity for custom metrics.
Pros
- Native to AWS with minimal setup
- Broadest service coverage out of the box
- Tight integration with AWS security and automation
- Good building block for DIY observability pipelines
Cons
- Pricing spans many levers (metrics, logs, storage, queries)
- Heavy log volumes can get expensive
- Cross-account, multi-region views require extra assembly
- Limited end-to-end app context compared to full APMs
Amazon CloudWatch Pricing at Scale
- Logs ingestion: Standard CloudWatch Logs start at $0.50/GB. For 10 TB/month (~10,000 GB), ingestion alone is around $5,000/month.
- Log storage: About $0.03/GB-month; storing 10 TB for 30 days adds around $300/month before queries.
- Metrics: Custom metrics typically cost $0.30 per metric/month for the first 10k. Actual spend depends on how many custom series are emitted.
- Lambda log tiering: Lambda-to-CloudWatch Logs now uses tiered pricing starting at $0.50/GB, with lower rates at higher volumes.
In contrast, CubeAPM’s transparent $0.15/GB model prices the same 10 TB at about $1,500/month for ingest, with no separate per-metric or per-query add-ons—making it far more predictable for mid-sized teams.
Tech Fit
CloudWatch suits AWS-first organizations that want native building blocks for monitoring—especially teams comfortable assembling dashboards, alarms, and streams across multiple accounts and regions. It’s a solid foundation for EC2/EKS/Lambda estates and can be paired with Metric Streams to feed third-party backends; cost-sensitive teams with large log volumes often compare it against simpler, ingest-only pricing models like CubeAPM for predictability.
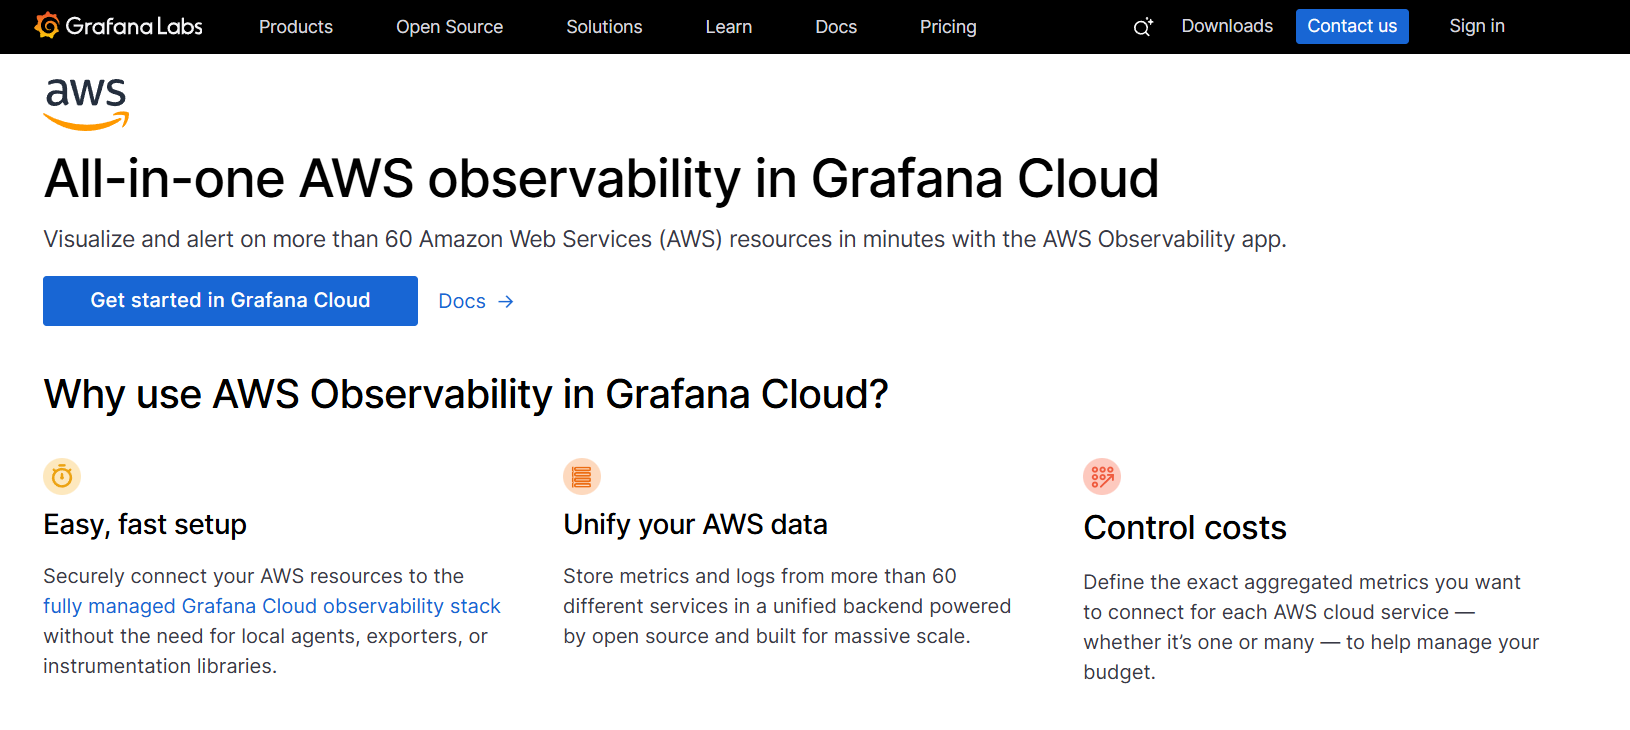
6. Grafana Cloud
Overview
Grafana Cloud provides AWS observability using the LGTM stack—Loki for logs, Grafana for visualization, Tempo for traces, and Mimir for metrics—with a guided AWS Observability app to connect 60+ AWS services in minutes. It’s a managed path to dashboards, alerts, and cross-signal queries without standing up your own back end.
Key Advantage
Standards-first, cloud-managed observability. Grafana Cloud pairs native AWS integrations (CloudWatch metrics/logs) with PromQL/LogQL/TraceQL queries and curated AWS dashboards, so teams can standardize on open tooling while offloading storage and scale to a managed service.
Key Features
- AWS onboarding: The AWS Observability app wires up EC2, EKS, Lambda, RDS, API Gateway, and more with prebuilt dashboards and alerts.
- CloudWatch metrics: Ingest CloudWatch across regions into Grafana Cloud and work with it using PromQL for powerful queries and alerting.
- Logs pipelines: Ship logs via a Lambda-compatible agent or Amazon Data Firehose; Firehose is highlighted as more scalable and cost-efficient.
- Cost controls: Transparent unit pricing for metrics (per 1,000 series), logs (per GB ingest + retention), and traces (per GB), with a generous fair-use query policy for logs.
Pros
- Fast AWS setup with curated dashboards
- Open standards across metrics, logs, and traces
- Managed scale without running your own back end
- Good cost tooling and guidance for large estates
Cons
- Multiple pricing levers (series, ingest, retention) to track
- Costs depend heavily on log and trace volume
- Deeper APM features may require additional buildout
Grafana Cloud Pricing at Scale
- Logs ingest (Loki): ~$0.40/GB; retention: ~$0.10/GB-month
- Traces (Tempo): ~$0.50/GB ingested
- Metrics (Mimir): ~$8 per 1,000 low-res series/month (or ~$16 high-res). Actual spend depends on active series/cardinality
10 TB/month example:
- If primarily logs: ~10,000 GB × $0.40 ≈ $4,000/month ingest + ~$1,000/month for 30-day retention
- If primarily traces: ~10,000 GB × $0.50 ≈ $5,000/month ingest (retention priced separately)
- Metrics add-on based on active series (for example, 50k low-res series ≈ $400/month)
By comparison, CubeAPM uses a single transparent model at $0.15/GB—so 10 TB ≈ $1,500/month with no separate per-series or per-query add-ons—typically more predictable for mid-sized AWS teams.
Tech Fit
Grafana Cloud fits AWS shops that want open, query-driven workflows (PromQL, LogQL, TraceQL) and a managed path to scale. It’s a strong match for EKS-heavy and multi-account environments where CloudWatch data needs to be centralized, enriched, and correlated with application signals, while teams that prioritize flat, ingest-only pricing may find CubeAPM more cost-predictable.
7. AWS CloudTrail
Overview
AWS CloudTrail is the native AWS service that records nearly every API call and user activity across your account—capturing who did what, when, and where. It’s foundational for auditing, security, and operational diagnostics, with automatic Event History for 90-day insights and deeper Long-term analysis via CloudTrail Lake.
Key Advantage
Deep governance and audit readiness out of the box—CloudTrail tracks control-plane and data-plane events across regions and accounts, with optional Insights to flag anomalies in API behavior.
Key Features
- Automatic event recording: Always-on capture of management, data, and network activity, including event history and cross-account trails.
- CloudTrail Lake: Ingest, store (with tiered retention), and query events via SQL interface for forensic or compliance use.
- Insights: Uses behavioral analytics to detect anomalous API activity like error spikes or abnormal access patterns.
Pros
- Native AWS service—no setup needed for basic event logging
- Deep audit-level detail across services and accounts
- Insightful anomaly detection and SQL querying with CloudTrail Lake
Cons
- Pricing can escalate with high ingestion or long retention
- Event scanning (via Athena) adds cost on top of ingestion
- Limited application-level observability—API-focused only
AWS CloudTrail Pricing at Scale
- Event ingestion: CloudTrail Lake charges tiered rates for uncompressed ingestion—$2.50/GB for the first 5 TB, $1/GB for the next 20 TB, and $0.50/GB beyond 25 TB.
- Querying: Runs via Athena at ~$0.005 per GB scanned.
- Example (10 TB uncompressed/month):
- 5 TB × $2.50 = $12,500
- 5 TB × $1 = $5,000
- Total ingestion ≈ $17,500/month, before any query costs.
By contrast, CubeAPM offers transparent pricing at $0.15/GB, charging approximately $1,500/month for the same 10 TB of ingest—no overages, no tiers, far more predictable for observability use cases.
Tech Fit
CloudTrail excels when you need forensic tracking, audit trails, or governance across AWS accounts. It’s ideal for compliance-heavy environments and detecting API-level anomalies. For teams needing broader observability—correlating metrics, logs, traces across services—CubeAPM delivers richer context and far simpler pricing.
8. AWS Config
Overview
AWS Config is a native governance and compliance service that continuously records the configuration state of AWS resources. Rather than focusing on application performance or request tracing, it helps teams monitor how resources are set up, track configuration changes over time, and evaluate them against compliance rules.
Key Advantage
Continuous visibility into configuration drift and compliance posture. AWS Config gives teams a historical record of resource changes and evaluates them against best practices or custom rules, making it easier to spot misconfigurations before they cause downtime or security gaps.
Key Features
- Configuration recording: Captures real-time and periodic configuration changes for supported AWS resources.
- Rules & conformance packs: Evaluate whether resources comply with security and operational standards.
- Multi-account aggregation: Roll up compliance data across accounts and Regions for centralized reporting.
- Change queries & integrations: Query historical resource states and trigger automation via S3, SNS, or Lambda.
Pros
- Native AWS service with wide resource coverage
- Provides historical visibility for audits and forensics
- Simplifies compliance with prebuilt rules and conformance packs
- Centralizes compliance reporting across large AWS estates
Cons
- Not an application-level APM—no metrics, traces, or logs
- Pricing is tied to configuration items and evaluations, which can be hard to forecast
- Extra costs from S3, SNS, or Lambda integrations
AWS Config Pricing at Scale
AWS Config charges based on configuration items (CIs) and rule/conformance pack evaluations:
- CIs: ~$0.003 per item
- Rule evaluations: Tiered from $0.001 down to $0.0005 per evaluation, depending on volume
- Example (mid-sized estate): 1,000,000 CIs/month ($3,000) + 2M rule evaluations ($1,170) + 500k conformance pack evaluations ($420) = ~$4,590/month, excluding storage/notifications.
By comparison, CubeAPM uses a flat $0.15/GB ingest model. Monitoring 10 TB of AWS telemetry costs ~$1,500/month with no per-item or evaluation tiers—far simpler and more affordable for observability use cases.
Tech Fit
AWS Config is best for compliance and governance monitoring—proving resources are encrypted, tagged correctly, or following network policies. It’s not designed for performance observability. For teams that need to track latency, trace requests, or correlate logs and metrics, a dedicated APM like CubeAPM is a better fit. Used together, Config strengthens compliance while CubeAPM ensures application performance.
How to Choose the Right APM Tool for AWS
Native AWS Integration
Your monitoring tool should integrate seamlessly with AWS services like CloudWatch, Lambda Insights, and X-Ray. Automatic service discovery across multiple accounts and real-time Metric Streams support ensure full-stack visibility without tedious manual setup.
Cost Predictability
AWS environments generate massive telemetry. Many tools create unexpected charges through per-host or per-query pricing. Choose a platform with transparent, ingestion-based pricing so you can forecast costs as your usage grows—without bill shock.
OpenTelemetry Support
With AWS promoting the AWS Distro for OpenTelemetry (ADOT), OTel-first support is now essential. This ensures you can instrument once, keep telemetry portable, and avoid vendor lock-in if you switch platforms in the future.
Scalability and Noise Reduction
K8 and microservices on AWS generate a heavy amount of data. Look for features like smart sampling, noise filtering, and tiered retention that keep telemetry pipelines efficient while still surfacing critical signals.
Serverless Observability
If you rely heavily on Lambda, ensure the tool provides deep insights into cold starts, concurrency limits, and async workflows across API Gateway, DynamoDB, and SQS. This visibility is crucial to prevent performance issues from reaching end users.
Conclusion
Choosing the right AWS monitoring tool is challenging. Teams often struggle with hidden costs, fragmented visibility across services, and the complexity of monitoring hybrid workloads. These gaps lead to blind spots, slow troubleshooting, and wasted resources.
CubeAPM addresses these pain points directly. With transparent pricing, OpenTelemetry-first design, and full MELT observability, it provides deep insights into AWS services, Kubernetes, and serverless environments—all without the usual vendor lock-in or unpredictable bills.
If your team is scaling on AWS, CubeAPM is the best choice for cost-effective, reliable monitoring. Get started with CubeAPM today.


