Zipkin, the open-source tracing tool from Twitter, has over 17,000 GitHub stars, is widely adopted, and effective for visualising end-to-end request flows and service dependencies. However, users working with large trace volumes often report that navigating and filtering traces in the UI can become overwhelming, increasing the effort required to investigate issues at scale.
CubeAPM is the best alternative to Zipkin for teams that need a more scalable and easier-to-use observability platform. While Zipkin focuses on distributed tracing, CubeAPM offers an OpenTelemetry-native platform with a modern UI and built-in sampling, making it simpler to analyze large trace volumes in production.
In this article, we’ll explore the top 7 Zipkin alternatives, comparing their capabilities, pricing, deployment models, and OpenTelemetry readiness.
Top 7 Zipkin Alternatives
- CubeAPM
- Dynatrace
- New Relic
- Datadog
- Splunk AppDynamics
- Middleware
- Grafana
Why Look for Zipkin Alternatives?
Engineering teams and DevOps leaders are increasingly migrating from Zipkin due to the following reasons:
1. UI and Integration Friction
Zipkin’s UI is minimal and outdated compared to modern observability platforms. Integration with cloud-native services (AWS Lambda, Kubernetes, etc.) is either manual or unavailable out of the box.
2. Community Support Only, No SLAs
Zipkin is supported primarily via GitHub and Gitter. For teams running mission-critical infrastructure, the absence of official support or commercial SLAs adds operational risk.
Criteria for Suggesting Zipkin Alternatives
When recommending alternatives to Zipkin, we evaluated tools across the following seven criteria:
1. OpenTelemetry-Native Instrumentation
Tools that natively support and ingest OpenTelemetry traces, metrics, and logs without requiring proprietary agents or vendor lock-in.
2. Smart Sampling & Cost Efficiency
Support for dynamic sampling strategies (e.g., anomaly detection, latency-aware tail sampling) that help retain high-value traces while controlling storage costs.
3. Full MELT Observability
In addition to traces, the tool should support metrics, logs, events, errors, and user/session data to provide unified observability from backend to frontend.
4. Transparent & Scalable Pricing
Simple and predictable billing—especially for startups or mid-sized teams ingesting high volumes of telemetry (e.g., 10TB/month). Tools with opaque per-host or per-user billing structures are deprioritized.
5. UI/UX & Developer Experience
Modern, easy-to-use dashboards, rich querying (e.g., for logs and traces), high cardinality handling, and a smooth onboarding process.
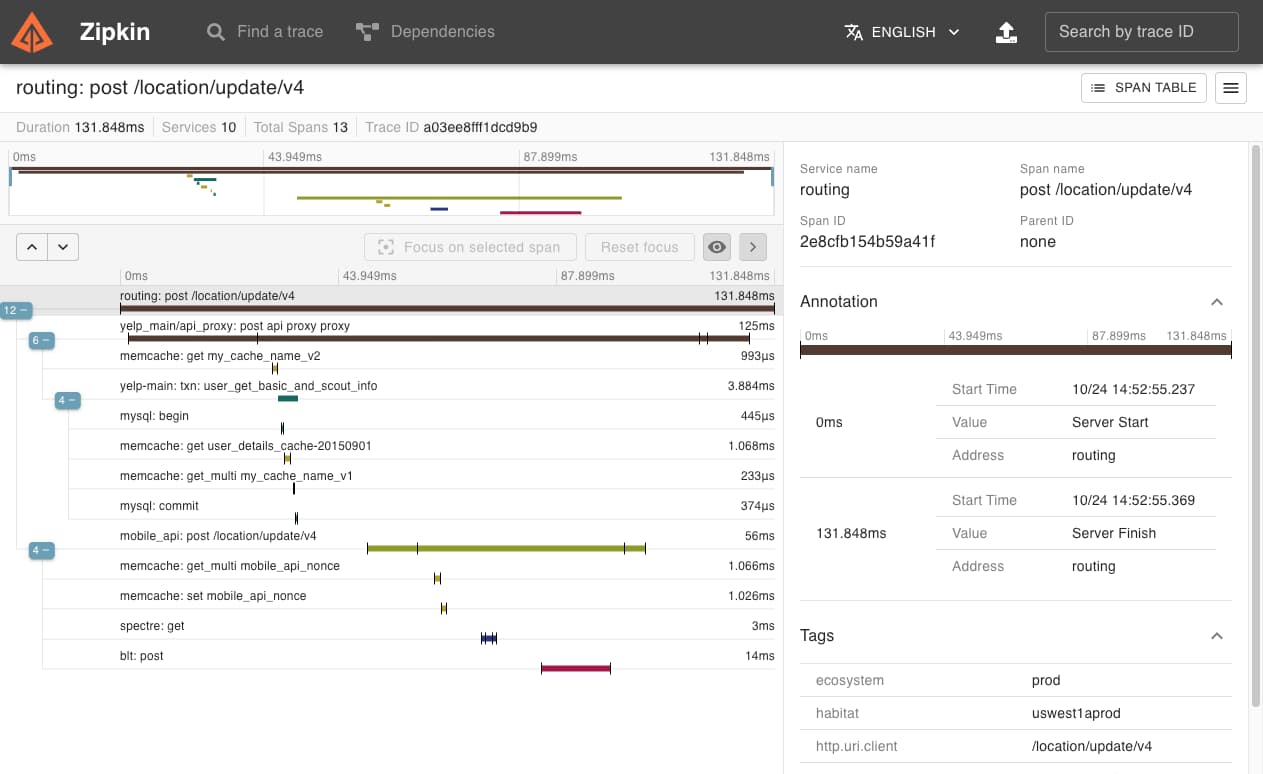
Zipkin Overview
Known For
Lightweight, open-source distributed tracing system used to track request flows across microservices and identify latency bottlenecks in backend systems.
Standout Features
- Simplicity and minimal setup overhead
- Support for multiple backends (MySQL, Elasticsearch, Cassandra, in-memory)
- Compatible with OpenTelemetry span ingestion
- Widely adopted in research, academic, and DIY tracing environments
Key Features
- Distributed tracing with basic search and dependency mapping
- OpenTelemetry and Brave instrumentation support
- Pluggable storage and transport layers
- Self-hosting with simple deployment (Docker, JAR, source)
- Web UI for trace visualization
Pros
- Free and open-source under the Apache 2.0 license
- Low resource overhead and fast to deploy
- Flexible storage and transport integrations
- Good for educational use and lightweight deployments
Cons
- Steep learning curve for new users
- Overwhelming UI that can hinder the usability of full features
Best For
Small teams, side projects, or research environments that only need basic tracing without complex compliance, alerting, or full-stack observability requirements.
Pricing & Customer Reviews
- Pricing: Free and open-source with no licensing fees. However, hidden costs arise in maintaining infrastructure, storage, and custom integrations.
- Rating: 4.8/5 rating on G2. While praised for ease of deployment and simplicity, reviews often mention its limited functionality and lack of native integrations compared to modern observability platforms.
Top 7 Zipkin Alternatives
1. CubeAPM
Known For
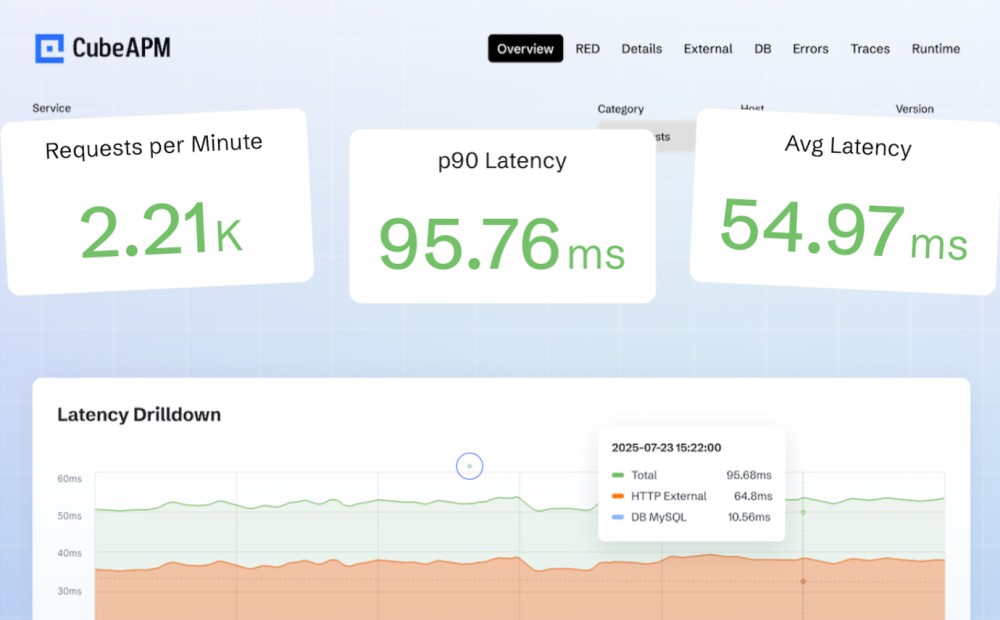
End-to-end OpenTelemetry-native observability platform offering full MELT (Metrics, Events, Logs, Traces) visibility with cost-efficient smart sampling and flexible deployment.
Key Features
- Smart Sampling for Trace Optimization: CubeAPM’s adaptive sampling retains high-value traces (e.g., slow transactions or error anomalies) while discarding noise—reducing storage by up to 70% without losing insight.
- Full MELT Stack Support: It supports distributed tracing, infrastructure metrics, logs, real user monitoring (RUM), synthetic checks, and error tracking—all in one unified platform.
- Compliance-Friendly Self-Hosting: CubeAPM allows organizations to deploy the platform within their own cloud or on-prem, making it ideal for teams needing data localization, low-latency, or air-gapped environments.
- High Compatibility: Fully compatible with OpenTelemetry, Prometheus, Datadog, New Relic, and Elastic agents, simplifying migration.
- Real-Time Alerting & Collaboration: Offers error inboxes, Slack/WhatsApp integration, and SLO-based alerting—features missing from Zipkin.
Standout Features
- Flat pricing at $0.15/GB with no host-based or per-user charges
- Native smart sampling engine
- 60%+ cost savings over Datadog and New Relic
- Extensive integration ecosystem, 80+ integrations
- Self-hosted and SaaS-ready
- Built-in RUM, logs, traces, and synthetics
Pros
- Predictable pricing and high telemetry volume support
- Native OpenTelemetry ingestion
- Lightning-fast trace search and retention at scale
- Friendly support (minute-level TAT via Slack/WhatsApp)
- Ideal for both startups and compliance-heavy enterprises
- No extra egress costs
Cons
- Not suited for teams looking for off-prem solutions
- Strictly an observability platform and does not support cloud security management
Best For
Teams migrating off open-source tools like Zipkin or Jaeger, and enterprises needing affordable, full-stack observability with data control.
Pricing & Customer Reviews
- Pricing: $0.15/GB for ingestion
- Rating: 4.8/5 (Based on feedback received from end-users on Slack)
CubeAPM vs Zipkin
CubeAPM is the best alternative to Zipkin for teams evaluating modern observability platforms built on OpenTelemetry. Zipkin is an open-source distributed tracing system, while CubeAPM is a full-stack observability platform designed to operate at scale with a more streamlined user experience and predictable pricing.
2. Dynatrace
Known For
Dynatrace is an AI-powered observability platform with strong automation capabilities across infrastructure, APM, logs, security, and user experience.
Key Features
- Davis AI Engine: Dynatrace’s proprietary AI engine (Davis) automates root cause analysis, anomaly detection, and dependency mapping across complex distributed systems.
- Full-Stack Observability: Provides deep telemetry from apps, infrastructure, containers, networks, logs, and real user sessions—all with automatic instrumentation.
- Code-Level Insights: Offers method-level tracing with PurePath technology, providing high granularity in transaction monitoring and service calls.
- Built-in Security Monitoring: Integrates application security analytics, vulnerability scanning, and runtime threat detection.
Standout Features
- Davis AI engine for auto-remediation and smart alerting
- PurePath for method-level tracing
- Deep Kubernetes and cloud-native integrations
- Strong enterprise-grade SLA and compliance
Pros
- Highly automated deployment and instrumentation
- AI-powered problem resolution
- Unified platform covering security and observability
- Rich dashboards and customizable analytics
Cons
- Expensive for large-scale telemetry ingestion
- Steeper learning curve for non-enterprise users
- Overwhelming UI especially for new users
Best For
Large enterprises with complex microservices environments looking for AI-assisted automation and built-in security with full-stack observability.
Pricing & Customer Reviews
- Infrastructure Monitoring: $29/mo/host
- Full-Stack Monitoring: $58/mo/8 GiB host
- Rating: 4.4/5 (G2)
Dynatrace vs Zipkin
Zipkin is an open-source distributed tracing system used to collect and visualise request traces across services. In contrast, Dynatrace is a commercial, full-stack observability platform that combines tracing with broader monitoring and automated analysis for large-scale environments.
3. New Relic
Known For
New Relic is a nified observability platform offering APM, infrastructure monitoring, RUM, logs, and dashboards in a single interface.
Key Features
- All-in-One Telemetry: Supports ingestion and visualization of logs, metrics, traces, and events within a unified Telemetry Data Platform (TDP).
- NerdGraph & Nerdpacks: Custom visualizations and automation via GraphQL APIs and modular apps, tailored to engineering workflows.
- Automatic Instrumentation: New Relic agents auto-instrument popular languages and frameworks, though some rely on proprietary formats.
Standout Features
- Unlimited user seats included in plans
- 100 GB free telemetry ingestion per month
- Interactive trace UI and service maps
- Dashboards with 300+ prebuilt integrations
Pros
- Powerful UI and query capabilities (NRQL)
- Broad telemetry coverage in one place
- Generous free tier for small teams
Cons
- Usage-based billing becomes expensive at scale
- Steep learning curve for advanced features
- Overwhelming UI for new users
Best For
Startups or mid-size companies looking for a broad observability suite with generous free tiers and ready-made dashboards.
Pricing & Customer Reviews
- Free tier: 100GB/month ingested
- Pro Plan: $0.40/GB ingested beyond the 100GB/month free limit
- Pro Plan: $349/month for full platform user
- Rating: 4.4/5 (G2)
New Relic vs Zipkin
While Zipkin provides basic open-source tracing, New Relic offers broader MELT observability and powerful dashboards—but at higher long-term costs. It’s better suited for teams needing turnkey observability out of the box.
4. Datadog
Known For
Datadog is a comprehensive cloud-native observability suite covering infrastructure, APM, logs, synthetics, and security.
Key Features
- Modular MELT Coverage: APM, logs, infrastructure, RUM, synthetics, and SIEM available in separate modules—each billed independently.
- Auto Instrumentation & Integrations: 900+ native integrations with cloud providers, databases, and orchestration tools (Kubernetes, ECS, etc.).
- Dashboards & Watchdog: AI-based alerting and Watchdog assistant for auto-detecting anomalies.
Standout Features
- Broadest integrations library in the market
- Powerful UI and customizable dashboards
- CI visibility, session replay, and mobile RUM
- Feature-rich and fast-growing ecosystem
Pros
- End-to-end visibility with enterprise reliability
- Strong community and documentation
- Flexible modular features
Cons
- High cost at scale with per-GB, per-user, per-host billing
- Costs also increase with the addition of features and data retention
- The UI complexity is challenging, making navigation difficult
Best For
Engineering-heavy organizations with budget flexibility that want a wide feature set and deep integrations.
Pricing & Customer Reviews
- APM (Pro Plan): $35/host/month
- Infra (Pro Plan): $15/host/month
- Ingested Logs: $0.10 per ingested or scanned GB per month
- Rating: 4.4/5 (G2)
Datadog vs Zipkin
Datadog far exceeds Zipkin in telemetry breadth and enterprise capabilities, but comes with unpredictable costs. Zipkin remains simpler but lacks Datadog’s observability depth.
5. Splunk AppDynamics

Known For
Splunk AppDynamics Enterprise-grade APM solution (now under Cisco) focused on business transaction monitoring, application performance diagnostics, and root cause analysis.
Key Features
- Business Transaction Monitoring: AppDynamics maps business-critical transactions and correlates them with backend service performance and database calls.
- Code-Level Diagnostics: Provides method-level trace visibility, database query insights, and real-time application dependency mapping.
- AI-Powered Anomaly Detection: Automatically flags baseline violations and correlates issues across infrastructure, applications, and end-user performance.
Standout Features
- Application maps with flow diagrams
- Baseline performance learning
- Integrated with Cisco network and security stack
- Enterprise-focused SLA and compliance
Pros
- Deep diagnostics for Java, .NET, and enterprise stacks
- Strong NOC-friendly dashboards
- Focus on aligning performance with business KPIs
Cons
- UI and configuration are complex and often require training
- Legacy UI and steep learning curve
- Pricing becomes expensive as environments grow
- Complicated licensing and cost structure
Best For
Enterprises that want detailed business transaction mapping and are already part of the Cisco ecosystem.
Pricing & Customer Reviews
- AppDynamics APM: starts at $33/month/CPU core
- Infra Monitoring: starts at $6/month/CPU core
- Rating: 4.3/5 (G2)
AppDynamics vs Zipkin
Zipkin is an open-source distributed tracing system used to collect and visualise request traces across services. In contrast, Splunk AppDynamics is a commercial application performance monitoring and observability platform that provides end-to-end performance insights, metrics, logs, and tracing with enterprise features such as business transaction monitoring and alerting.
6. Middleware
Known For
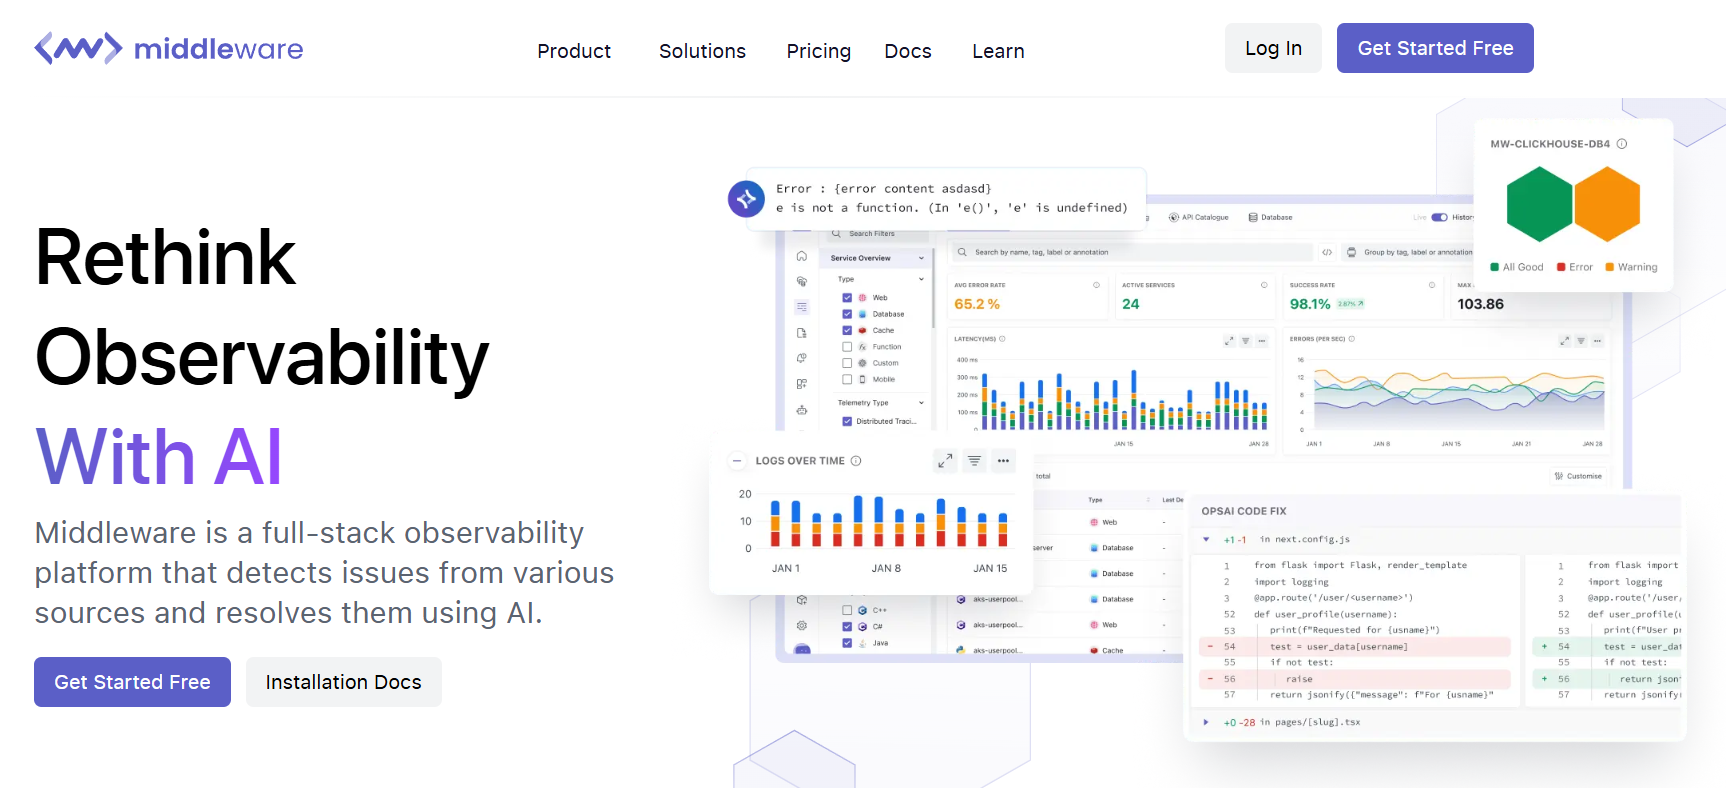
Middleware is an open-source, cloud-native observability platform focused on cost-effective full-stack monitoring for modern applications.
Key Features
- Modular Observability Suite: Covers metrics, logs, traces, synthetics, and uptime monitoring with native OpenTelemetry support.
- Transparent Pricing Model: Flat pricing per telemetry type, ideal for startups and scaling teams—significantly cheaper than Datadog.
- Easy Setup and Agentless Integrations: Auto-discovery, Prometheus compatibility, and fast onboarding make Middleware appealing for developer teams.
Standout Features
- OpenTelemetry-native from the ground up
- Affordable and transparent pricing
- Error tracking and synthetic checks built in
- Self-hosted and managed deployment options
Pros
- Predictable billing for high-ingestion workloads
- Open-source flexibility
- Fast trace and metric search
Cons
- Users have reported a steep learning curve to effectively use the features
- Manual integrations are challenging for users
- Users find the dashboards not intuitive and need more customization
Best For
Teams outgrowing Zipkin and seeking an open-source observability stack with predictable cost and broader feature coverage.
Pricing & Customer Reviews
- Free: upto 100GB data, unlimited users, 14-day retention
- Pay as you go: $0.3 GB of metrics, logs, traces; 30-day retention
- Custom pricing for scaling
- Rating: 4.7/5 (G2)
Middleware vs Zipkin
Zipkin is an open-source distributed tracing system used to collect and visualise request traces across distributed services. In contrast, Middleware is a commercial observability platform that provides application performance monitoring with integrated telemetry and a managed user experience aimed at simplifying production monitoring.
7. Grafana
Known For
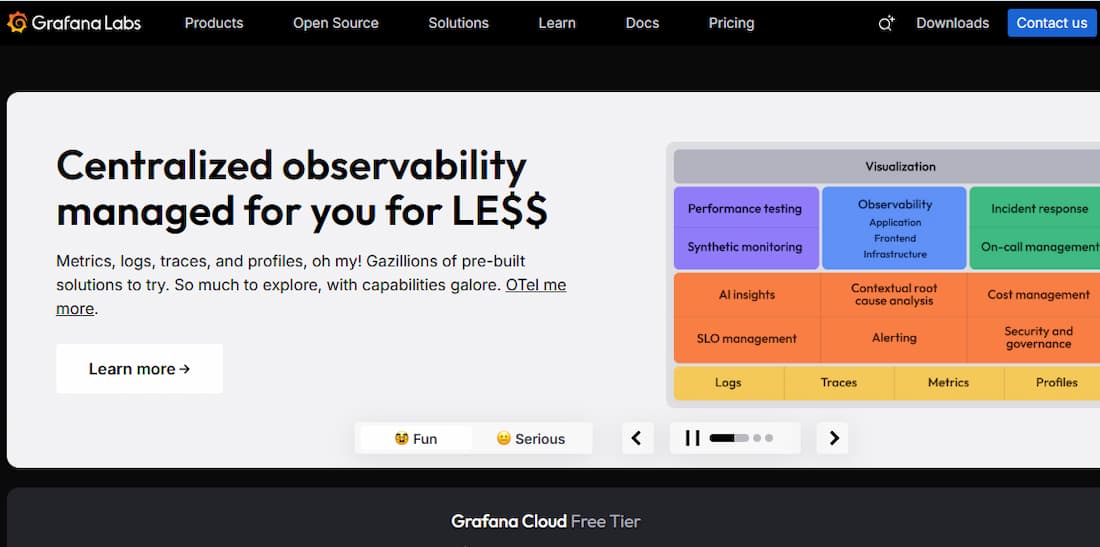
Grafana is a powerful open-source visualization platform, extended into full observability via Grafana Cloud (Loki, Tempo, Mimir).
Key Features
- Pluggable Visualization Framework: Custom dashboards and panels for metrics, logs, and traces, with support for Prometheus, Loki, Tempo, Elasticsearch, and more.
- Tempo for Distributed Tracing: Grafana Tempo provides scalable tracing storage and visualization with OpenTelemetry compatibility.
- Loki for Logs: A Prometheus-inspired log system that stores logs efficiently and correlates them with metrics and traces.
Standout Features
- Best-in-class dashboards
- Modular backends (Tempo, Loki, Mimir)
- Deep Prometheus integration
- Active open-source community
Pros
- Flexible and open architecture
- Excellent UI for trace and metric correlation
- Free to self-host with scalable pricing for cloud
Cons
- Steeper learning curve for non-technical teams
- Complex setup requirements
- Overwhelming UI
Best For
DevOps teams comfortable with open-source tools who want custom, composable observability with full control.
Pricing & Customer Reviews
- Grafana OSS: Free
- Pro plan: $19/month
- Metrics: $6.50/ 1k series
- Logs: $0.50/GB ingested
- Traces: $0.50/GB ingested
- Rating: 4.5/5 (G2)
Grafana vs Zipkin
Grafana, via Tempo, replaces Zipkin with better trace correlation, dashboards, and MELT integration. However, it requires managing multiple service backends, which might increase operational overhead.
Conclusion
Zipkin remains a solid tracing tool for basic distributed environments, but its limitations in MELT coverage, compliance, alerting, and UI usability make it hard to scale. Alternatives like CubeAPM, Datadog, New Relic, and Dynatrace offer broader observability with enterprise features—though often at a cost. Meanwhile, open-source and cost-effective options like Middleware and Grafana Tempo provide modern, OTEL-native pipelines with flexible deployments. Teams must weigh their needs—compliance, cost, feature breadth—before choosing the right observability stack.
Disclaimer: The information in this article reflects the latest details available at the time of publication and may change as technologies and products evolve.
FAQs
1. Why should teams move away from Zipkin?
While Zipkin is great for lightweight, basic tracing, it lacks full MELT observability, smart sampling, alerting, and compliance-ready features that are essential in modern production environments.
2. What are the best free or open-source alternatives to Zipkin?
Grafana Tempo, Middleware, and CubeAPM (self-hosted version) offer robust OpenTelemetry-native tracing with better visualizations and integrations than Zipkin.
3. Which alternative supports smart sampling to reduce costs?
CubeAPM is one of the few tools offering latency-aware Smart Sampling, cutting trace storage by up to 70% while keeping anomalies intact.
4. Can I self-host these tools in air-gapped or regulated environments?
Yes, tools like CubeAPM, Grafana Tempo, Zipkin, and Middleware support full self-hosting, making them ideal for data localization and compliance-sensitive setups.
5. Which tool is most cost-effective at scale?
CubeAPM and Middleware offer the most predictable and affordable pricing for 10TB+ ingestion workloads. In contrast, Datadog and New Relic often become cost-prohibitive without aggressive data trimming.


