Zabbix is a widely adopted open-source monitoring platform, known for its flexible architecture, agent-based and agentless monitoring, and extensive protocol support (SNMP, IPMI, JMX, etc.). However, many users find Zabbix’s setup complex and a steep learning curve, especially for beginners. In addition, it doesn’t yet support OpenTelemetry (planned release in 2026).
CubeAPM emerges as the best Zabbix alternative with native OpenTelemetry support, intuitive dashboards, and effortless self-hosting deployment. The platform also offers context-aware smart sampling to cut down costs while preserving insight-rich telemetry. In this article, we’ll explore the top Zabbix alternatives based on features, pricing, user feedback, and more.
Top 7 Zabbix Alternatives
- CubeAPM
- Datadog
- Dynatrace
- New Relic
- Grafana
- SolarWinds Observability
- LogicMonitor
Why People Are Looking for Zabbix Alternatives
Lack of Native OpenTelemetry (OTEL) Support
Zabbix does not yet support native ingestion of OpenTelemetry data (OTLP). Users can use a plugin, gRPC, to collect OpenTelemetry data (traces, logs, and metrics) into Zabbix. This is a workaround, not native functionality (InfluxData). Zabbix’s official public roadmap indicates that native OTEL support and observability enhancements are planned for the upcoming 8.0 LTS release, expected in Q2 2026.
Pricing Complexity
Zabbix is open-source and license-free, which makes it appealing at first glance. However, the real-world operational costs can differ, particularly for teams without deep in-house expertise in infrastructure monitoring and database tuning. It offers three types of plans:
- Zabbix On-Premise: Open-source and free
- Zabbix Cloud: A paid SaaS platform, starting from $50/month (for 50 NVPS) and can go beyond $5,000/month (10,000 VPS)
- Third-party Cloud: Allows self-hosting on your chosen cloud platform, such as AWS, Azure, GCP, etc. You will need to request a quote.
Now, the pricing complexity arises in Zabbix Cloud. The pricing varies based on the number of devices to monitor, the number of metrics to monitor per device, and storage size. This is not straightforward.
Steep Learning Curve & Complex Configuration
Zabbix offers deep flexibility but demands a high level of technical skill. Users consistently report a steep learning curve and setup complexity, involving intricate XML templates, manual alert rules, and extensive customization. They also find that the dashboards could be improved, and the UI does not feel very intuitive.
Criteria for Selecting Zabbix Alternatives
When evaluating modern observability platforms, teams rely on several core criteria:
1. Full MELT Observability Support
Modern observability demands native support for Metrics, Events, Logs, and Traces (MELT). Platforms that consolidate all four pillars into one interface reduce context switching, accelerate root-cause analysis, and eliminate the need for stitching together separate tools.
2. Native OpenTelemetry Compatibility
OpenTelemetry (OTEL) has become the de facto standard for telemetry data collection. Tools with built-in OTEL support offer easier instrumentation, better ecosystem integration, and freedom from vendor lock-in, crucial for long-term scalability.
3. Sampling & Cost Efficiency
Unlike Zabbix’s static data collection, modern APM tools leverage context-aware or tail-based sampling to retain meaningful data while minimizing costs. This enables teams to observe high-volume services without blowing up ingestion bills.
4. Cloud-Native & Kubernetes Readiness
Alternatives should seamlessly integrate with cloud platforms, Kubernetes, containers, and serverless functions. Native discovery, auto-scaling support, and built-in service maps are essential for dynamic, distributed systems.
5. Flexible Deployment & Compliance Options
In regulated sectors like finance or healthcare, vendors must support self-hosting, private VPCs, or air-gapped deployments. This ensures compliance with GDPR, HIPAA, and national data residency laws—something Zabbix struggles with at scale.
6. Intuitive UX & Automation
A modern observability tool should offer prebuilt dashboards, alert templates, low-code automation, and guided onboarding. This improves adoption across dev, ops, and SRE teams, unlike Zabbix’s manual-heavy, engineer-first UI.
7. Transparent, Scalable Pricing
Instead of unpredictable costs from consulting or third-party tools, the best alternatives offer straightforward usage-based pricing. Flat ingestion and transfer rates, bundled features, and no per-user billing make long-term planning easier and more affordable.
Zabbix Overview
Known for
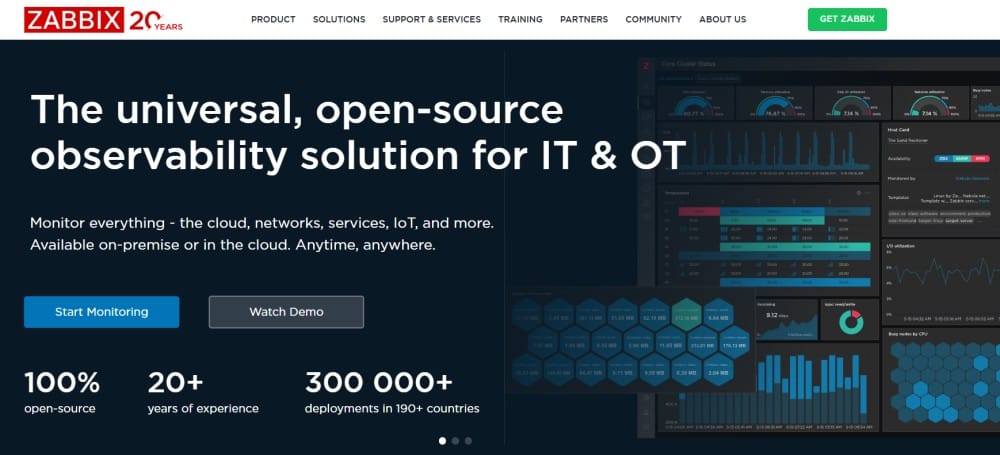
Zabbix is best known as a mature, open-source infrastructure monitoring platform focused on tracking network devices, servers, and applications. It supports both agent-based and agentless monitoring using SNMP, IPMI, JMX, and other protocols. With over 300,000 deployments worldwide, Zabbix remains a go-to solution for enterprises seeking on-premise control and flexibility in traditional IT monitoring environments.
Standout Features
- Highly Flexible Configuration: Offers custom templates, macros, and triggers to tailor monitoring setups for any infrastructure.
- Agentless Monitoring Support: Enables monitoring via standard protocols (SNMP, ICMP, HTTP, SSH, etc.) without installing agents.
- Advanced Alerting System: Customizable actions and escalation paths allow for precise control over incident responses.
- Auto-Discovery Capabilities: Automatically detects new devices and services within predefined network ranges or cloud zones.
Key Features
- Time-Series Data Storage: Collects and retains time-series data for historical trend analysis and forecasting.
- Built-in Visualization Tools: Provides native dashboards, maps, screens, and graphs for infrastructure health monitoring.
- Webhook & API Support: Allows integration with external systems and automation pipelines via JSON-RPC API.
- Low-Level Discovery (LLD): Automates monitoring of file systems, network interfaces, and SNMP items dynamically.
- Flexible Thresholds & Macros: You can define complex conditions and reusable macros to streamline alerting logic.
- Multi-Tenant Capabilities: Although true multi-tenancy is limited, Zabbix supports user roles and permission layers suitable for NOC environments.
Pros
- Open-source and free to use without licensing costs
- Strong SNMP, IPMI, and network monitoring capabilities
- Offers agentless monitoring for a wide variety of endpoints
- Highly customizable and flexible for experienced admins
- Supports on-premise deployment for full control over data
Cons
- Requires deep technical expertise for configuration and scaling
- UI is dated and not very intuitive
- Lacks native support for OpenTelemetry
Best for
Zabbix is best suited for teams with strong in-house infrastructure experience, especially in network or server monitoring. It serves well in air-gapped or compliance-heavy environments where open-source control and agentless monitoring are preferred. Ideal for organizations prioritizing flexibility and protocol-level visibility over plug-and-play observability features.
Pricing & Customer Reviews
- Free: Open-source license
- Zabbix Cloud: $50/month to $5,000/month
- G2 Rating: 4.4/5 (190+ reviews)
- Praised for: Customizability, depth of protocol monitoring, no licensing fees
- Criticized for: Outdated UI, complexity in setup, lack of OTEL support
Top 7 Zabbix Alternatives
1. CubeAPM

Known for
CubeAPM is a modern observability platform purpose-built for cost-efficient, OpenTelemetry-native monitoring across distributed systems. It is known for its intelligent sampling, full MELT coverage, and deployment flexibility, enabling teams to scale high-fidelity observability without spiraling data or compliance costs. With support for on-prem, cloud, and BYOC models, it suits both startups and regulated enterprises.
Standout Features
- Intelligent Smart Sampling: Automatically retains high-value traces based on latency, errors, and duration to maintain visibility while reducing ingest volume by up to 80%.
- Self-Hosting & BYOC Options: Teams can host CubeAPM in their own cloud, ensuring data residency, compliance (HIPAA, GDPR, RBI), and zero vendor lock-in.
- Agent Compatibility Across Ecosystems: Seamlessly connects with existing agents from Datadog, New Relic, Prometheus, and Elastic—no migration friction.
- Instant Setup & Slack-Native Support: Go live in under an hour with direct access to core engineers via Slack or WhatsApp, resulting in rapid MTTR and shorter onboarding time.
Key Features
- MELT Observability in One Platform: Capture and analyze metrics, events, logs, traces, synthetics, RUM, and errors in a unified dashboard.
- 100% OpenTelemetry Compliance: Native OTEL support with OTLP ingestion for all signals, streamlining instrumentation, and reducing vendor dependence.
- Predictable Ingestion-Based Billing: Transparent pricing model—$0.15/GB with no per-seat or per-host billing surprises.
- Real-Time Dashboards & Alerting: Prebuilt dashboards for infra, apps, Kubernetes, and DBs with dynamic alerting via Slack, PagerDuty, or webhooks.
- Enterprise Features Built-In: SSO, RBAC, audit logs, and multi-tenant support ensure production-grade access control and team collaboration.
Pros
- Fully OTEL-native with first-class support for all four MELT pillars
- Smart sampling reduces data ingestion while preserving observability
- Fast onboarding with <1 hour setup and real-time support from core devs
- Zero egress fees and no per-user licensing costs
- Self-hostable with flexible deployment for regulated industries
- 800+ integrations with plug-and-play agent compatibility
Cons
- Not suited for teams looking for off-prem solutions
- Strictly an observability platform, and does not support cloud security management
Best for
CubeAPM is a top choice for SREs, platform engineers, and DevOps teams working with cloud-native, containerized, or hybrid infrastructures. Its cost-efficiency, real-time support, and full MELT + OTEL coverage make it ideal for mid-to-large enterprises seeking modern observability without the operational bloat or licensing complexity of legacy tools.
Pricing & Customer Reviews
- Pricing: Starts at $0.15/GB for ingestion (includes infra, logs, traces, RUM, synthetics, error tracking)
- G2 Score: 4.7/5
- Praised for: Ease of onboarding, transparent pricing, enterprise-grade support
CubeAPM vs Zabbix
While Zabbix excels in SNMP and traditional infra monitoring, it lacks support for OpenTelemetry. CubeAPM delivers native OTEL support, an intuitive user interface, real-time support, and faster deployment. It’s also a fully self-hosting solution, whether you deploy it on your on-premise or cloud infrastructure to help you meet data residency requirements.
2. Datadog
Known for
Datadog is a popular SaaS-based observability and security platform built to monitor dynamic, multicloud environments. It’s especially recognized for its extensive out-of-the-box integrations and full-stack visibility—from infrastructure metrics and distributed tracing to real user monitoring and threat detection. DevOps and SecOps teams often rely on Datadog for unified insights across modern, containerized workloads.
Standout Features
- Massive Integration Ecosystem: Datadog offers over 900 native integrations across cloud services, databases, and orchestration tools, drastically reducing time to onboard.
- Notebooks for Incident Collaboration: Teams can correlate telemetry in real time using collaborative notebooks to perform structured root-cause investigations.
- Unified Observability + Security Stack: Combines APM, infrastructure monitoring, and security posture analysis into a single dashboard, ideal for DevSecOps workflows.
- Session Replay in RUM: Visualizes user sessions for frontend debugging, allowing teams to reproduce issues and fix UI regressions quickly.
- Advanced Serverless Coverage: Monitors serverless workloads like AWS Lambda and Azure Functions with low overhead and rich context on latency, cold starts, and errors.
Key Features
- Complete MELT Visibility in One Console: Brings together metrics, logs, traces, RUM, synthetics, and events for centralized monitoring.
- Automatic Agent-Based Instrumentation: Lightweight agents offer quick setup for common runtimes like Java, Go, Node.js, Python, and .NET.
- Cloud-Native by Default: Designed for Kubernetes, multicloud, and serverless architectures with native integrations into AWS, GCP, and Azure services.
- Security Telemetry Built-In: Vulnerability detection, compliance scanning, and workload protection come baked into the platform.
- CI/CD Contextualization: Ties deployments and code changes directly to telemetry anomalies using commit hashes and build metadata.
- Visual Dashboards & Role-Based Views: Offers customizable widgets and real-time status boards aligned with teams or services.
Pros
- 900+ integrations enable fast, low-touch onboarding
- Combines observability and security tools into one unified system
- Powerful dashboarding and data correlation tools for RCA
- Deep visibility into Kubernetes, containers, and serverless
- ML-based anomaly detection improves signal-to-noise ratio
Cons
- Expensive for smaller teams
- Lacks self-hosting or private deployment options; SaaS-only
Best for
Datadog is ideal for fast-scaling companies running modern architectures—like microservices or serverless—across cloud providers. Its deep integrations and combined observability/security tooling appeal to DevOps teams that want a powerful, all-in-one solution, provided they can manage cost variability and don’t require self-hosting.
Pricing & Customer Reviews
- Infrastructure Monitoring: $15–$34 per host/month
- APM: $31–$40 per host/month (annual); $36 on-demand
- Logs: $0.10/GB ingestion + $1.70 per million log events (15-day retention)
- Serverless Monitoring: $10 per million invocations
- Security Tools: $15–$40 per user/month
- G2 Rating: 4.4/5
- Praised for: Extensive integrations, powerful dashboards, and security observability in one UI
- Criticized for: High pricing, no on-prem/self-hosting hosting
Datadog vs Zabbix
While Zabbix is strong in agent-based infrastructure monitoring, Datadog provides a broader, cloud-native observability experience with full MELT coverage and deep integrations. However, Datadog could be expensive for smaller teams and less flexible for compliance-focused teams. This is where Zabbix shines with flexible deployment options and better cost-effectiveness.
3. Dynatrace
Known for
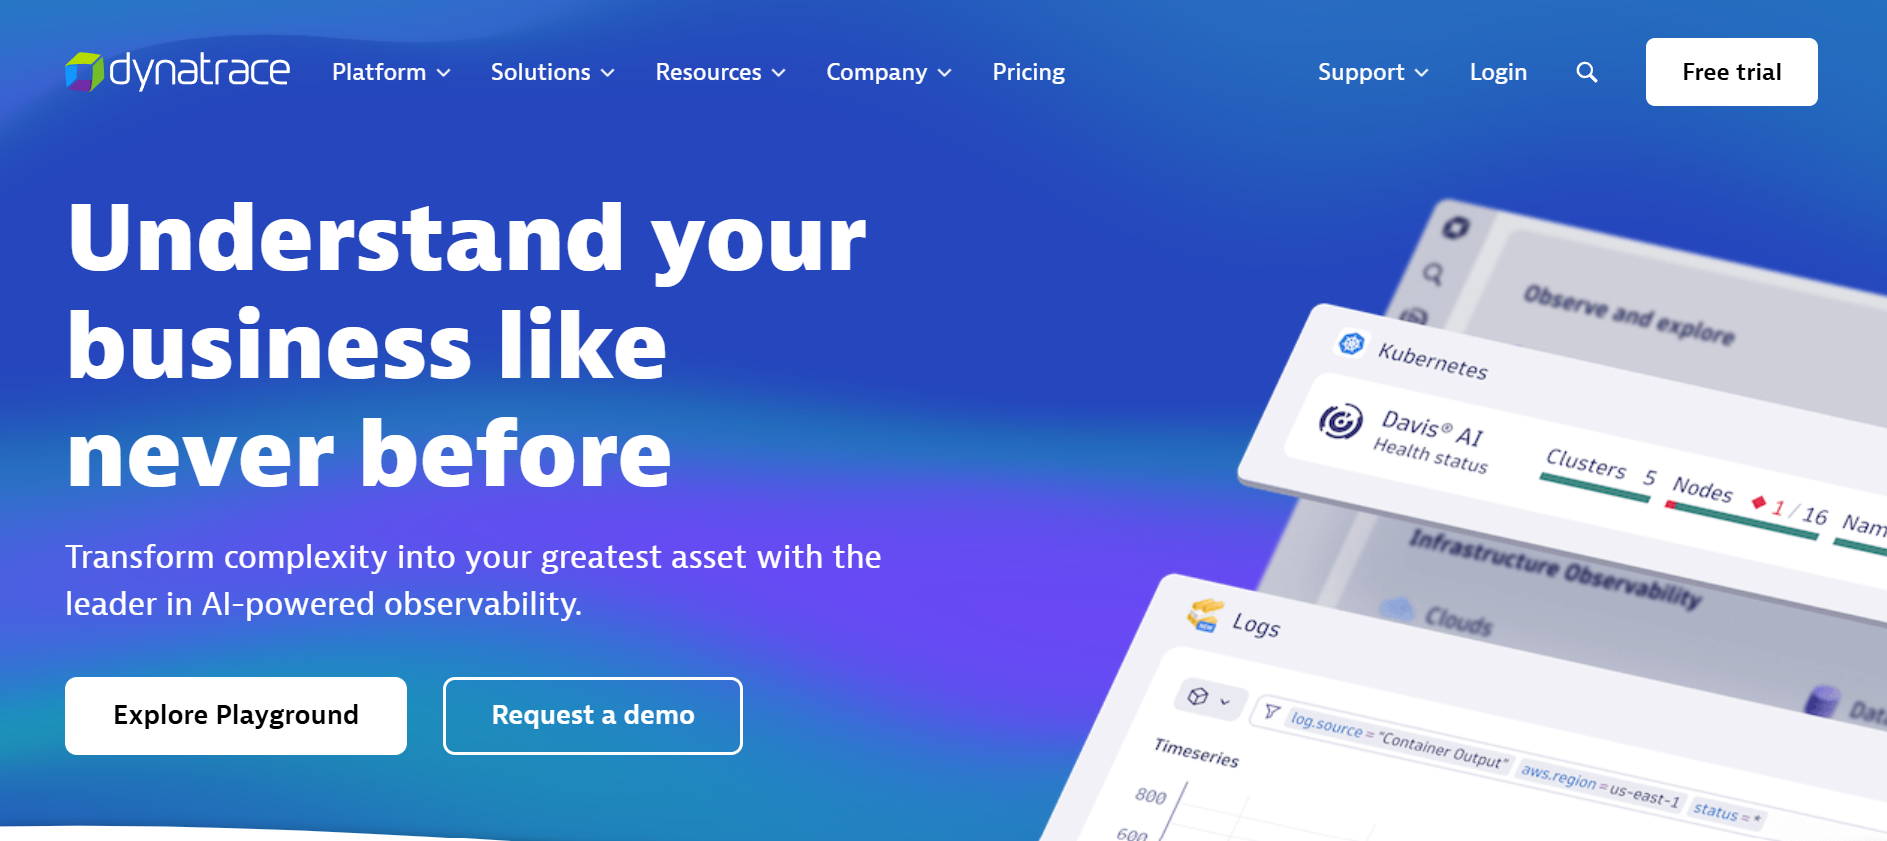
Dynatrace is a premium observability and application security platform built for large-scale, high-stakes environments. It’s recognized for delivering automated full-stack insights powered by AI, helping teams monitor, secure, and troubleshoot complex systems without manual correlation or tagging. Enterprises with distributed microservices and uptime-critical operations lean on Dynatrace for its automation and scalability.
Standout Features
- Dynamic Service Topology Mapping: Visualizes dependencies between services, infrastructure, and apps in real-time, streamlining root cause detection in sprawling systems.
- Davis AI Engine: Continuously processes telemetry across MELT signals, filtering noise and surfacing root causes automatically with no manual rules.
- Built-in Runtime Application Security: Offers real-time vulnerability detection through embedded RASP, without requiring separate agents.
- Unified End-User Experience Monitoring: Merges real user sessions and synthetic tests to deliver full visibility from frontend to backend.
- Zero-Touch Onboarding: Uses OneAgent to auto-discover services, APIs, containers, and cloud instances without additional instrumentation.
Key Features
- End-to-End MELT Coverage: Collects and correlates metrics, traces, logs, events, RUM, and synthetics with shared context.
- Agent-Based Auto-Discovery: OneAgent automatically maps dependencies across services, cloud resources, and databases.
- Frontend-to-Backend Tracing: Ties user-impacting issues back to specific infrastructure components or application code.
- Kubernetes & Cloud-Native Visibility: Deep insights into pods, nodes, and workloads, with native support for AWS, Azure, GCP, and OpenShift.
- App-Level Security Telemetry: Offers real-time threat detection and application-layer insights to merge performance and security workflows.
- Designed for Enterprise Scale: Supports massive multicloud environments with centralized policy enforcement and intelligent agent scaling.
Pros
- AI-powered diagnostics significantly reduce time to resolution
- OneAgent simplifies instrumentation across diverse architectures
- Combines observability and security without needing third-party tools
- Real-time dependency mapping enhances service-level incident triage
- Deep integration with cloud-native and legacy environments alike
Cons
- Costly for smaller teams
- Learning curve
Best for
Dynatrace is ideal for enterprise IT teams, platform engineers, and operations teams managing complex, high-scale infrastructures. It excels when automated discovery, AI-assisted root cause analysis, and security observability are top priorities, particularly for organizations that need centralized visibility across hybrid or multicloud environments.
Pricing & Customer Reviews
- Full-Stack Monitoring: $0.08 per 8 GiB host/hour
- Infrastructure Monitoring: $0.04 per host/hour
- Kubernetes Monitoring: $0.002 per pod/hour
- RUM: $0.00225 per session
- Synthetics: $0.001 per HTTP test
- App Security Module: $0.018 per 8 GiB host/hour
- G2 Rating: 4.5/5
- Praised for: Automated incident triage, powerful AI analytics, and hybrid cloud visibility
- Criticized for: High pricing, complexity for new users
Dynatrace vs Zabbix
Dynatrace brings automated, AI-powered observability and security in a single platform. It eliminates the need for stitching together tools, delivering rapid diagnostics and deeper system context. However, it can be costly for smaller teams. Zabbix is more cost-effective.
4. New Relic
Known for
New Relic is a SaaS-based observability platform tailored for developers and SREs managing complex, microservices-driven applications. It enables full-stack visibility through MELT telemetry, powerful querying with NRQL, and highly customizable dashboards. Its low-friction onboarding and strong CI/CD integrations make it especially attractive for cloud-native teams seeking fast setup and real-time insights.
Standout Features
- Service Topology Explorer: Automatically maps infrastructure, services, and container dependencies for better visibility across distributed systems.
- Real-Time NRQL Analytics: Your team can write expressive queries to analyze logs, metrics, and traces interactively using its proprietary query language.
- Machine Learning Anomaly Detection: Proactively detects unusual changes in throughput, latency, or error rates using behavioral baselines.
- Flexible Dashboarding Engine: Enables teams to create customized, role-based dashboards with reusable widgets for executive reporting.
- Rapid SaaS Activation: Requires minimal infrastructure changes—installing agents gets teams live within minutes.
Key Features
- All-in-One MELT Platform: Collects metrics, logs, traces, events, RUM, and synthetics in one unified interface with cross-signal correlation.
- Automatic Language Instrumentation: Supports Java, Node.js, Python, Go, Ruby, and .NET with quick setup for backend observability.
- Cloud & DevOps Integrations: Connects seamlessly to AWS, GCP, Azure, GitHub, Jenkins, and Kubernetes, tying performance data to CI/CD workflows.
- Frontend + Synthetic Monitoring: Combines user journey tracking and scripted test flows to identify frontend regressions.
- AI-Guided Alerting: Dynamically adjusts alert thresholds based on historical patterns to reduce noise and false positives.
Pros
- NRQL enables highly detailed telemetry exploration
- Dashboards are easy to tailor for both technical and business users
- Fast SaaS onboarding with minimal engineering effort
- Visual service maps simplify navigation in large microservices environments
- Strong DevOps toolchain integrations enhance release monitoring
Cons
- No option for self-hosting or on-premise deployment
- Expensive; pricing adds up quickly with ingestion volume, user tiers, and add-ons
Best for
New Relic works best for developer-led teams and platform engineers in cloud-native organizations that value fast deployment, precision analytics, and customizable observability. It’s ideal for SaaS-first companies needing deep telemetry insights around deploy cycles and production health, but less suited for teams requiring on-prem hosting or budget constraints.
Pricing & Customer Reviews
- Free: 100 GB/month ingestion + 1 core user
- Ingestion: $0.40 per GB (based on retention and plan)
- Core Users: $49/user/month
- Full Platform Users: $349/user/month
- G2 Rating: 4.4/5
- Praised for: Dashboard flexibility, fast setup, and NRQL’s analytical power
- Criticized for: Lack of self-hosting, high pricing
New Relic vs Zabbix
While Zabbix caters to infrastructure-centric monitoring with flexible templates and protocol support, New Relic excels in modern, developer-friendly observability. It offers sophisticated analytics, anomaly detection, and cloud integrations out of the box. However, teams prioritising self-hosting or with budget constraints may find New Relic less suitable than Zabbix.
5. Grafana

Known for
Grafana is a popular open-source visualization and observability tool known for its modular architecture, OpenTelemetry compatibility, and rich customization options. It provides the flexibility to build tailored dashboards and ingest telemetry from various open-source backends like Prometheus, Loki, and Tempo, making it a go-to choice for engineering teams who want full ownership of their observability stack.
Standout Features
- OpenTelemetry-Compatible Dashboarding: Grafana supports seamless visualization of OTEL-compliant data from Prometheus (metrics), Loki (logs), and Tempo (traces), enabling real-time, cross-signal insights.
- Integrated Loki & Tempo Engines: Built-in log and trace backends allow teams to analyze distributed telemetry without leaving the Grafana UI.
- Flexible Hosting Options: Grafana can be deployed on-premise, in private cloud, or through Grafana Cloud for fully managed observability.
- Comprehensive Alerting Stack: Includes multi-channel alert routing, deduplication, silence rules, and integration with Grafana OnCall for incident management.
- Strong Plugin Ecosystem: Offers access to a growing marketplace of plugins and dashboards to support varied data sources like PostgreSQL, InfluxDB, Kubernetes, and AWS.
Key Features
- Time-Series Visualization Engine: Allows creation of dynamic charts, heatmaps, and gauges to track performance trends over time.
- MELT Observability Support: Integrates with open-source tools like Prometheus, Loki, and Tempo for ingesting metrics, logs, and traces.
- Deployment Flexibility: Available as a free OSS edition or scalable cloud/enterprise versions with support and SLAs.
- RBAC for Access Control: Enables granular permissions to manage who can view or edit dashboards, aligned with team roles.
- Drag-and-Drop Alert Builder: Simplifies alert setup with a visual interface and integrations with tools like Slack, PagerDuty, and webhooks.
Pros
- Completely open-source with broad community adoption
- Native support for OTEL data pipelines and telemetry standards
- Versatile deployment—self-hosted, cloud-managed, or hybrid
- Exceptional dashboarding and visualization capabilities
- Wide plugin library to connect to nearly any telemetry source
Cons
- Complex setup
- Community support in the open-source tier; tiered support in Grafana Cloud
Best for
Grafana is best suited for DevOps, SREs, and platform engineers who prefer a hands-on approach to observability and value vendor-neutral, open-source tools. It’s ideal for teams already managing telemetry collectors like Prometheus or Loki and who want full control over data storage, retention, and dashboarding without relying on bundled SaaS platforms.
Pricing & Customer Reviews
- Grafana OSS: Free and self-managed
- Grafana Cloud (Free Tier): Includes 10K active series and 50 GB/month log ingestion
- Pro Plan: Starts at $19/month
- Enterprise Plan: Custom pricing based on usage and support levels
- G2 Rating: 4.5/5
- Praised for: Advanced visualizations, flexible deployment options, and a strong open-source community
- Criticized for: Complex setup
Grafana vs Zabbix
Zabbix offers infra monitoring with traditional dashboarding, whereas Grafana brings deep flexibility in visualization, open-source extensibility, and OTEL-native compatibility. While Grafana requires users to manage telemetry backends like Prometheus or Tempo, it offers far more control and customization, ideal for teams looking to modernize observability while staying vendor-neutral.
6. SolarWinds Observability
Known for
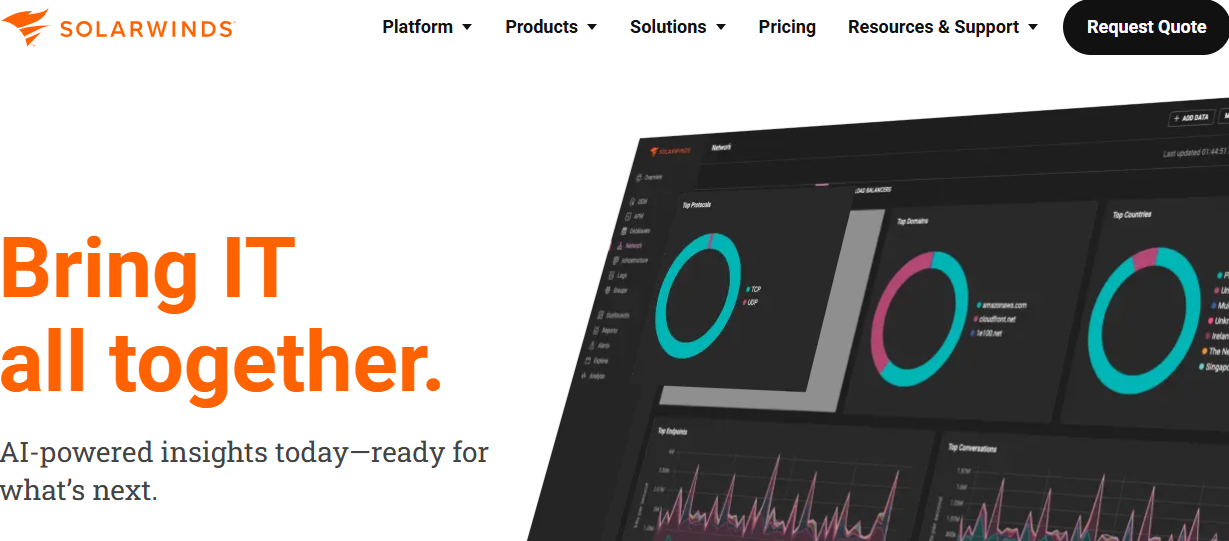
SolarWinds Observability delivers full-stack visibility across infrastructure, applications, networks, databases, and end-user experience through AIOps-powered analytics. It’s widely adopted by organizations managing hybrid or on-prem systems seeking centralized monitoring and root-cause diagnosis across diverse environments.
Standout Features
- Unified Hybrid Visibility: Brings together infrastructure, application, database, log, and network telemetry into a single console for streamlined troubleshooting.
- Built‑in AIOps and Anomaly Detection: Leverages machine learning to surface anomalous behavior, reduce alert noise, and suggest potential root causes.
- Dashboards & Asset Explorer: Centralized dashboards and asset mapping help users navigate complex hybrid IT with ease.
- Modular Licensing Model: Users can subscribe separately to application observability, infra monitoring, log, database, or real-user monitoring modules per service or host.
Key Features
- MELT Observability Pipeline: Enables correlation across metrics, logs, events, traces, RUM, and synthetic checks via shared timelines and metadata.
- AIOps-Powered Analysis: Automated anomaly detection and event clustering help reduce noise and identify issues faster.
- Role-Based Dashboards & Reporting: Custom views allow teams to configure dashboards per service, environment, or organizational role.
- Flexible Deployment: Available as SaaS or self-hosted node‑based editions with volume discounts and enterprise SLAs.
- Broad Environment Support: Covers on-prem, cloud, network devices, containers, and DB instances with tailored telemetry collection.
Pros
- Visualizations and correlation are praised for ease and depth
- All-in-one dashboard unifies diverse telemetry signals under one UI
- AIOps features filter noise and speed root‑cause workflows
- Rich network-device & database support
- Highly modular pricing
Cons
- Inefficient alerts
- Learning curve
Best for
SolarWinds Observability is best suited for organizations managing hybrid enterprise environments, especially those with significant legacy infrastructure, networks, or databases. It works well for teams seeking modular observability and AIOps-driven analysis in a unified SaaS or self-hosted solution, provided they can accommodate higher cost and setup complexity.
Pricing & Customer Reviews
- Application Observability: from $27.50/app instance/month
- Infra & Network Monitoring: from $12/host or device/month
- Log Ingestion: approx. $5 per GB/month
- Database Monitoring: from $70/db instance/month
- Synthetic Tests: around $10 per 10 uptime checks
- G2 Rating: 4.3/5 (793 reviews)
- Praised for: centralized dashboards, hybrid environment visibility, modular flexibility
- Criticized for: Complexity during setup
SolarWinds vs Zabbix
Zabbix delivers flexible, free infrastructure monitoring but lacks native support for logs, tracing, anomaly detection, and unified AIOps workflows. SolarWinds brings richer multi-signal capability, built-in intelligence, and modern dashboards—but at significantly higher cost and operational complexity.
7. LogicMonitor
Known for
LogicMonitor is a cloud-native hybrid observability platform celebrated for its automated discovery, AI-enriched alerting, and deep visibility into infrastructure, networks, applications, and user experiences. It excels in giving teams a unified view of multicloud and on-prem environments through a SaaS model powered by real-time intelligence.
Standout Features
- Automatic Hybrid Discovery: Collectors automatically detect assets across networks, cloud services, and containers with minimal configuration.
- AI‑Driven Event Correlation: Edwin AI clusters and suppresses alerts, surfaces relevant anomalies, and highlights root causes proactively.
- Single Pane Observability Interface: Consolidates telemetry from cloud, legacy, container, and network sources into shared dashboards.
- Modular Monitoring Catalog: Cover infrastructure, apps, DBs, logs, or RUM in selectable modules rather than a monolithic package.
Key Features
- Comprehensive MELT Pipeline: Correlates metrics, logs, events, traces, RUM, and synthetic checks using unified metadata.
- Real-Time Dashboards & Baselines: Enables dynamic visualization and performance baselining for proactive detection.
- Predictive AI & Automation: Machine learning capabilities anticipate failures and reduce alert noise.
- Role-Based Reporting & Access: Supports tailored dashboards and RBAC-based permissions per team or use case.
- Third-Party Integration Library: Leverages over 3,000 integrations with infrastructure and service providers.
Pros
- Ease of setup and multi-site performance monitoring
- Unified visualization across hybrid and cloud-native environments
- AI-assisted anomaly detection and event grouping reduce operational noise
- Excellent for infrastructure-heavy and legacy-driven IT estates
- Pricing flexibility via modular licensing aligns with actual observability usage
Cons
- UI poor or may feel dated or cluttered
- Learning curve
Best for
LogicMonitor is ideal for mid‑to‑large enterprises and MSPs managing diverse hybrid infrastructures. It particularly suits operations or platform teams seeking automated asset discovery, AI-powered observability, and modular monitoring for infrastructure-rich environments, provided they can handle complexity and modular pricing.
Pricing & Customer Reviews
- Infra monitoring: $22 per resource per month
- Cloud IaaS monitoring: $22 per resource per month
- Cloud PaaS & container monitoring: $3 per resource per month,
- Wireless Access Point: $4 per resource per month
- Logs: ($2.5-$7) per GB/month
- G2 Rating: 4.5/5 with (500+ reviews)
- Praised for: Hybrid visibility, intelligent alerting, and extensive platform modularity
- Criticized for: Rising costs as telemetry scales, onboarding complexity, and inconsistent support
LogicMonitor vs Zabbix
Zabbix offers trusted open-source infrastructure monitoring with agentless SNMP and protocol support. LogicMonitor extends far beyond by combining observability, AI‑driven insights, and hybrid telemetry in one SaaS solution. While Zabbix remains easier to adopt for small-scale infra monitoring with no licensing fees, LogicMonitor delivers powerful automation and multi-signal visibility, making it compelling for teams managing complex or cloud-integrated systems.
Conclusion: Choosing the Right Zabbix Alternative
While Zabbix continues to be a dependable open-source solution for traditional infrastructure monitoring, its limitations, such as a lack of native OpenTelemetry support, outdated UI, and a steep learning curve, make it harder for modern DevOps and SRE teams to troubleshoot efficiently and scale confidently.
CubeAPM stands out as the most future-ready and cost-effective Zabbix alternative. Built from the ground up to support OpenTelemetry natively, smart sampling to control ingest costs, a self-hosting option, and a blazing-fast setup that gets teams live in under an hour. Book a free demo with CubeAPM today.
Disclaimer: The information in this article reflects the latest details available at the time of publication and may change as technologies and products evolve.
FAQs
1. What are the main limitations of Zabbix that lead users to consider alternatives?
Zabbix is powerful for infrastructure and network monitoring, but it lacks native support for OpenTelemetry. It also requires manual configuration and has a dated UI, and a steep learning curve.
2. Is there a modern, OpenTelemetry-native alternative to Zabbix?
Yes, CubeAPM is a fully OpenTelemetry-compliant observability platform that offers native support for metrics, logs, traces, events, synthetics, and RUM—all in a single dashboard. It provides real-time visibility, intelligent sampling, and compliance-friendly hosting models (on-prem or BYOC).
3. Which Zabbix alternative is best for cost-conscious teams?
CubeAPM offers transparent, usage-based pricing at $0.15/GB, with no hidden user or host fees. Compared to platforms like Datadog or Dynatrace, which often charge per module or seat, CubeAPM helps teams achieve high observability coverage without overspending.
4. Can I self-host a Zabbix alternative that’s still modern and feature-rich?
Yes. Unlike most cloud-first vendors, CubeAPM supports on-premise and bring-your-own-cloud (BYOC) deployments. This makes it ideal for organizations with strict compliance, data residency, or internal hosting requirements.
5. Which Zabbix alternatives offer full MELT support?
Platforms, like CubeAPM, offer full MELT (Metrics, Events, Logs, Traces) observability. However, CubeAPM is one of the few that combines full MELT support with native OpenTelemetry, flexible hosting, and pricing transparency.


