AppSignal is a full-stack observability platform that unifies error tracking, performance monitoring, logs, metrics, uptime checks, and host monitoring in a single interface. It’s appreciated for its simple setup and usage-based pricing, although some users find the interface overwhelming and the cost high, especially when data volumes grow.
CubeAPM is a strong alternative to AppSignal, offering unified observability across metrics, logs, traces, RUM, synthetics, and errors with a transparent usage-based pricing model. It supports OpenTelemetry, offers flexible self-hosted or BYOC deployments, and provides teams with greater control over data, scalability, and long-term costs.
In this article, we break down the top 7 alternatives to AppSignal in 2025, comparing tools based on metrics ingestion efficiency, sampling strategy, pricing transparency, MELT coverage, and OpenTelemetry support.
Top 7 AppSignal Alternatives
- CubeAPM
- Datadog
- New Relic
- Coralogix
- Grafana
- Sentry
- Dynatrace
Why Look for AppSignal Alternatives?
AppSignal is a robust application performance monitoring (APM) tool tailored for Ruby, Ruby on Rails, Elixir, Node.js, Python, and JavaScript, offering features like error tracking, performance monitoring, host metrics, and log management. However, several limitations drive developers and businesses to seek alternatives. Below are the key reasons to explore AppSignal alternatives, supported by direct user quotes and critical analysis.
1. High Costs as Usage Grows
AppSignal’s pricing is based on defined request-volume tiers, and as your application traffic grows, you may need to move into higher plan tiers with larger request limits. This can make cost planning more important for teams with rapidly increasing traffic or unpredictable load patterns, even with AppSignal’s relaxed upgrade policy and predictable billing structure.
2. Overwhelming and Cluttered User Interface
AppSignal’s user interface can feel cluttered and unintuitive due to the dense presentation of options and functionalities. This makes it challenging for users to quickly locate specific features or interpret data efficiently, reducing productivity and increasing the learning curve for teams. A cluttered UI is particularly problematic for developers needing actionable insights under time constraints, as it can obscure critical performance or error data.
Criteria for Evaluating Alternatives to AppSignal
When assessing alternatives to AppSignal, we considered a blend of technical, operational, and financial factors through an in-depth feature comparison. Our evaluation criteria include:
1. OpenTelemetry & Prometheus Compatibility
Prioritized tools with strong support for OTEL and Prometheus were a key factor. Tools such as CubeAPM, Grafana Cloud, and Coralogix excelled in this area.
2. Cost-Effectiveness & Transparent Pricing
We favored alternatives offering flat or usage-based pricing, transparent data retention policies, and no additional charges for users.
3. Comprehensive MELT Stack Support
An ideal APM solution should support the entire MELT stack—Metrics, Events, Logs, and Traces. We selected tools capable of monitoring everything from infrastructure to RUM (Real User Monitoring) and synthetic tests.
4. Ease of Setup & Operational Simplicity
APM solutions offering quick onboarding, user-friendly UI/UX, and minimal agent deployment were given preference. Tools like CubeAPM and Dynatrace stood out for their simplicity.
5. Collaboration & Integration
We emphasized the importance of integrations with popular tools like Slack, Jira, PagerDuty, and GitHub Actions to optimize incident management and streamline DevOps workflows.
AppSignal Overview
Known For
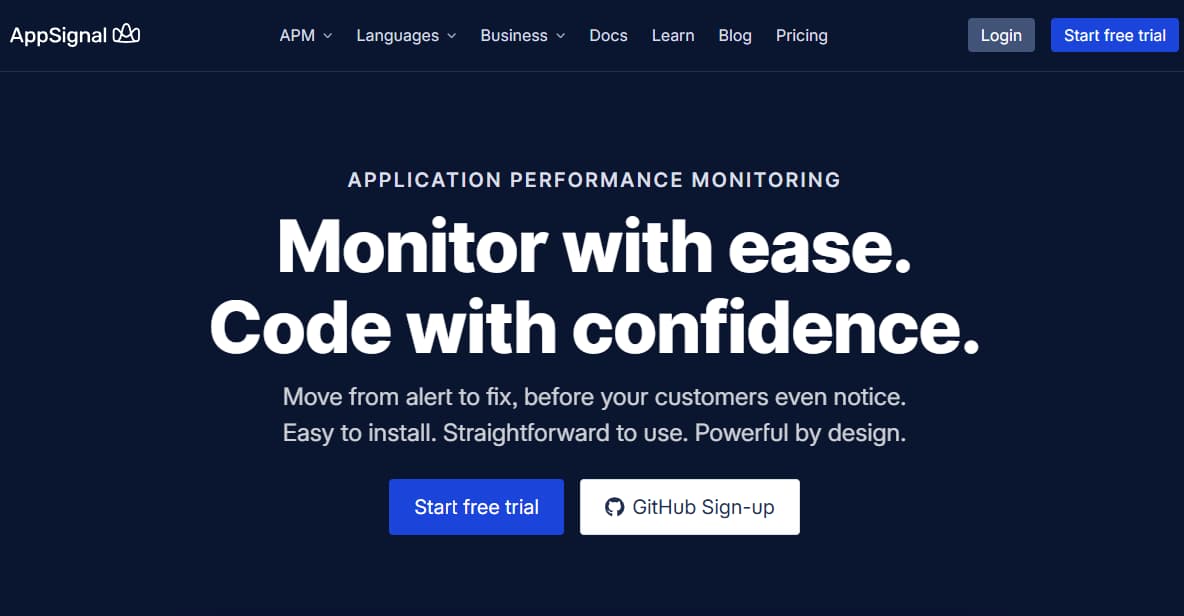
AppSignal is recognized for its seamless integration with Ruby on Rails, Elixir Phoenix, Node.js, Python, and JavaScript applications. It provides a unified platform for performance monitoring, error tracking, and log management, catering to developers seeking an intuitive and efficient observability solution.
Standout Features
- Automated Dashboards: Pre-configured dashboards for frameworks like Ruby on Rails, Elixir Phoenix, Node.js, and more.
- Real-Time Error Tracking: Instant alerts for application errors with detailed stack traces.
- Performance Monitoring: Insights into request durations, throughput, and bottlenecks.
- Log Management: Integrated log viewing alongside performance metrics.
- Uptime Monitoring: Global checks to ensure application availability.
Key Features
- Anomaly Detection: AI-driven insights to identify performance deviations.
- Custom Metrics: Ability to define and monitor application-specific metrics.
- Deployment Tracking: Monitor the impact of code changes on application performance.
- Host Monitoring: Track server health and resource utilization.
- Integrations: Supports integration with tools like Slack, Jira, and GitHub
Pros
- Ease of Use: High user satisfaction with ease of use
- Comprehensive Monitoring: Offers a full-stack observability solution.
- Developer-Friendly: Tailored for developers with minimal configuration required.
- Responsive Support: Users report excellent customer support
Cons
- Overwhelming UX/UI that hinders usability for beginners
- High costs, especially for high traffic
Best For
Small to mid-sized development teams using Ruby, Elixir, Node.js, Python, or JavaScript, seeking an all-in-one APM solution with a focus on simplicity and developer experience.
Pricing & Customer Reviews
- Logging is free for the first 1GB/month
- APM: $25 for 250K requests/month
- Enterprise SAML SSO ($ 449 per month)
- Long-term log storage ($ 89 per month)
- HIPAA Compliance ($ 89 per month)
- G2 Rating: 4.8/5
Top 7 AppSignal Alternatives
1. CubeAPM

Known For
CubeAPM is known for its OpenTelemetry-native observability platform that delivers full-stack MELT (Metrics, Events, Logs, Traces) monitoring with a focus on cost efficiency, smart sampling, and compliance-friendly deployment options.
Key Features
- OpenTelemetry-First Instrumentation: CubeAPM natively supports OTEL from the ground up, making it easy to integrate across modern microservices environments without vendor lock-in.
- Full MELT Coverage: Offers complete visibility into logs, metrics, traces, events, RUM, and synthetics, all within a unified dashboard—removing the need for stitching together separate tools.
- Smart Sampling & Cost Control: Utilizes intelligent tail-based and dynamic sampling strategies to reduce data volume while preserving anomaly-rich traces—resulting in up to 70% cost savings compared to ingestion-based models like AppSignal or Datadog.
- Self-Hosted or SaaS Deployment: CubeAPM supports flexible deployment across on-prem, air-gapped, VPC-hosted, or multi-cloud setups, making it ideal for compliance-sensitive organizations.
Standout Features
- Flat-rate pricing at $0.15/GB data ingested
- Real-time dashboards with low-latency querying and high cardinality support
- Built-in SLO-based alerting and incident routing workflows
- Native RUM and Synthetics—unlike AppSignal, which lacks both
Pros
- Transparent, predictable pricing
- 800+ integrations
- No extra egress costs
- OTEL-native, no vendor lock-in
- Excellent performance at scale
- Developer-friendly dashboards and API access
Cons
- Not suited for teams looking for off-prem solutions
- Strictly an observability platform and does not support cloud security management
Best For
Startups, mid-size teams, and enterprises seeking scalable observability without the high cost or compliance limitations of AppSignal.
Pricing & Customer Reviews
- Data ingestion pricing of $0.15/GB with no per-user fees.
- Rating: 4.7/5 — praised for pricing clarity, OTEL support, and easy setup.
CubeAPM vs AppSignal
While AppSignal provides an integrated observability experience with a focus on simplicity, CubeAPM delivers broader full-stack coverage, including logs, metrics, traces, RUM, and synthetics under a single usage-based model. CubeAPM also supports OpenTelemetry and flexible self-hosted or BYOC deployments, making it better suited for teams that need greater control, scalability, and deployment flexibility.
2. Datadog
Known For
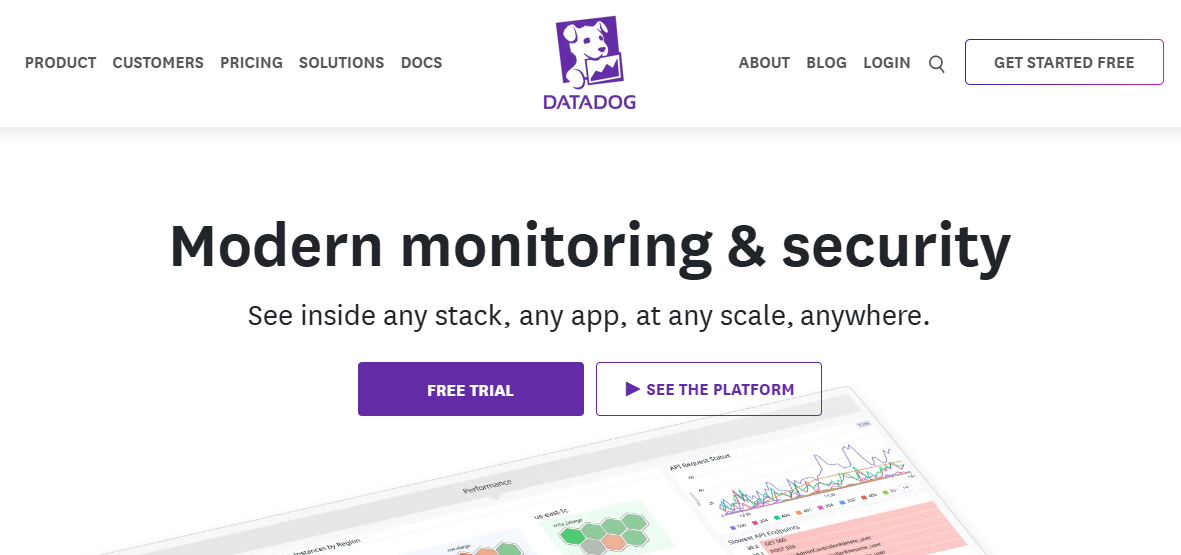
Datadog is a widely adopted enterprise observability platform known for its comprehensive monitoring across infrastructure, applications, logs, and security signals. It’s heavily used in Kubernetes, multi-cloud, and large-scale production environments.
Key Features
- Infrastructure Monitoring: Out-of-the-box support for over +900 integrations (AWS, Kubernetes, Docker, Azure, etc.) with auto-discovery and system-level visibility.
- Application Performance Monitoring (APM): End-to-end tracing with flame graphs, service maps, and latency breakdowns. Datadog supports custom instrumentation, but is not OTEL-native—OTEL support requires translation layers.
- Log Management & Indexing: Advanced log ingestion pipelines with filtering, archival, and log rehydration. However, logs are priced based on volume indexed and retained, which can spike costs rapidly.
- Dashboards & Querying: Highly customizable dashboards and drag-and-drop widgets, though complexity increases steeply with usage scale and team size.
- Security & Compliance Monitoring: Combines observability with security analytics, including runtime security, compliance scans, and threat detection.
Standout Features
- Integrated security telemetry (cloud SIEM, CWS, CSPM)
- Live tailing of logs and real-time anomaly detection
- Network monitoring and database performance analytics
- Synthetics, RUM, CI visibility, and Session Replay (all separate modules)
Pros
- All-in-one observability with enterprise scalability
- Rich ecosystem of integrations
- SLOs, alerting, and team-based incident workflows
- Granular RBAC and enterprise compliance certifications
Cons
- Users encounter a steep learning curve required to effectively utilize Datadog’s features.
- Expensive, especially when scaling.
- Costs also increase with the addition of features and data retention.
- The complexity is challenging, making navigation difficult.
Best For
Large enterprises or teams already embedded in the Datadog ecosystem, especially those needing combined observability + security monitoring.
Pricing & Customer Reviews
- APM (Pro Plan): $35/host/month
- Infra (Pro Plan): $15/host/month
- Ingested Logs: $0.10 per ingested or scanned GB per month
- G2 Rating: 4.3/5 — praised for features, but criticized for pricing complexity and billing surprises.
Datadog vs AppSignal
While AppSignal offers a streamlined observability experience with simple setup and usage-based pricing, Datadog provides broader coverage across logs, metrics, traces, infrastructure, and security, along with a much larger integrations ecosystem. Datadog is better suited for teams operating at a larger scale or across complex, multi-cloud environments.
3. New Relic
Known For
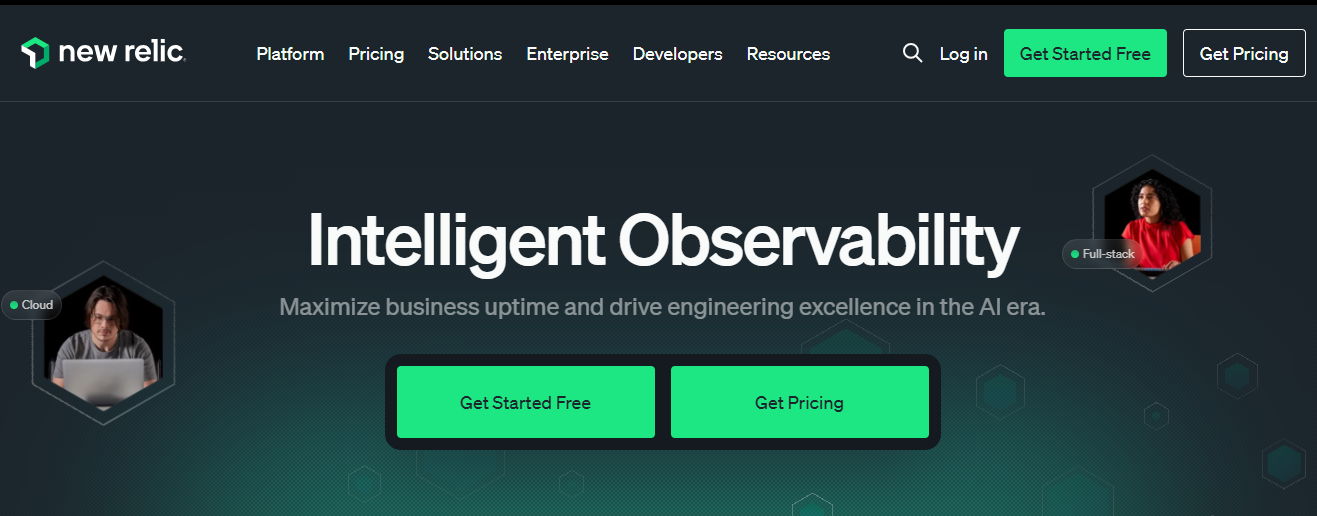
New Relic is a cloud-based observability platform known for unifying metrics, logs, traces, and application monitoring into a single telemetry platform. It was one of the early leaders in APM and has since expanded to full-stack visibility.
Key Features
- APM & Distributed Tracing: Comprehensive tracing support with service maps, span filtering, and transaction breakdowns. It supports OTEL ingest but is not OTEL-native—requiring translation to New Relic’s internal data model.
- Log Management: Built-in log collection, filtering, and enrichment via New Relic Logs. Supports ingestion via Fluentd, OTEL, or New Relic agents—but subject to storage and query cost tiers.
- Infrastructure & Kubernetes Monitoring: Visualizes hosts, containers, and K8s clusters using heatmaps, golden signals, and real-time CPU/memory stats.
- Dashboards & Querying (NRQL): Custom dashboards using New Relic Query Language (NRQL). Flexible but comes with a steep learning curve for teams unfamiliar with SQL-like DSLs.
- Alerts & Synthetics: Includes alert policies, anomaly detection, SLO tracking, and synthetic testing (scripted or browser-based) at extra cost.
Standout Features
- One-agent installation for APM, infra, logs, and browser monitoring
- Telemetry Data Platform (TDP) unifies all telemetry in one store
- Usage-based billing with “all-in-one” pricing per GB ingested
- Code-level diagnostics with auto-instrumentation
Pros
- Unified platform for MELT data
- Flexible pricing for startups via a free tier
- Fast onboarding with auto-instrumentation
- Good Kubernetes and browser monitoring support
Cons
- Pricing scales rapidly as usage increases
- A steep learning curve is required to understand NRQL queries
- Users find the initial setup complex, requiring significant knowledge to configure and utilize New Relic
Best For
Teams looking for a unified observability suite with simple onboarding, or startups benefiting from New Relic’s generous free tier (100 GB/month).
Pricing & Customer Reviews
- Free tier: 100GB/month ingested
- Pro Plan: $0.40/GB ingested beyond the 100GB/month free limit
- Pro Plan: $349/month for full platform user
- Core users are free; full platform users are charged monthly per seat
G2 Rating: 4.4/5 — valued for end-to-end visibility and UI, but reviews often cite concerns around hidden costs and scaling limits.
New Relic vs AppSignal
New Relic delivers a broad observability platform covering applications, infrastructure, logs, metrics, traces, and user experience monitoring, with support for a wide range of languages and cloud environments. AppSignal emphasizes simplicity and predictable pricing, making it easier to adopt but more limited in ecosystem breadth and deployment flexibility.
4. Coralogix
Known For
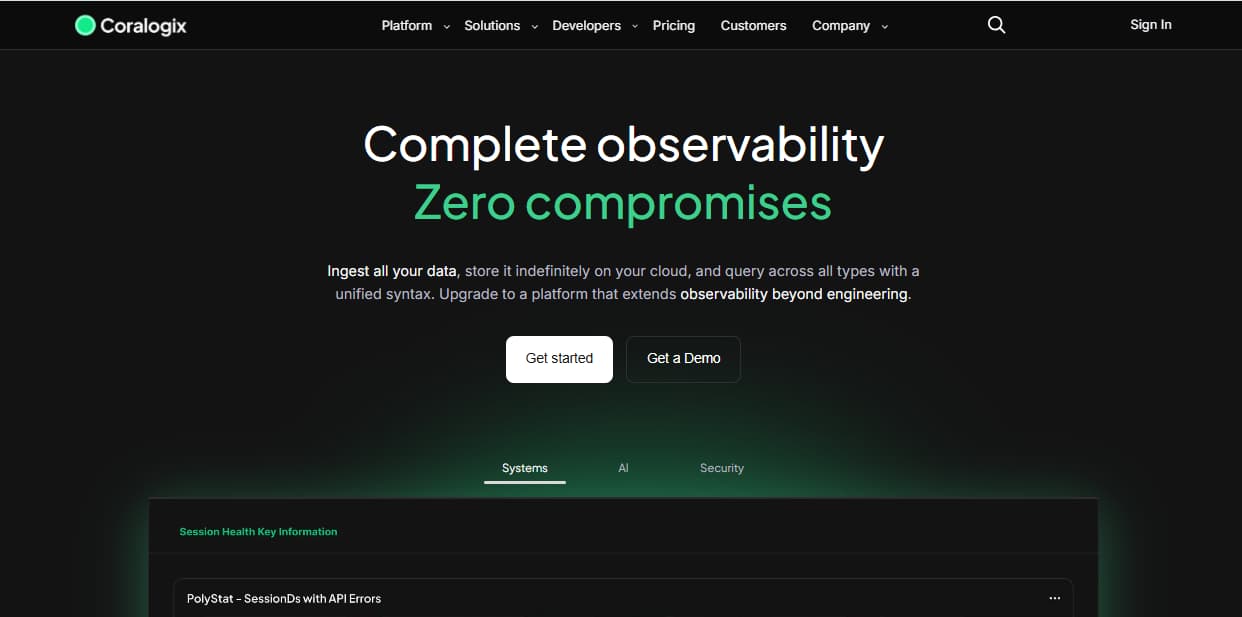
Coralogix is a modern observability platform designed to optimize cost and performance across logs, metrics, traces, and security data. It’s especially known for its log lifecycle management and budget-conscious architecture that decouples ingestion from indexing.
Key Features
- Log, Metric & Trace Ingestion: Ingests data from Fluentd, OTEL, Filebeat, AWS Firehose, and more. Offers full MELT coverage and integrates well into CI/CD pipelines.
- Log Pipeline Optimization: Allows classification of logs into different tiers (hot, warm, cold, and archive) before indexing, helping users save up to 70% on storage and indexing.
- OpenTelemetry Support: Coralogix supports OpenTelemetry ingest pipelines, though it is not a native OTEL platform. It requires mapping incoming data to internal schemas for full dashboard support.
- Security & Compliance Monitoring: Coralogix also includes cloud security posture management (CSPM), compliance rulebooks, and security analytics built on the same telemetry platform.
Standout Features
- Streama™ architecture decouples indexing and querying
- Native ML-based alerting and anomaly detection
- Index-less querying for archived data
- Tiered log lifecycle configuration for cost reduction
Pros
- Highly cost-efficient for log-heavy environments
- Good OpenTelemetry compatibility
- Granular data control and parsing rules
- Full-stack coverage, including SIEM and compliance
Cons
- Users find the learning curve steep for beginners
- Overwhelming UI that hinders usability
- Complex initial setup
Best For
Engineering teams and DevSecOps orgs looking to optimize log-heavy observability costs while maintaining full control over data pipelines and storage.
Pricing & Customer Reviews
- Logs: $0.42/GB
- Traces: $0.16/GB
- Metrics: $0.05/GB
- AI: $1.5/1M tokens
G2 Rating: 4.6/5 — users love the flexibility and pricing model, though some note dashboard usability issues for non-indexed data.
Coralogix vs AppSignal
Coralogix focuses on scalable log analytics with insights, AI-driven alerting, and rich query capabilities, alongside metrics and trace correlation. AppSignal offers a more streamlined observability experience with simpler setup and usage-based pricing, but with a narrower set of analytics and language support compared to Coralogix.
5. Grafana

Known For
Grafana is best known for its powerful open-source visualization and dashboarding platform. It has evolved into a full observability stack under Grafana Cloud, offering metrics (via Prometheus), logs (via Loki), and traces (via Tempo).
Key Features
- Visualization & Dashboarding: Grafana excels at visualizing telemetry with flexible, real-time dashboards. It supports multiple backends (Prometheus, Graphite, InfluxDB, Elasticsearch, and more) and offers templated queries, alert panels, and time-based filtering.
- Metrics via Prometheus: Grafana Cloud integrates Prometheus as a managed backend, enabling powerful multi-dimensional time-series querying (PromQL) and alerting rules.
- Logs via Loki: Loki is Grafana’s log aggregation engine that works similarly to Prometheus but for logs. It’s lightweight and indexing-free, making it cost-efficient.
- Traces via Tempo: Tempo provides distributed tracing capabilities without indexing every span, improving affordability. It supports OTEL, Jaeger, and Zipkin traces.
- Synthetic Monitoring & RUM: Grafana Cloud offers browser checks, HTTP uptime checks, and basic RUM capabilities—though less mature than dedicated tools.
Standout Features
- Plugin ecosystem with hundreds of data sources
- Unified view of logs, metrics, and traces in a single UI
- Grafana Alerting with SLOs and routing policies
- Self-hosted and Grafana Cloud deployment options
Pros
- Flexible and open-source at its core
- Excellent dashboard customization
- OTEL-friendly with native ingest support via Tempo/Loki
- Transparent pricing and strong community backing
Cons
- Steep learning curve when integrating the data sources
- Users criticize Grafana for its complex setup
- Users report an overwhelming UI, making navigation difficult
Best For
DevOps teams that prioritize dashboard customization and open standards, and want full control via self-hosting or hybrid observability stacks.
Pricing & Customer Reviews
- Grafana OSS: Free
- Pro plan: $19/month
- Metrics: $6.50/ 1k series
- Logs: $0.50/GB ingested
- Traces: $0.50/GB ingested
- G2 Rating: 4.6/5 — praised for its visual power and flexibility, with some feedback on initial complexity and trace correlation limitations.
Grafana vs AppSignal
Grafana is a flexible observability platform for metrics, logs, and traces, known for extensive integrations and highly customizable dashboards. AppSignal provides an integrated observability experience with built-in error tracking, performance monitoring, logs, metrics, and uptime checks, focusing on simpler setup and usage-based pricing rather than deep customization.
6. Sentry
Known For
Sentry is best known for application error and performance monitoring, especially among frontend and backend developers. It provides rich context for debugging issues in real time across JavaScript, Python, Ruby, Elixir, and mobile platforms.
Key Features
- Error Tracking & Stack Traces: Automatically captures unhandled exceptions and logs detailed stack traces with user metadata, environment context, and breadcrumbs to help reproduce bugs.
- Performance Monitoring: Provides lightweight distributed tracing for identifying slow API calls, long transactions, and UI latency. Built-in support for Web Vitals, Core Web Metrics, and transaction thresholds.
- Session & User Insights: Sentry connects errors and performance data to individual sessions or user flows, enabling better prioritization and root cause analysis.
- Release Health & Deployment Tracking: Visualizes crash-free sessions, release regressions, and deployment impacts on error rates or latency.
- Integrations & SDKs: Robust SDK ecosystem supporting JavaScript, Python, Go, PHP, Java, Flutter, React Native, and more—alongside tools like GitHub, Jira, Slack, and Linear.
Standout Features
- Deep error context and root cause detection
- Session replay (on higher-tier plans)
- Frontend performance instrumentation out of the box
- Source map support for minified JS debugging
Pros
- Easy to integrate into most dev stacks
- Best-in-class error reporting and issue grouping
- Excellent frontend visibility, especially for JS-heavy apps
- Developer-friendly UI and workflow integration
Cons
- Users find error handling slow and unreliable
- Users find the complex configuration challenging
- Delays in error displays
Best For
Engineering teams focused on application-level debugging, frontend performance, or crash analysis—especially in web and mobile environments.
Pricing & Customer Reviews
- Free for 5K events
- Teams: $26/month
- Business: $80/month
- Enterprise: Custom pricing
G2 Rating: 4.4/5 — loved for debugging workflows, but complexity of setup and high costs at scale.
Sentry vs AppSignal
Sentry specializes in error and performance monitoring with detailed issue tracking, rich context for exceptions, and broad SDK support across many languages and platforms. AppSignal offers full-stack observability, combining errors, performance data, logs, metrics, and uptime checks in one place with a focus on simpler setup and usage-based pricing.
7. Dynatrace
Known For
Dynatrace is an AI-powered enterprise observability platform with robust infrastructure monitoring, real-time analytics, and application security. Known for its full-stack automation and its Davis AI engine, Dynatrace excels in environments with complex microservices and cloud-native workloads.
Standout Features
- Davis AI Engine: Detects anomalies, reduces alert fatigue, and auto-discovers root causes across dynamic environments.
- OneAgent Deployment: Auto-discovers services and dependencies across containers, hosts, and serverless environments.
- Security + Observability: Combines observability with runtime application protection (RASP) and vulnerability analytics.
- Cloud Automation: Intelligent integrations with AWS, Azure, and Kubernetes for workload placement and auto-scaling recommendations.
Key Features
- AI-Driven Root Cause Analysis: Automated root cause detection powered by the Davis AI engine.
- OneAgent Deployment: Simplifies deployment across a variety of infrastructures.
- Comprehensive Observability: Provides visibility across infrastructure, applications, and security.
- Cloud Automation: Seamless integrations for efficient cloud management.
Pros
- Enterprise-grade scalability and resilience.
- No sampling; captures 100% of transactions.
- Strong AI-backed analytics and auto-baselining.
- Complete visibility across infrastructure, applications, users, and cloud.
Cons
- Expensive with complex pricing models.
- Steep learning curve for new users.
- Complex configuration due to overwhelming features
- High pricing, can limit accessibility, especially for startups and small teams
Best For
- Large enterprises with high observability maturity.
- Teams managing massive multi-cloud microservices.
- Enterprises seeking a combined observability and security platform.
Pricing & Customer Reviews
- Infrastructure Monitoring: $29 / mo per host
- Full-Stack Monitoring: $58 / mo per 8 GiB host
- Rating: 4.5/5 on G2, praised for AI capabilities and end-to-end visibility, and criticized for high cost and complexity.
Dynatrace vs AppSignal
Dynatrace is an enterprise observability platform with advanced AI-driven analytics, automated dependency mapping, and broad coverage across applications, infrastructure, and cloud environments. AppSignal provides integrated observability for errors, performance, logs, metrics, and uptime with a simpler setup and usage-based pricing, but with a narrower set of enterprise features and integrations.
Conclusion
AppSignal’s limitations drive teams to seek robust alternatives. CubeAPM leads with OpenTelemetry-native, full-stack MELT support, smart sampling, and flexible hosting, offering a cost-effective, user-friendly solution for startups and enterprises. Dynatrace excels in AI-driven enterprise observability, while Coralogix optimizes log-heavy workflows with advanced data routing.
Why Choose CubeAPM?
CubeAPM outperforms AppSignal. It’s advanced error tracking with exportable data and strong Python OTel integration, paired with full MELT support, RUM, and synthetics, surpasses AppSignal and competitors like Dynatrace or New Relic. CubeAPM’s smart sampling and self-hosted options offer unmatched flexibility and simplicity for startups and enterprises.
Disclaimer: The information in this article reflects the latest details available at the time of publication and may change as technologies and products evolve.
FAQs
1. What are the best alternatives to AppSignal for full-stack observability?
The top alternatives offering broader MELT observability and better scalability include CubeAPM, Datadog, New Relic, Dynatrace, and Grafana. Unlike AppSignal, these platforms support metrics, logs, traces, synthetics, and real user monitoring in a unified view—making them more suitable for growing or complex environments.
2. Why are teams moving away from AppSignal?
Many teams outgrow AppSignal due to its limited language support (mainly Ruby, Elixir, Node.js), lack of RUM and synthetics, and basic sampling/log capabilities. It also doesn’t support OpenTelemetry, which makes vendor-neutral instrumentation and scaling difficult.
3. Is there a more affordable AppSignal alternative with better scalability?
Yes — CubeAPM offers flat $0.15/GB pricing for all telemetry types (logs, metrics, traces, RUM, synthetics), along with OTEL-native support and smart sampling. This makes it ideal for startups and teams trying to control costs without losing observability depth.
4. Which AppSignal alternative supports OpenTelemetry natively?
CubeAPM, Grafana Tempo/Loki, and Coralogix support OTEL ingestion. However, CubeAPM is the only one that is natively OTEL-first, eliminating the need for proprietary agents or translation layers—giving teams more control and future-proof instrumentation.
5. What’s the best AppSignal alternative for frontend performance and user insights?
If you’re primarily focused on frontend and session-level insights, Sentry is a strong alternative. It provides deep error tracking, session replays, and web vitals monitoring—features not offered by AppSignal.


