Monitoring Docker Compose services is essential as teams increasingly rely on Compose for local development and staging. It makes running multi-container stacks like Nginx, Redis, and PostgreSQL easy, but offers only limited health checks and raw logs—leaving teams blind to deeper performance issues.
85% of enterprises are expected to run containerized workloads, yet only 38% report full observability coverage. Without proper monitoring, container crashes, hidden latency, and log noise can quickly erode reliability. This is where CubeAPM helps. With OpenTelemetry support, smart sampling, and unified metrics, logs, traces, and error tracking, teams can monitor Docker Compose services at scale while keeping costs under control.
In this guide, we’ll show you how to achieve full visibility into Docker Compose workloads with CubeAPM.
What are Docker Compose Services?
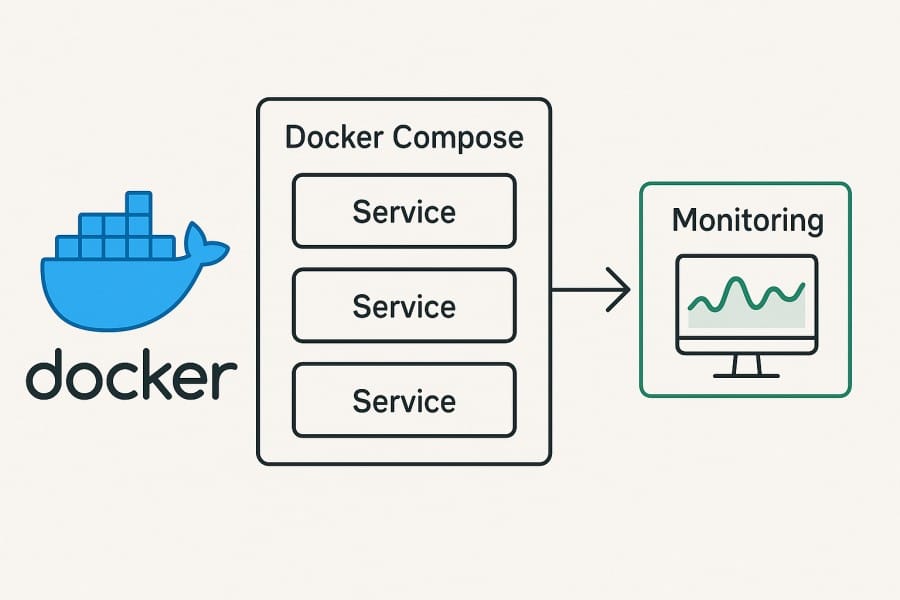
In Docker Compose, a service is a long-running container defined in the docker-compose.yml file, along with its configuration—such as environment variables, volumes, networks, ports, and health checks. Instead of managing containers one by one, Compose abstracts them into services, making it easier to spin up entire application stacks with a single command.
For businesses, this approach brings real advantages:
- Consistency: Teams can replicate the same multi-service environment across dev, test, and staging.
- Speed: A single Compose file can launch databases, APIs, and frontends together in seconds.
- Scalability: Services can be scaled horizontally (docker compose up –scale) to handle higher loads.
- Collaboration: Developers, QA, and ops work against the same reproducible stack, reducing “works on my machine” issues.
Example: Using Docker Compose for E-commerce Checkout
An e-commerce team defines three services in Compose: nginx (frontend), cart-service (API), and postgres (database). With one command, the stack launches on every developer’s laptop, complete with shared networks and health checks. Monitoring these services ensures that a slow database query or crashing API doesn’t silently break the entire checkout flow.
Why Monitoring Docker Compose Services Matters
Startup order, readiness & cascading failures
Compose allows depends_on, but that only ensures the container starts—not “ready.” A database may not accept connections yet, leading the API to fail silently, causing cascading errors. Teams must monitor healthcheck transitions (unhealthy → healthy), restart counts, and readiness probes to avoid these hidden cascades.
Downtime — even in staging — has real cost
Most organizations can’t afford unplanned outages. In 2024, the average cost of an IT outage rose to $14,056 per minute (up nearly 10% from 2022) according to EMA / BigPanda research. Similarly, in the 2024 ITIC downtime survey, over 90% of mid-to-large firms reported that hourly downtime costs exceed $300,000. Even if your Compose stack is staging, delays or blocked releases due to unobserved failures can cascade into costly production mishaps.
Logs are ephemeral, not queryable history
docker compose logs is useful on-the-fly, but it doesn’t support long-term retention, structured queries, or cross-service correlation. In real-world debugging, you’ll want to join logs with metrics and traces to see when a spike in errors started — something Compose’s builtin logging can’t manage.
Distributed failures demand trace insight
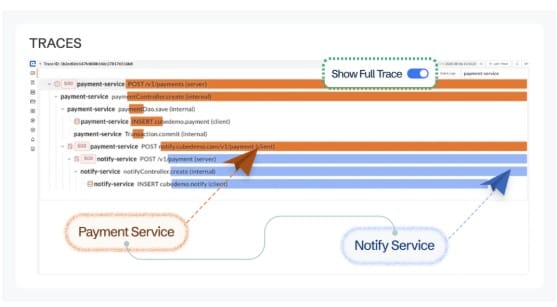
Imagine a request passes from Nginx → API → Postgres → third-party API. Without distributed tracing, you’re left correlating timestamps across logs. For Compose stacks with polyglot services, tracing is essential to see which hop is the real bottleneck or source of errors.
Environment drift & config regressions
Compose is great for consistency, but dev, staging, or CI variants often diverge—missing env vars, different image tags, omitted resource limits. Monitoring helps detect these regressions immediately instead of letting them quietly break flows in staging or production.
Telemetry adoption is growing fast
Modern observability demands open standards. In a recent survey, 48.5% of organizations already use OpenTelemetry, with another ~25% planning to adopt it. This momentum means Compose stacks that lack full telemetry risk falling behind; better to build observability early than retrofit later.
Challenges of Monitoring with Docker Compose Alone
- Limited logs: docker compose logs only outputs raw container streams. It lacks search, indexing, or correlation across services, so you can’t easily analyze incidents across your stack.
- No built-in metrics: Compose doesn’t natively expose service KPIs like latency, throughput, or error rates. To track performance, you must bolt on Prometheus, cAdvisor, or external tools.
- No tracing: Requests flowing between services have no span or context propagation. Without distributed tracing, root cause analysis becomes manual and error-prone.
- No alerting: Compose provides no thresholds or anomaly detection. Teams must rely on external monitoring platforms to set up actionable alerts.
- Scaling pain: With 5–10+ services, adding custom scripts and configs for observability becomes unmanageable. Maintaining consistency across environments is difficult.
- Config drift: Local Compose files often omit limits, logging, or health checks found in staging/prod. This drift hides reliability gaps until they cause real failures.
Key Metrics & Signals to Monitor in Docker Compose
Monitoring Docker Compose services isn’t just about watching containers run. It’s about tracking the right signals across health, performance, and inter-service flows to catch issues before they cascade. Here are the key categories and their critical metrics.
Container Health & Uptime
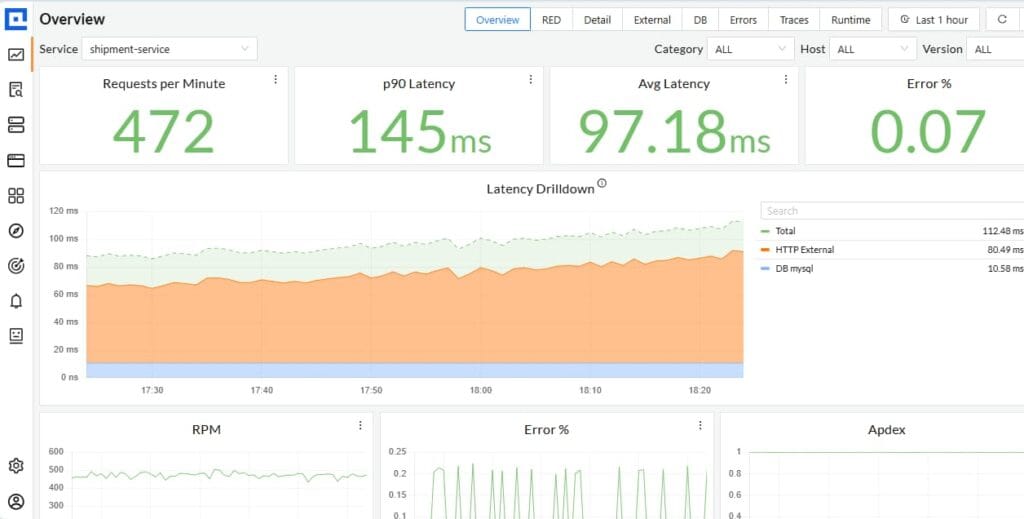
Container health and uptime directly reflects whether services in your Compose stack are running as expected. Monitoring their state helps you catch failures early.
- Restart count: Track how many times a container restarts due to crashes or failed probes. Frequent restarts often point to misconfigured images or missing dependencies. Threshold: alert if a container restarts more than 3 times in 5 minutes.
- Exit codes: Exit codes reveal why containers stopped (e.g., 137 for OOMKill). Observing abnormal exit codes helps detect systemic issues like memory leaks. Threshold: flag non-zero exit codes more than once within an hour.
- Health status: Compose supports healthcheck; monitoring these transitions (unhealthy → healthy) ensures dependent services don’t start too early. Threshold: alert if a service remains unhealthy for >2 consecutive probes.
Resource Utilization
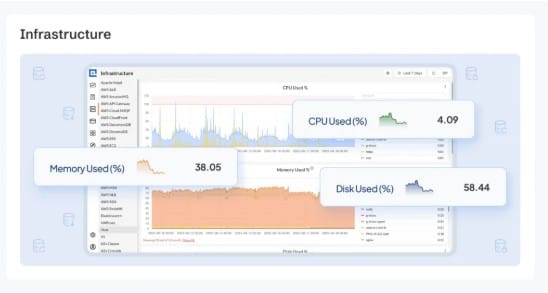
Resource bottlenecks in Compose stacks can crash services or cause degraded performance. Keeping these in check avoids noisy neighbor effects.
- CPU usage: High CPU usage indicates overloaded services or runaway processes. Sudden spikes can signal inefficient code paths. Threshold: warn at sustained >85% CPU for 10 minutes.
- Memory usage: Memory leaks or undersized allocations cause container OOMKills. Tracking working set memory over time helps predict crashes. Threshold: alert if memory >90% of limit for 5 minutes.
- Disk usage & I/O: Volumes filling up or slow disk operations can bring down services silently. Monitoring read/write throughput and capacity prevents outages. Threshold: alert at >80% disk utilization.
- Network I/O: Sudden spikes or drops in ingress/egress traffic may indicate DDoS, misconfigurations, or service hangs. Threshold: warn if traffic drops to zero unexpectedly in active hours.
Application Performance
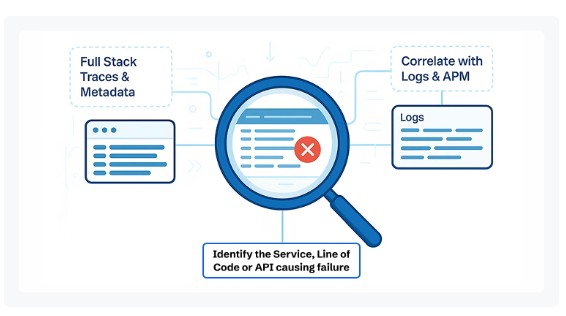
Compose services often back APIs, workers, or web apps. Application-level metrics provide the end-user perspective of performance.
- Response latency: Tracks p50, p95, and p99 response times. Rising tail latencies usually indicate DB slowdowns or network saturation. Threshold: alert if p95 >200ms for APIs consistently over 5 minutes.
- Error rate: HTTP 5xx or gRPC errors highlight failing services. Even small error rate increases can signal cascading failures. Threshold: warn at >2% error rate sustained for 10 minutes.
- Throughput (RPS): Requests per second help measure demand and spot anomalies. Sharp drops may indicate downtime or load balancer failures. Threshold: alert if throughput falls >30% below baseline unexpectedly.
Logs & Events

Logs are the first line of defense to understand Compose service behavior. They provide granular insights into anomalies and misconfigurations.
- Structured error logs: Capture errors in JSON format with trace IDs and service labels. This allows fast filtering and correlation across services. Threshold: alert if error log rate spikes 2× normal baseline.
- Daemon events: Docker daemon events like image pulls, container restarts, and network changes provide context to failures. Threshold: investigate when repeated restart or network disconnect events occur.
Distributed Traces
In Compose, services often call one another in sequence. Traces reveal where latency or errors originate in multi-hop flows.
- Span duration: Measure latency per service hop (API → DB → cache). Identifying long spans points to the slowest link in the chain. Threshold: flag spans exceeding 500ms for critical endpoints.
- Error spans: Traces mark failed spans, helping localize failing queries or services. Monitoring error hotspots reduces MTTR. Threshold: alert if error spans >1% of total traces in an hour.
- External calls: Services in Compose often depend on third-party APIs. Tracking these spans ensures failures outside your stack don’t go unnoticed. Threshold: warn if external API latency doubles vs. baseline.
How to Monitor Docker Compose Services (Step-by-Step with CubeAPM)
Setting up monitoring for Docker Compose with CubeAPM involves installing the platform, configuring it, instrumenting your services, and wiring logs, metrics, and alerts. Here’s how to do it in practice.
1. Install CubeAPM
Choose an installation method based on your environment:
- Docker: Run the
docker runcommand provided in the docs. It exposes ports 3125, 3130, 4317, and 4318, and expects aconfig.propertiesfile. - Docker Compose cluster: Use the provided
docker-compose.ymlin the docs to spin up a 3-node CubeAPM cluster with MySQL backing and an Nginx load balancer. - Kubernetes (Helm): For deploying CubeAPM in a k8s environment, use the official Helm chart (
helm install) as described in the docs.
2. Configure CubeAPM
You must provide core configuration parameters before CubeAPM will run correctly:
- Essential keys:
tokenandauth.key.session(without them, the server won’t start). (CubeAPM) - Optionally override:
base-url,auth.sys-admins,cluster.peers,time-zone, etc. - Configuration precedence: command line > environment variables (
CUBE_prefix) > config file > defaults.
3. Instrument your services
CubeAPM supports multiple instrumentation modes:
- OpenTelemetry (OTLP): The recommended, native protocol. Your application services should emit traces and metrics using OTLP. (CubeAPM)
- New Relic agent support: If your services already use New Relic, set
NEW_RELIC_HOSTto your CubeAPM endpoint so the agent forwards data to CubeAPM instead of New Relic.
4. Collect infrastructure & container metrics
Use an OpenTelemetry Collector to scrape host or container metrics (CPU, memory, disk, network) and forward to CubeAPM. The docs show using the hostmetrics receiver and scraping via Prometheus. (CubeAPM)
This enables CubeAPM to visualize resource usage and correlate with application performance.
5. Ingest & query logs
CubeAPM supports structured logs (JSON), which get flattened and indexed for fast search. The logs docs explain how nested JSON is flattened, and which fields (e.g. service, trace_id, _msg) are used for efficient stream queries. (CubeAPM)
You can send logs via OTLP or via supported log shippers / pipelines.
6. Create dashboards & visualizations
Once metrics, traces, and logs are flowing, build dashboards combining health, performance, and error views. Use CubeAPM’s UI to correlate signals across services (infrastructure + app + logs). The infra and logs docs describe what components you can visualize.
7. Setup alerting / notifications
CubeAPM allows configuring alerts via email, webhook, Slack, etc.
- Set SMTP in your config (e.g.
smtp.url,smtp.from) to enable email alerts. - Use webhook integrations and templating for routing alerts to external systems.
- Alerts can be based on error rates, latency thresholds, health check failures, resource limits, etc. These configuration options and details are in the “Configure → Alerting” section of the docs.
Why CubeAPM for Docker Compose Monitoring
Monitoring Docker Compose services requires more than container logs and basic health checks. You need a platform that unifies telemetry, delivers fast queries, keeps costs under control, and integrates seamlessly with the technologies in your stack. CubeAPM is built exactly for this.
OpenTelemetry-native, unified telemetry, fast queries
CubeAPM is OpenTelemetry-native, which means your Compose services can emit metrics, logs, and traces via OTLP without vendor lock-in. It unifies all telemetry signals in one place and enables lightning-fast queries, making root cause analysis much quicker than with ad-hoc Compose commands.
Smart Sampling for efficiency

Instead of random probabilistic sampling, CubeAPM uses Smart Sampling—keeping error traces, latency spikes, and anomalies while discarding noise. This ensures you see the most important events while reducing storage needs. Teams typically save over 60% in telemetry costs compared to legacy APMs.
Pricing you can predict
CubeAPM charges $0.15/GB of ingestion—covering metrics, logs, and traces together, with no hidden host or user fees.
- A small stack (5 services, ~500GB/month telemetry) costs about $75/month.
- A medium stack (10 services, ~2TB/month telemetry) costs about $300/month.
By comparison, legacy APMs often run into thousands per month for the same workloads.
800+ Integrations
Whether your Compose stack runs Postgres, Redis, Nginx, Kafka, RabbitMQ, MySQL, or MongoDB, CubeAPM supports them natively. With over 800 integrations, you can monitor databases, caches, message brokers, and web servers out of the box—no need for additional plugins.
Security & Compliance

Compose isn’t just for local dev; many teams run staging or regulated environments on it. CubeAPM supports BYOC (Bring Your Own Cloud) and self-hosted deployments, so your data never leaves your control. It also includes RBAC, audit logs, and data residency options to meet compliance needs.
Developer-friendly support
Unlike incumbents that can take days to respond, CubeAPM gives you direct Slack/WhatsApp access to core engineers, with response times in minutes. That’s invaluable when debugging complex Compose issues under deadline pressure.
Case Study: Monitoring an E-commerce Checkout Stack on Docker Compose with CubeAPM
The Challenge
A mid-size e-commerce company was running its staging environment entirely on Docker Compose with services like Nginx, cart-service API, PostgreSQL, Redis, and a payment gateway connector. Developers frequently hit issues where the API returned 5xx errors during checkout testing. Debugging was painful: docker compose logs produced thousands of unstructured lines, database latency issues went unnoticed, and the cart-service container often restarted without a clear cause. Releases to production were regularly delayed.
The Solution with CubeAPM
The team deployed CubeAPM alongside their Compose stack. Using OpenTelemetry instrumentation, each service emitted traces and metrics directly to CubeAPM. A lightweight OpenTelemetry Collector was added to scrape container metrics (CPU, memory, disk I/O) and forward them. They also enabled structured JSON logging with service labels (service: cart-service, env: staging) for correlation.
The Fixes
- Tracing bottlenecks: CubeAPM traces revealed that 80% of checkout latency came from a single PostgreSQL query in the cart-service. Optimizing the query reduced p95 latency from 420ms to 150ms.
- Container restarts: Metrics showed the cart-service repeatedly exceeded memory limits. Developers increased its memory allocation in docker-compose.yml and fixed a memory leak in Redis session handling.
- Noisy logs: With CubeAPM log search, developers filtered error logs by request ID, cutting debug time in half compared to raw compose logs.
- Alerting gaps: The team set up email alerts for container restarts >3 times in 5 minutes and checkout error rates above 2%.
The Results
Within weeks, the company achieved:
- 60% faster mean-time-to-resolution (MTTR) for staging incidents.
- 50% fewer failed pre-production releases, since issues were caught earlier in Compose.
- Improved checkout stability, with error rates dropping below 1%.
- Predictable monitoring costs (~$200/month for 1.5TB telemetry) versus thousands quoted by legacy vendors.
By combining unified telemetry, smart sampling, and compliance-ready deployment, CubeAPM turned Docker Compose from a “black box” into a reliable staging environment with production-grade visibility.
Best Practices for Monitoring Docker Compose
- Structured JSON logs: Always log in JSON with request IDs, user/session IDs, and service/env labels. This makes logs searchable and easy to correlate with traces across services.
- Labels & metadata: Add metadata such as service, env, version, and commit_sha to all telemetry. These labels help identify regressions after deployments and simplify root cause analysis.
- Healthchecks everywhere: Define healthcheck blocks with retries and timeouts for every service. This ensures dependencies don’t receive traffic before they’re ready and helps detect failing services faster.
- Resource requests & limits: Set CPU and memory requests/limits for all services. Monitoring these values prevents OOMKills, throttling, and noisy neighbor issues in shared environments.
- SLIs/SLOs & canary checks: Define 2–3 key metrics like latency, error rate, or availability and track them against business SLOs. Use canary traffic in staging to spot regressions early.
- Retention strategy: Keep logs and metrics for 30 days in hot storage and archive them for 180 days in cold storage. Sample traces and drop rarely used data to reduce cost while preserving history.
- Version pinning & drift control: Pin Docker images and manage environment variables in a .env file. This avoids environment drift and ensures staging is a true replica of production.
- Test alert rules: Regularly review and test alert thresholds with synthetic errors or stress tests. This keeps alerts meaningful and avoids fatigue from false positives.
Conclusion
Monitoring Docker Compose services is critical for ensuring reliability across multi-service applications. Without visibility, hidden errors, resource bottlenecks, and service restarts can delay releases and impact user experience.
CubeAPM provides everything Compose teams need—OpenTelemetry-native instrumentation, unified metrics/logs/traces, 800+ integrations, Smart Sampling, and predictable pricing. With compliance-ready deployments and fast support, teams move faster without hidden costs.
If you want to turn your Compose stack into a production-grade environment with full observability, get started with CubeAPM today and experience faster troubleshooting, lower costs, and complete visibility.
Disclaimer: The information in this article reflects the latest details available at the time of publication and may change as technologies and products evolve.
FAQs
1. Can Docker Compose be used in production, and how does monitoring help?
Yes, many teams run small or staging workloads in production with Docker Compose. Monitoring ensures that container health, logs, and resource usage are tracked, reducing downtime risks in these environments.
2. How is monitoring Docker Compose different from monitoring Kubernetes?
Compose lacks built-in orchestration and scaling features that Kubernetes has. Monitoring Compose focuses more on container health, restarts, and inter-service dependencies, whereas Kubernetes adds layers like pods, nodes, and clusters.
3. What tools can I use to monitor Docker Compose logs effectively?
While docker compose logs gives basic output, structured logging with a platform like CubeAPM or centralized log shippers (Fluent Bit, Vector) makes logs searchable and correlated with traces.
4. How do I monitor network traffic between services in Docker Compose?
You can capture network metrics using exporters like cAdvisor or Prometheus and forward them to CubeAPM. This helps detect slow service-to-service calls or unexpected traffic drops.
5. What are common mistakes when monitoring Docker Compose services?
Typical mistakes include relying only on raw logs, skipping healthchecks, not setting resource limits, and failing to retain historical telemetry. These gaps make diagnosing failures in Compose environments much harder.


