Pinpoint APM is an open-source APM tool for large-scale distributed systems, known for deep transaction tracing, call-stack analysis, and service topology visualization. However, its agent-based approach and complex backend setup can add operational overhead.
CubeAPM is the best alternative to Pinpoint for teams that want full-stack observability without heavy operational overhead. It is OpenTelemetry-native, simpler to deploy, and removes the need to manage complex collectors or storage backends, while still providing unified visibility with predictable, transparent pricing.
In this article, we’ll explore the top 7 Pinpoint APM alternatives—comparing features, pricing, pros and cons, and use cases—to help you find the best fit for modern, OTEL-driven observability.
Top 7 Pinpoint APM Alternatives
- CubeAPM
- New Relic
- Dynatrace
- Datadog
- Uptrace
- SigNoz
- Grafana
Why Look for Pinpoint APM Alternatives?
1. Steep learning curve and confusing reporting workflows
G2 reviewers frequently mention that Pinpoint APM has a challenging learning curve, especially when it comes to integrations and reporting. Users report difficulty understanding how data flows across the platform and how reports should be configured or interpreted. Limited customization further compounds the issue, making it harder for teams to adapt Pinpoint to their existing workflows without significant trial and error.
2. Limited customization for dashboards, templates, and UI
A recurring theme in G2 feedback is the lack of flexibility in customizing Pinpoint’s interface. Users want more control over templates, dashboards, and visual elements to match their team’s needs and preferences. Without deeper customization options, teams struggle to tailor views for different stakeholders, which reduces day-to-day usability and adoption.
3. Insufficient customization for advanced reporting use cases
Beyond basic UI changes, users also highlight gaps in reporting customization. G2 reviews note that teams want more granular control over reports, including tailored templates and configurable outputs. The inability to easily customize reporting limits how effectively teams can extract insights or align observability data with internal performance and incident review processes.
Criteria for Suggesting Pinpoint Alternatives
To identify effective replacements for Pinpoint APM, we evaluated each tool based on the following seven criteria essential for modern observability workflows:
1. Native OpenTelemetry (OTEL) Support
Alternatives must offer native OTEL integration—supporting SDKs, OTLP ingestion, and collector compatibility—to ensure vendor-neutral instrumentation and smooth interoperability across stacks.
2. Full MELT Coverage (Metrics, Events, Logs, Traces)
We prioritized platforms that support all core telemetry signals, enabling teams to correlate metrics, logs, traces, and events in a single observability pipeline.
3. Modern Language & Framework Support
We looked for alternatives that support modern runtimes like Node.js, Go, .NET, and serverless functions, in addition to container-native setups like Kubernetes.
4. Built-in Error Tracking, RUM & Synthetics
Top contenders offer built-in support for Real User Monitoring, synthetic checks, and error inboxes, eliminating the need for multiple disconnected tools.
5. Scalability & Performance at High Volume
We evaluated each tool’s ability to handle large-scale telemetry ingestion, high-cardinality metrics, and long retention periods—critical for production-grade observability.
Pinpoint APM Overview

Known For
Pinpoint is known as a lightweight, open-source distributed tracing solution primarily built for Java, with additional support for PHP and Python. It was designed for teams needing a simple way to visualize application performance, track request paths, and analyze latency across services—without having to pay for commercial APM tools.
Standout Features
- ServerMap (Service Topology View): Automatically maps microservices and dependencies to help visualize call relationships in real-time.
- Real-Time Tracing Engine: Enables users to inspect the path of individual transactions across distributed services.
- Agent-Based Instrumentation: Requires no manual code instrumentation—just attach the language-specific agent to start collecting telemetry.
- Minimal Performance Overhead: Pinpoint reports less than 3% runtime overhead, making it feasible for production use in most backend systems.
Key Features
- Distributed tracing support for Java, PHP, and Python
- Call stack visualization with response time analysis
- Application dashboards with trace timelines
- Configurable sampling via a counting-based strategy
- ServerMap for dependency and service flow visualization
- Backend collector and UI built for self-hosted deployments
Pros
- Completely open-source under the Apache 2.0 license
- No vendor lock-in or cloud egress concerns
- Works well out of the box for Java-based microservices
- Easy to deploy via agent model, no need to alter codebase
- Actively maintained with a growing GitHub community
Cons
- High operational complexity due to multiple components
- Steep learning curve, especially for teams new to Pinpoint’s architecture and UI
- Backend infrastructure management and scaling are the user’s responsibility
Best For
Engineering teams with strong Java or PHP foundations that want simple tracing in a self-managed setup, without needing broader observability or cloud-native integrations.
Pricing & Customer Reviews
Pinpoint is free to use and self-hosted, with no licensing or vendor fees.
Rating: No Public rating
Top 7 Pinpoint Alternatives
1. CubeAPM

Known For
CubeAPM is a full-stack, OpenTelemetry-native observability platform built for modern DevOps teams that need complete visibility across metrics, traces, logs, RUM, and synthetics — with flat pricing and no vendor lock-in.
Key Features
- Distributed tracing with OTEL-native instrumentation
- Centralized logging with trace correlation
- Real-time infrastructure monitoring
- Real User Monitoring (RUM) and synthetic checks
- Smart sampling engine with context-based filtering
- Built-in error tracking and anomaly detection
- Support for Prometheus, OTEL, and existing Datadog agents
- Self-hosting for compliance and air-gapped use cases
Standout Features
- Smart Sampling Engine: Retains high-value traces (errors, high latency) while discarding noise—cuts storage up to 70%
- Flat Pricing Model: No per-host, per-user, or per-metric pricing—just $0.15/GB ingest,
- Rapid Migration: Transition from Datadog/New Relic in under an hour
- Self-hosted and compliant: Deploy in your own cloud to meet data residency and privacy requirements
Pros
- Full MELT support with OpenTelemetry out of the box
- Predictable, cost-efficient billing
- Extensive integration ecosystem, 800+ integrations
- Slack/WhatsApp support with core developers
- Unlimited data retention with BYOC archival
- Fast onboarding and zero-code agent compatibility
Cons
- Not suited for teams looking for off-prem solutions
- Strictly an observability platform and does not support cloud security management
Best For
Engineering teams looking for a modern, compliant, OTEL-native alternative to Pinpoint, with transparent pricing and full-stack visibility.
Pricing & Customer Reviews
- Flat pricing: $0.15/GB ingestion
- Rating: 5/5
CubeAPM vs Pinpoint
CubeAPM and Pinpoint APM differ mainly in scope and operational complexity. Pinpoint focuses on deep transaction tracing and service topology analysis using agents and a multi-component backend that teams must deploy and manage. CubeAPM, in contrast, provides a unified full-stack observability platform with simpler deployment and centralized visibility, reducing the operational overhead associated with running and scaling the monitoring stack.
2. New Relic
Known For
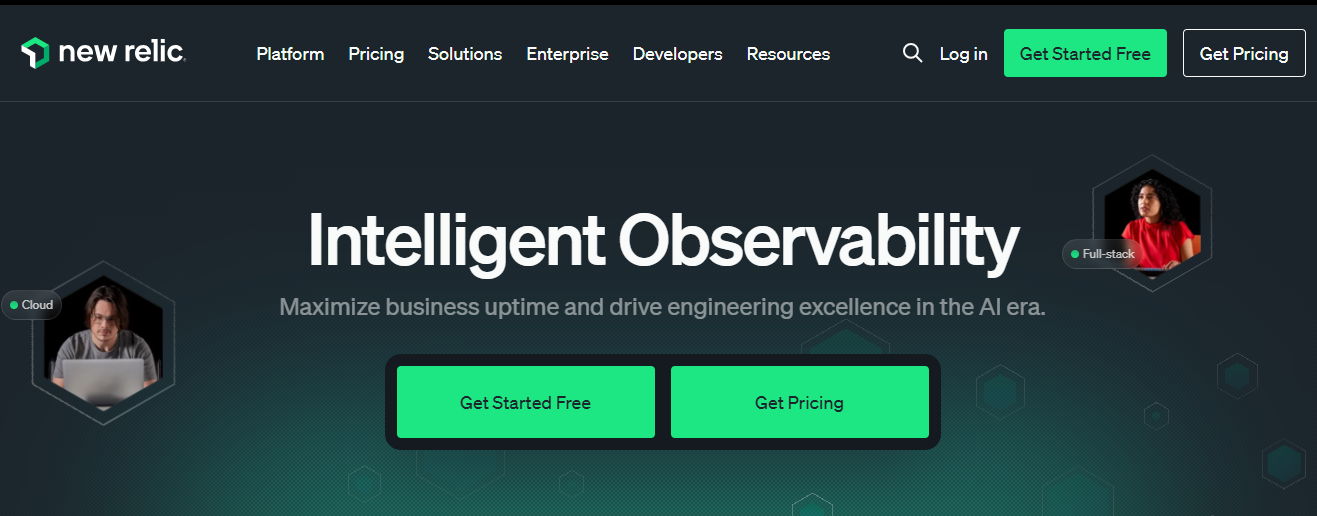
New Relic is a cloud-based observability suite offering broad coverage across APM, infrastructure, logs, browser monitoring, and synthetics. It’s often used by enterprises seeking out-of-the-box visibility across large microservices environments.
Key Features
- Application Performance Monitoring with service maps and transaction traces
- Infrastructure monitoring with built-in alerting
- Logs, metrics, and dashboards unified in a single UI
- Real User Monitoring and synthetic monitoring
- Errors inbox with intelligent grouping
- Support for OpenTelemetry, Prometheus, and Kubernetes
- Usage-based billing across ingest, transfer, and user access
Standout Features
- All-in-one observability platform with unified telemetry view
- New Relic One UI: Highly interactive dashboards, service maps, and trace waterfalls
- Errors Inbox & AIOps: Centralized error analysis and alert correlation
- Data Nerd Graph: Query interface for advanced customizations across entities
Pros
- Rich telemetry and visualization in one place
- Built-in APM, logs, infra, synthetics, and frontend monitoring
- Strong ecosystem integrations
- Offers OTEL compatibility for hybrid setups
- Useful for large-scale, production-critical environments
Cons
- Pricing can escalate sharply with ingestion volume and users
- Complex UI and learning curve for smaller teams
Best For
Enterprises that want an all-in-one SaaS platform with native APM, RUM, infra, and synthetics, and can afford premium pricing for broader visibility.
Pricing & Customer Reviews
- Free Tier: 100GB/month ingested
- Pro plan: $0.40/GB ingested beyond the free 100GB limit
- Pro Plan: $349/user for full platform user
- G2 Rating: 4.4/5
New Relic vs Pinpoint
New Relic is a commercial, full-stack observability platform with managed infrastructure and broad language support. In contrast, Pinpoint APM is an open-source tool focused on deep transaction tracing and service topology, requiring agent-based instrumentation and a self-managed backend.
3. Dynatrace
Known For
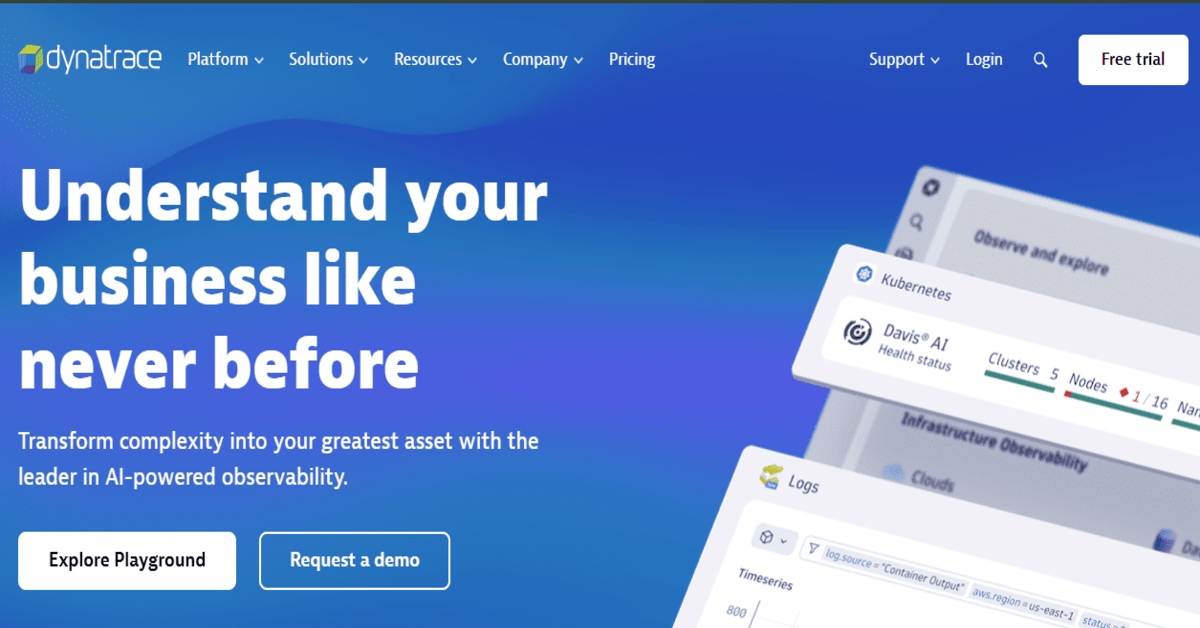
Dynatrace is an enterprise-grade observability and AIOps platform with deep support for application performance, infrastructure telemetry, and security insights, all powered by its proprietary Davis AI engine.
Key Features
- OneAgent for unified collection of metrics, logs, traces, and user behavior
- Davis AI for anomaly detection, root cause analysis, and predictive analytics
- Application performance with distributed tracing and code-level insights
- Kubernetes, VM, and cloud infra monitoring
- Real User Monitoring, Session Replay, and mobile instrumentation
- Synthetic monitoring and SLA tracking
Standout Features
- Davis AI Engine: Automates anomaly detection, baselining, and RCA
- OneAgent: Single-agent approach to collect all telemetry with minimal overhead
- Smartscape & Topology Mapping: Dynamic dependency visualization across hybrid environments
- Deep Code Analysis: Method-level trace insights for performance bottlenecks
Pros
- Highly automated and powerful AI-assisted observability
- Strong enterprise-grade capabilities
- Easy deployment with OneAgent and Smartscape
- Excellent performance for large-scale distributed systems
Cons
- Complex pricing based on host units, DEM units, and retention
- Costly for smaller teams or startups
- Complex and overwhelming UI
Best For
Enterprises that need AI-driven observability and root-cause automation, especially in hybrid or large-scale cloud environments.
Pricing & Customer Reviews
- Infrastructure Monitoring: $29/month per host
- Full-Stack Monitoring: $58/month per 8 GiB host
- G2 Rating: 4.5/5 (G2)
Dynatrace vs Pinpoint
Datadog is a commercial, full-stack observability and monitoring platform with hosted infrastructure, broad language and integration support, and enriched dashboards. In contrast, Pinpoint APM is an open-source tool focused on distributed transaction tracing and topology visualization, requiring agent setup and a self-managed backend.
4. Datadog
Known For
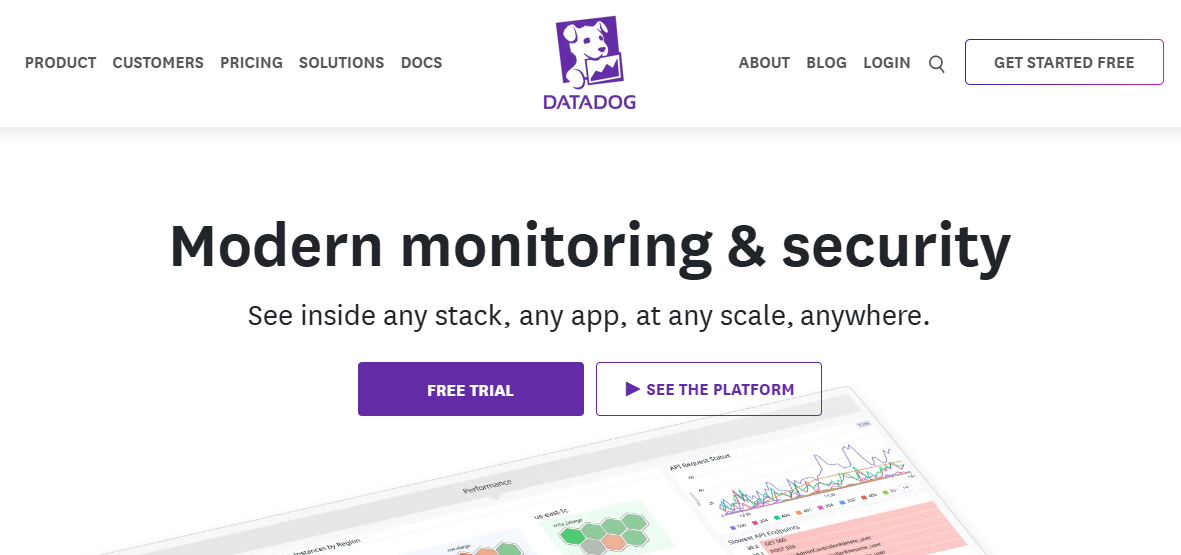
Datadog is a comprehensive observability platform combining APM, infrastructure monitoring, logging, RUM, and security in a cloud-native SaaS model. It is widely adopted by enterprises due to its integrations and modular design.
Key Features
- APM with auto-instrumentation and flamegraphs
- Centralized logging and log-based metrics
- Infrastructure monitoring with Kubernetes, VM, and cloud support
- Real User Monitoring and frontend session tracking
- Synthetic API and browser tests
- 900+ native integrations with cloud, infra, and developer tools
- Alerting, dashboards, and anomaly detection
Standout Features
- Modular pricing and service granularity
- Unified dashboarding: Mix metrics, logs, traces, and events
- Autodiscovery: Detects hosts, containers, and cloud assets instantly
- Live tail and indexed logs for real-time log stream analysis
Pros
- Feature-rich and battle-tested at enterprise scale
- Strong documentation and integration ecosystem
- Offers visibility across the full stack
- Wide support across environments and languages
Cons
- Expensive as usage grows
- Steep learning curve to use advanced features
- Overwhelming UI especially for beginners
Best For
Large teams with big budgets looking for out-of-the-box enterprise observability with hundreds of integrations and advanced telemetry features.
Pricing & Customer Reviews
- Infrastructure Monitoring (Pro Plan): $15/host/month
- APM (Pro Plan): $35/host/month
- Logs: $0.10/per ingested GB/month
- G2 Rating: 4.4/5
Datadog vs Pinpoint
Datadog is a commercial, full-stack observability platform with hosted infrastructure, broad language support, and ready-to-use dashboards. In contrast, Pinpoint APM is an open-source tool focused on distributed transaction tracing and service topology, requiring agent instrumentation and a self-managed backend.
5. Uptrace

Known For
Uptrace is a modern observability platform built natively on OpenTelemetry. It focuses on distributed tracing, metrics, and log correlation while maintaining simplicity and low resource usage, making it ideal for developers looking for an affordable and lightweight OTEL-first alternative.
Key Features
- Native OpenTelemetry support across all telemetry types
- Distributed tracing with flamegraphs and service maps
- Time-series metrics and dashboards with ClickHouse backend
- Log ingestion with trace-level correlation
- Built-in alerting and dashboards
- Self-hosted deployment for full control
Standout Features
- Fully OTEL-native architecture
- ClickHouse-powered backend ensures fast querying of high-cardinality data
- All-in-one deployment for self-hosted observability
- Lightweight binary with no vendor agents or proprietary instrumentation
Pros
- Native OTEL support with no lock-in
- Efficient and fast, even at high volumes
- Easy to deploy with Docker or Kubernetes
- Self-hosted and privacy-friendly
- Free plan available with generous limits
Cons
- Some advanced features require setup efforts, especially when self-hosted
- High operational overhead to manage ClickHouse, OTEL Collector, and configs.
Best For
Developers and small teams looking for a simple, OTEL-native, self-hosted tracing platform without the complexity or cost of larger tools.
Pricing & Customer Reviews
- Traces and Logs: starts at $0.08 per GB
- Metrics: starts at $0.001 per series
- G2 Rating: 4.4/5
Uptrace vs Pinpoint
Uptrace is a clear upgrade over Pinpoint with OTEL support, log correlation, and support for modern stacks. While both are self-hosted and free to start, Uptrace is more aligned with modern telemetry standards and developer workflows.
6. SigNoz
Known For
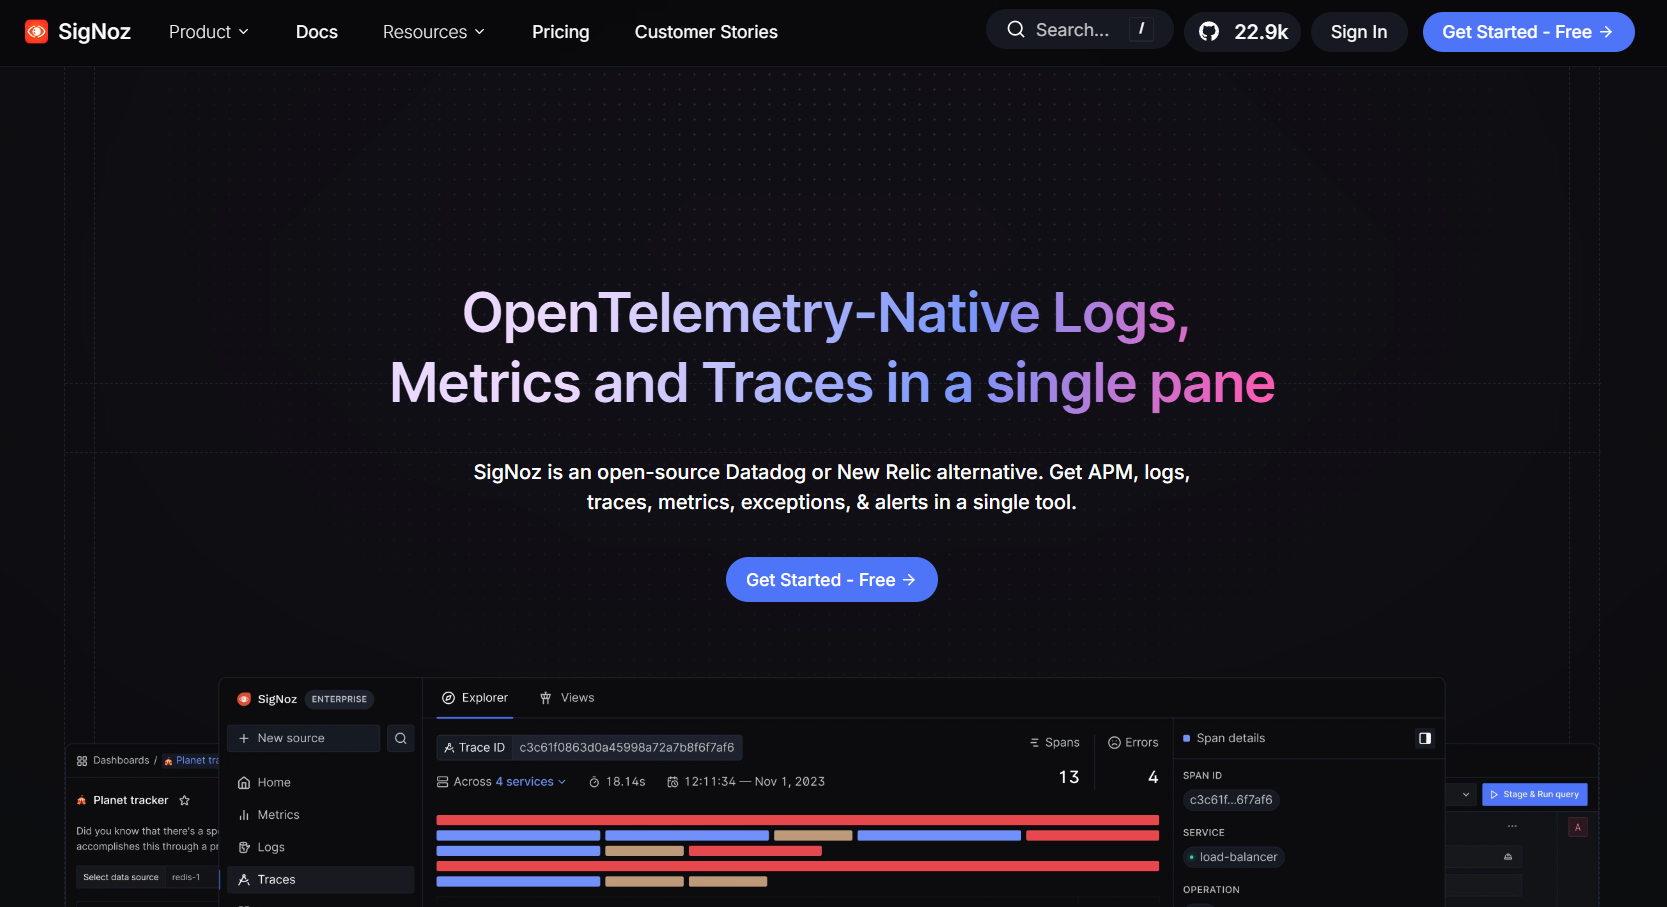
SigNoz is a fast-growing, open-source observability platform built natively on OpenTelemetry. It offers tracing, metrics, and logging in a unified UI and is rapidly becoming the default self-hosted alternative to commercial tools like Datadog and New Relic.
Key Features
- Distributed tracing via OpenTelemetry SDKs
- Metrics ingestion using Prometheus format
- ClickHouse backend for performance
- Logs, traces, and metrics all shown in unified dashboards
- Custom dashboards and alerts
- Docker/Kubernetes installation options
- Community and enterprise editions
Standout Features
- Unified MELT support with an OTEL-first architecture
- Built-in dashboards and alerts powered by ClickHouse
- Custom sampling rules to reduce ingestion cost
- Active community and regular updates backed by core maintainers
Pros
- Open-source and fully self-hosted
- Active product development and community roadmap
- Flat-rate commercial pricing for enterprise edition
- Ideal for teams looking to reduce Datadog/New Relic costs
- Supports multiple languages and environments
Cons
- Managing ClickHouse memory usage is time-consuming
- Operational complexity, especially for managing the stacks
- The UI, while functional, might feel cluttered
Best For
Engineering teams seeking a free or affordable, OTEL-native, self-hosted observability stack with tracing, logs, and metrics in one place.
Pricing & Customer Reviews
- Free tier + base fee of $49/month. Charges beyond the base fee are based on data ingested:
- Traces: $0.30/GB.
- Logs: $0.30/GB.
- Metrics: $0.10/million samples.
- G2 Rating: 4.6/5 (G2)
SigNoz vs Pinpoint
SigNoz is an OpenTelemetry-native observability platform that ingests telemetry via OTEL collectors and provides unified views across traces, metrics, and logs. In contrast, Pinpoint APM uses its own agents and backend architecture to instrument applications and provides deep transaction analysis and service topology visualization, but requires teams to deploy and operate multiple backend components.
7. Grafana
Known For
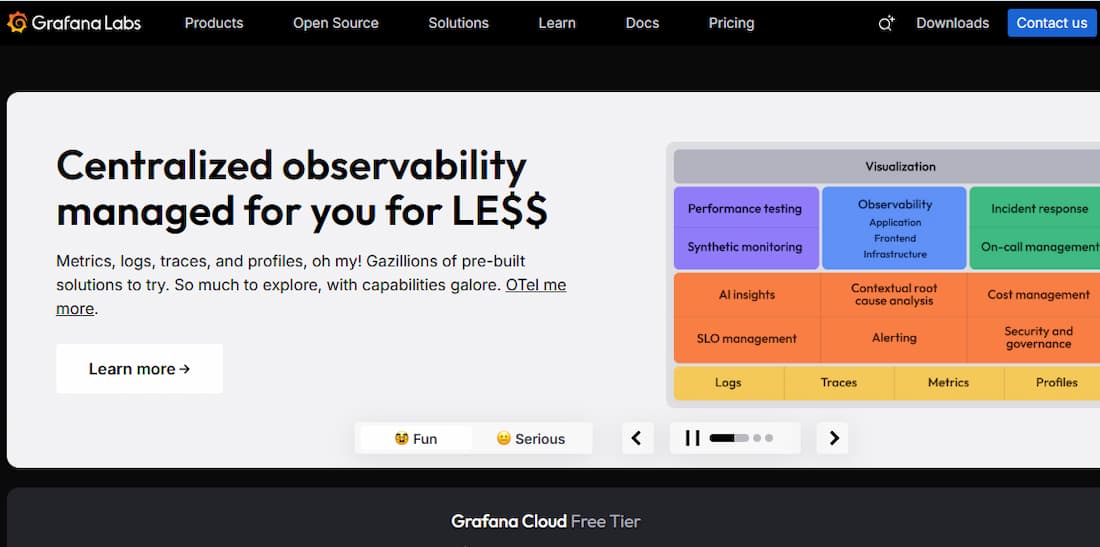
Grafana is an open-source visualization platform that has expanded into full observability with Grafana Cloud, combining dashboards, metrics (via Prometheus), logs (via Loki), and traces (via Tempo).
Key Features
- Multi-source dashboards (Prometheus, InfluxDB, Loki, Tempo, etc.)
- Tracing with Tempo and OpenTelemetry support
- Logging via Grafana Loki
- Built-in alerting and annotation support
- Grafana Agent for telemetry collection
- Enterprise and cloud-hosted options available
Standout Features
- Highly customizable dashboarding with variables, alerts, and templating
- Modular design lets you plug in only what you need
- Grafana Cloud simplifies setup for smaller teams
- OTEL compatibility across Grafana Agent and Tempo
Pros
- Strong open-source ecosystem
- Integrates well with Prometheus, Loki, Tempo, and Jaeger
- OTEL and Prometheus-native
- Large user community and plugin marketplace
- Both SaaS and self-hosted models
Cons
- Steep learning curve
- Complex setup requirements
- Overwhelming UI
Best For
Teams that want highly flexible, open-source visualization with the option to extend into full observability using Tempo, Loki, and Prometheus.
Pricing & Customer Reviews
- Grafana OSS: Free
- Pro plan: $19/month
- Metrics: $6.50/ 1k series
- Logs: $0.50/GB ingested
- Traces: $0.50/GB ingested
- G2 Rating: 4.5/5
Grafana vs Pinpoint
Grafana is an observability platform that visualizes metrics, logs, and traces from various backends through plugins and data sources. In contrast, Pinpoint APM is a standalone APM tool with its own agents and backend focused on tracing and service interaction analysis, requiring users to deploy and manage its full stack.
Conclusion
Pinpoint APM served its purpose well as a low-cost, agent-based tracing solution, especially in Java-heavy environments. But as the landscape shifts toward OpenTelemetry, full MELT coverage, and cost-efficient scale, teams are moving to more modern, flexible alternatives.
CubeAPM leads the pack with smart sampling, transparent pricing, and full OTEL-native support. Tools like SigNoz and Uptrace offer great open-source control, while New Relic, Dynatrace, and Datadog serve enterprise needs—at a cost. Grafana shines with modularity and open standards.
Each tool has its strengths. The best choice depends on your stack, budget, compliance needs, and desire for control vs convenience.
Disclaimer: The information in this article reflects the latest details available at the time of publication and may change as technologies and products evolve.1
FAQs
1. Is Pinpoint APM still a good option for distributed tracing?
Pinpoint is still useful for small teams using Java, PHP, or Python who want simple tracing without the cost of commercial APM tools. However, it lacks OTEL support, MELT coverage, and modern stack compatibility—making it less ideal for growing teams or production environments.
2. What makes CubeAPM the best Pinpoint alternative?
CubeAPM is OpenTelemetry-native and offers full-stack observability (metrics, logs, traces, RUM, synthetics), with smart sampling and flat pricing. It’s built for compliance, can be self-hosted, and scales without the complexity or cost of legacy tools.
3. Which Pinpoint alternatives support self-hosting?
CubeAPM, SigNoz, Uptrace, and Grafana all offer self-hosted deployment options, making them suitable for teams with data residency, privacy, or air-gapped environment requirements.
4. How do these tools compare in pricing?
CubeAPM offers flat $0.15/GB pricing with no host-based billing. SigNoz and Uptrace are free or low-cost for smaller teams. In contrast, Datadog and New Relic charge per host, user, and ingestion volume—often resulting in unpredictable monthly bills.
5. Does Pinpoint support OpenTelemetry (OTEL)?
No, Pinpoint uses its own custom agent and data format. It does not support OTEL SDKs, OTLP ingestion, or collector-based pipelines, which limits its flexibility and ecosystem compatibility.


