Chronosphere’s core strength is its ability to handle massive cloud-native scale through powerful metrics, logs, and trace controls. However, teams often find the platform rigid, with a steep learning curve and high costs, especially when scaling.
CubeAPM is the top alternative to Chronosphere, offering full MELT observability, OpenTelemetry support, and simplified pricing. It integrates RUM, synthetic monitoring, logs, metrics, and traces, with flat pricing starting at $0.15/GB for data ingestion.
In this article, we break down the top 7 alternatives to Chronosphere in 2025, comparing tools based on metrics ingestion efficiency, trace sampling strategy, pricing transparency, MELT coverage, OpenTelemetry support, and support for flexible deployments.
Top 7 Chronosphere Alternatives
- CubeAPM
- Honeycomb
- Datadog
- New Relic
- Dynatrace
- SigNoz
- Sumo Logic
Why Look for Chronosphere Alternatives?
While Chronosphere delivers high-throughput metrics ingestion and alerting at scale, several structural limitations are driving teams to seek more holistic and cost-effective solutions:
1. Steep Learning Curve for PromQL
Chronosphere’s reliance on PromQL (Prometheus Query Language) for metrics querying creates a steep learning curve for users unfamiliar with its syntax, potentially delaying onboarding and incident response.
As one user notes:
“Prometheus/PromQL (which Chronosphere is based on) is still a complex system to learn….if you or your users are new, expect to take some time learning the language and data model.” (G2 Review)
2. High Cost as Environments Scale
As telemetry volume grows—especially in microservices and Kubernetes—overall costs become harder to forecast, making budget planning challenging for growing organizations.
3. Overwhelming UI for New Users
Some users mention that the interface takes time to adapt to and isn’t as intuitive for beginners. This reduces developer adoption and makes cross-team usage harder, especially in companies where not everyone is a Prometheus power user.
Criteria for Suggesting Chronosphere Alternatives
When evaluating alternatives to Chronosphere, we considered both technical capability and operational cost based on a thorough comparison across multiple dimensions. The key criteria include:
1. Full MELT (Metrics, Events, Logs, Traces) Observability
Prioritized alternatives that offer unified visibility across all telemetry types — logs, metrics, traces, and events — to support comprehensive troubleshooting and service reliability.
2. OpenTelemetry-Native Support
Tools with native OpenTelemetry support enable standards-based instrumentation without vendor lock-in. These platforms offer better compatibility with modern cloud-native architectures and developer tooling.
3. Smart Sampling & Cardinality Control
Since telemetry data grows fast, especially in microservices environments, we looked for platforms that offer tail-based sampling, anomaly-aware retention, or cardinality management to control storage costs and improve signal-to-noise.
4. Scalable Query & Storage Architecture
Chronosphere is known for scale. Alternatives in this list include solutions with high-performance query engines, hot-warm storage tiers, or decoupled compute and retention — enabling fast querying and cost-efficient storage.
Chronosphere Overview
Known For
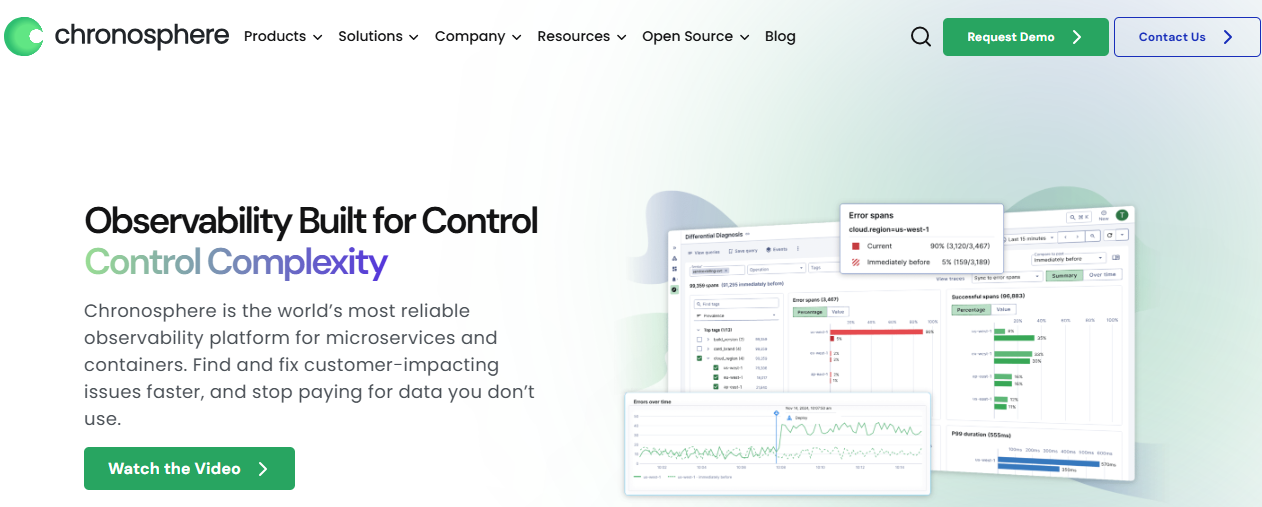
Chronosphere is a high-performance observability platform built for scale, known for its metrics-first architecture and cloud-native design. Originally developed at Uber and powered by the open-source M3DB time-series database, it is favored by organizations with massive Kubernetes workloads and high telemetry volumes, such as Snap and Robinhood. Its primary strength lies in fast, scalable metrics ingestion with strong controls over metric cardinality.
Standout Features
- Dual-Phase Sampling with Datasets & Behaviors: Supports both head and tail-based sampling through dynamic control planes. Teams can define sampling policies based on trace outcome, traffic volume, or service-specific rules, grouped via datasets for centralized trace budgeting.
- Advanced Metrics Engine (M3DB): Chronosphere leverages a proprietary version of M3DB to ingest and process massive metric volumes with customizable retention and aggregation logic — ideal for Kubernetes and Prometheus exporters.
- Prometheus Compatibility with Custom Control Plane: Provides a drop-in replacement for Prometheus with native support for PromQL, while enabling enhanced metric deduplication, cost tracking, and enforced retention via a centralized control plane.
- Log and Trace Support (Newer): Chronosphere now supports logs and traces, but they are handled separately from metrics and lack unified dashboards or MELT correlation capabilities. Trace ingest supports up to 100K spans per trace, with filtering and limiting applied post-capture.
Key Features
- Metrics-First Design: High-throughput ingestion and storage built around M3DB, with fine-grained control over cardinality, aggregation, and cost.
- Tail + Head Sampling: Tracing uses combined head/tail sampling with dataset-aware behaviors to control trace retention per team or service.
- Dynamic Configuration via Control Plane: Policies can be updated in real time without redeploying agents or services.
- Prometheus-Compatible: Native support for PromQL, remote-write, and Kubernetes exporters.
- Cloud-Native SaaS: Fully managed platform with auto-scaling backend optimized for Kubernetes telemetry.
Pros
- Extremely performant at metric ingestion scale.
- Prometheus is compatible with added enterprise controls.
- Custom sampling strategies reduce trace ingestion waste.
- Dataset-based sampling enables per-team telemetry budgeting.
- Strong cardinality management for cost control in dynamic workloads.
Cons
- Steep learning curve, especially when managing PromQL
- No self-hosted option, users incur egress costs
- PromQL is hard to use, especially for advanced queries
Best For
- Enterprises with large Kubernetes deployments focused heavily on metrics.
- Teams looking to replace Prometheus with centralized control over ingestion and cost.
- Organizations willing to trade full MELT support for scalability and SaaS simplicity.
Pricing & Customer Reviews
Chronosphere does not publicly list pricing.
Customer Reviews:
- G2: 4.6/5 (Based on 100+ reviews)
Praised for: Scalable metrics ingestion, Prometheus replacement, and cardinality controls.
Criticized for: Complexity of PromQL and a steep learning curve.
Top 7 Chronosphere Alternatives
1. CubeAPM

Known For
CubeAPM is a modern, OpenTelemetry-native observability platform designed for engineering teams requiring comprehensive MELT (Metrics, Events, Logs, Traces) coverage, data sovereignty, and predictable pricing. Built for compliance and scalability, it eliminates blind spots and billing surprises common in volume-based SaaS platforms like Better Stack.
Key Features
- OpenTelemetry-first Architecture: Native ingestion and visualization for OTEL signals across logs, metrics, traces, and events.
- Smart Sampling for Cost Control: Includes intelligent head/tail-based sampling and anomaly detection to avoid overpaying for low-value telemetry.
- Real-Time Distributed Tracing: End-to-end tracing with fast search and correlation for microservices, databases, and external APIs.
- Custom Dashboards & Alerting: Flexible visualizations, SLO-driven alerts, and root cause analytics for modern DevOps workflows.
Standout Features
- Zero Vendor Lock-In: 100% OpenTelemetry-based — you control the agent, schema, and pipeline without proprietary formats or black-box agents.
- SLO-Based Alerting & Runbook Integration: Built-in alerting that maps to service-level objectives (SLOs) and integrates with PagerDuty, Opsgenie, and Slack.
- Hot-Warm Storage Retention: Decouples high-speed querying from long-term retention, optimizing performance and cost at scale.
Pros
- Transparent pricing with no hidden ingestion or retention penalties
- Simple and fast deployment with Helm, Terraform, or Docker
- Excellent support for Kubernetes and serverless workloads
- GDPR/HIPAA/SOC2-ready hosting options
Cons
- Not suited for teams looking for off-prem solutions
- Strictly an observability platform and does not support cloud security management
Best For
- Mid-sized tech companies and SaaS startups
- Teams migrating from proprietary APMs to OpenTelemetry
- Organizations needing fine-grained cost control and self-hosted observability
Pricing & Customer Reviews
- Pricing: $0.15/GB for data ingestion
- G2 Reviews: ★ 4.8/5
Users highlight CubeAPM’s cost transparency, fast onboarding, and strong support for OpenTelemetry and custom metrics.
CubeAPM vs Chronosphere
Chronosphere is a SaaS-only, cloud-native observability platform focused on large-scale Prometheus and OpenTelemetry telemetry with strong data-shaping controls, but costs can be high as environments grow. CubeAPM provides a unified MELT stack with flexible deployment (self-hosted or managed), native OpenTelemetry, and predictable $0.15/GB pricing—giving teams more control, simpler operations, and clearer cost visibility.
2. Honeycomb
Known For
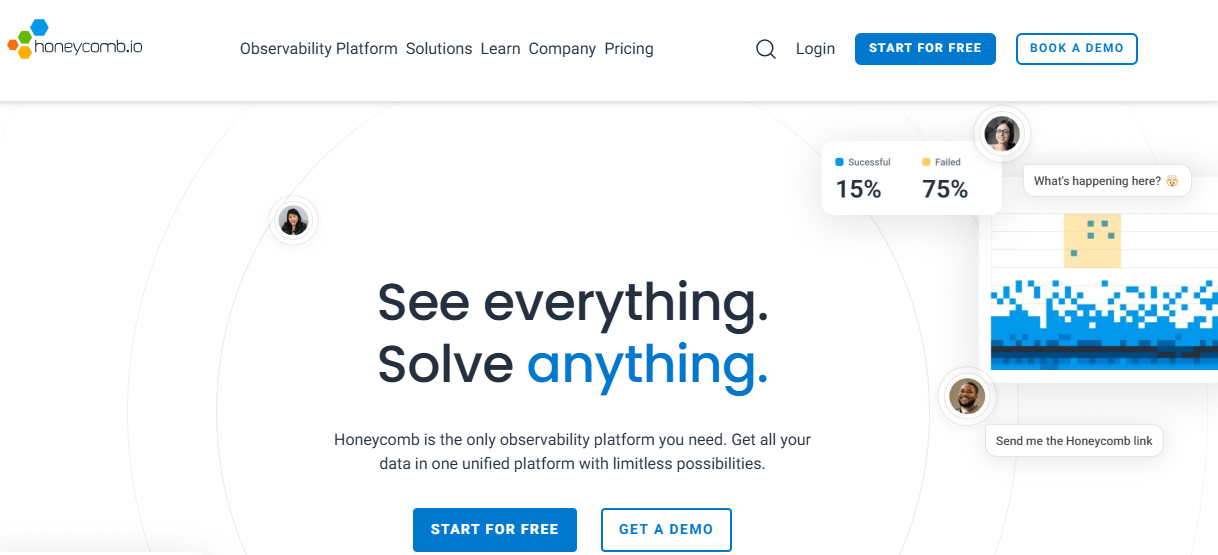
Honeycomb is an event-driven observability and high-cardinality trace exploration. Honeycomb pioneered “observability for debugging” and is favored by SREs and developers who need deep visibility into distributed systems.
Key Features
- Wide Event Support: Accepts structured events with hundreds of dimensions, making it ideal for debugging edge cases and system anomalies.
- OpenTelemetry Integration: Supports ingestion of OTEL traces and metrics. Also offers a vendor-specific agent (honeycombio/opentelemetry-exporter) for enhanced metadata tagging.
- Query Builder: Powerful UI for ad hoc queries using breakdowns, heatmaps, percentile distributions, and grouped views.
- BubbleUp Debugging: Visual correlation tool that lets users zoom in on outliers in trace or metrics data by highlighting differing dimensions.
- Service Map & Tracing UI: Real-time flame graphs, waterfall views, and span-level context for distributed tracing across services.
Standout Features
- High-Cardinality Performance: Handles millions of unique values per dimension (e.g., user ID, tenant, endpoint) with low latency — ideal for modern microservices and multitenant architectures.
- Column-Oriented Storage: Optimized for analytical workloads over telemetry data, unlike traditional row-based logs.
- No Indexing Required: Query across all fields without predefining indexes — reduces configuration overhead and increases exploration flexibility.
Pros
- Exceptional at debugging complex distributed systems
- Unique UI patterns for exploratory analysis and outlier detection
- OpenTelemetry-compatible with strong SaaS reliability
- Pricing includes a generous free tier and event-based billing flexibility
Cons
- High cost as data volume grows
- Limitations of quota management force users to get additional tools for reporting
- Limited features, no rollups or longer aggregation
Best For
- SRE teams debugging hard-to-catch anomalies in microservices
- Engineering organizations with high-cardinality observability needs
- Teams that prioritize trace/event analytics over traditional logs and metrics
Pricing & Customer Reviews
- Paid plans: $130/month for 100M events.
- G2 Reviews: 4.6/5
Users love Honeycomb’s developer-focused experience, performance at scale, and debugging depth. Common complaints include limited dashboarding, no log support, and a lack of alert routing flexibility.
Honeycomb vs Chronosphere
Honeycomb is built for exploratory, event-centric observability that lets engineers slice and deep-dive into high-cardinality, high-cardinality traces and events to understand complex production behavior in real time. Chronosphere, meanwhile, focuses on large-scale infrastructure management and cost-control via structured data shaping, which can be powerful for scale but less fluid for ad-hoc investigation.
3. Datadog
Known For
Datadog is a cloud-native, all-in-one observability and security platform, widely adopted by DevOps teams for its powerful integrations, real-time monitoring, and support for infrastructure, logs, APM, and security via SaaS.
Key Features
- Metrics, Logs & Traces Integration: Correlates telemetry across services using service maps and flame graphs.
- Application Performance Monitoring (APM): Distributed tracing with automatic instrumentation for major languages.
- Infrastructure Monitoring: 900+ integrations for AWS, Azure, GCP, Kubernetes, Redis, and more.
- Log Management: Centralized logging with Live Tail, rehydration, and advanced search.
- Security Monitoring: Includes Cloud SIEM, workload security, threat detection, and posture visibility.
Standout Features
- Watchdog AI: ML-based detection of anomalies and automatic insights.
- Synthetics & RUM: Frontend performance monitoring with real user and synthetic data.
- Service Catalog: Tracks ownership, deployment status, and dependencies.
Pros
- Best-in-class dashboarding and alerting
- Massive integration library
- Unified view across dev, ops, and security
- Established support ecosystem and uptime guarantees
Cons
- Costs balloon with scale and usage across products
- Opaque pricing: Logs, traces, synthetics, and infra are all billed differently
- Steep learning curve, especially for beginners
Best For
- Large enterprises with complex infrastructure
- Organizations already invested in Datadog’s ecosystem
- Teams needing bundled observability and security tooling
Pricing & Customer Reviews
- APM Pro: starts at $35/host/month
- Infrastructuire Pro Plan: starts at $15/host/month
- Logs: $0.1/ingested GB/month
- Infra Cost: starting at $15/host/month
- G2 Reviews: ★ 4.3/5
Praised for breadth and polish, but users frequently cite cost unpredictability and billing complexity.
Datadog vs Chronosphere
Datadog offers broader observability features than Chronosphere, including synthetics, RUM, and security tooling, but it’s significantly more expensive and not OTEL-native. Chronosphere provides more efficient metrics processing and cost controls, while Datadog favors deep integrations and a more polished UI for mature teams with budget headroom.
4. New Relic
Known For
Unified observability platform offering logs, metrics, traces, and dashboards in a single interface — often seen as a more user-friendly alternative to traditional enterprise APMs.
Key Features
- APM & Distributed Tracing: Tracks application latency, throughput, and errors with full support for distributed architectures.
- Infrastructure Monitoring: Real-time monitoring of hosts, containers, cloud services, and Kubernetes environments.
- Log Management: Integrated logging with correlation to metrics and traces. Supports ingestion via Fluent Bit, OTEL, and Logstash.
- Dashboards & Querying: Custom dashboards built using NRQL (New Relic Query Language) and auto-generated views from telemetry.
Standout Features
- All-in-One Telemetry UI: Combines metrics, logs, traces, synthetics, and user experience monitoring in one place.
- Code-Level Insights: Detects performance bottlenecks down to the function/method level for supported frameworks.
- Proactive Anomaly Detection: AI-powered alerts, baseline deviation detection, and forecasting are built into alerting rules.
Pros
- Single pricing model across logs, metrics, and traces
- Broad support for DevOps tools and cloud services
- Free tier includes 100 GB of telemetry/month
- Friendly UI for cross-functional teams (Dev, Ops, QA)
Cons
- Pricing can escalate rapidly above the free tier
- Steep learning curve, particularly when working with NRQL for advanced queries
- Users report UI is complex, complicating usability
- Complex initial setup
Best For
- Mid-sized companies and tech startups need all-in-one visibility
- Teams looking for unified dashboards with a lightweight setup
- Use cases where quick deployment and low initial cost matter
Pricing & Customer Reviews
- Free tier: 100 GB/month free.
- Ingestion-based pricing of $0.35/GB
- Platform users: $400/user/month for full access
- G2 Reviews: 4.4/5
Users appreciate its ease of use, transparent pricing, and consolidated UI, but reviews cite sluggish dashboards at scale and steep pricing curves as data grows.
New Relic vs Chronosphere
New Relic offers more out-of-the-box integrations and an easier onboarding path than Chronosphere. However, Chronosphere is optimized for infra-heavy scaling, cost efficiency, and SRE-centric workflows, while New Relic aims to be a generalist tool. For teams focused on cardinality control and OTEL-native ingestion, Chronosphere may offer better long-term scalability.
5. Dynatrace
Known For
AI-powered observability with full-stack automation across infrastructure, applications, cloud-native workloads, and user experience — popular among large enterprises for its depth and automation.
Key Features
- OneAgent Architecture: A single agent auto-discovers metrics, logs, traces, events, and dependencies across hosts, VMs, Kubernetes, and services.
- APM & Distributed Tracing: Auto-instrumentation and deep code-level diagnostics for Java, .NET, PHP, Node.js, and more.
- Davis AI Engine: Dynatrace’s anomaly detection and root cause engine that automatically analyzes billions of dependencies.
- Log Monitoring: Unified log ingestion, live tailing, and context linking with traces and metrics.
- Cloud & Kubernetes Monitoring: Native support for AWS, Azure, GCP, OpenShift, and Kubernetes clusters with service topology mapping.
Standout Features
- Smartscape Topology Mapping: Real-time dependency maps between services, processes, containers, and hosts.
- Davis AI Causation Engine: Goes beyond correlation by identifying causal relationships and minimising alert noise.
- Session Replay & RUM: Captures frontend user sessions, including DOM interactions and errors.
Pros
- Extremely powerful for large, complex cloud environments
- Unified agent reduces operational overhead
- Excellent AI-driven diagnostics and automation
- Built-in support for frontend, backend, and infrastructure
Cons
- High costs, especially when dealing with huge data volume
- Steep learning curve
- Users have reported a complex initial setup
Best For
- Enterprises with large-scale, mission-critical infrastructure
- Teams wanting automation, root cause analysis, and all-in-one visibility
- Organizations needing frontend+backend+infra monitoring in a single pane
Pricing & Customer Reviews
- Infrastructure Monitoring: $29 /month/host
- Full-Stack Monitoring: $58 /month/8 GiB host
- G2 Reviews: 4.5/5
Users love automation, accuracy, and visualizations, but cite high costs and complex onboarding as drawbacks.
Dynatrace vs Chronosphere
Dynatrace provides full-stack observability with automatic instrumentation, APM, infrastructure monitoring, and AI-driven root-cause analysis (OneAgent + Davis AI). Chronosphere is infrastructure-heavy, focusing on large-scale Prometheus/OpenTelemetry telemetry and data shaping for cost control. Teams requiring end-to-end APM depth and automation typically prefer Dynatrace, while those seeking metrics pipeline governance and cost optimization tend toward Chronosphere.
6. SigNoz

Known For
Open source observability built on OpenTelemetry, with an integrated UI for logs, metrics, and traces — often seen as the go-to self-hosted alternative to commercial SaaS platforms.
Key Features
- OpenTelemetry-Native: Fully built around OTEL standards. Offers plug-and-play support for auto-instrumentation and custom metrics via OTEL SDKs.
- APM & Distributed Tracing: Real-time service map, flame graphs, span filters, and trace details out of the box.
- Metrics Monitoring: Includes Prometheus-style metrics (p99 latency, error rates, throughput) and dashboards for services, databases, and infrastructure.
- Log Management (Beta): Centralized logs with live tailing, field filters, and trace-log correlation — still evolving in feature depth.
- Alerting & Dashboards: Built-in support for creating custom dashboards and rule-based alerts on service performance or metrics.
Standout Features
- Self-Hosted Deployment: Docker and Helm-based deployments with full control over data, retention, and performance tuning.
- Single Pane for MELT: Traces, logs, metrics, and alerts in one UI — unified by service, span, or tag.
- Open Source with Active Community: Transparent roadmap, GitHub issue tracking, and strong contribution activity.
Pros
- Native OTEL support — no vendor lock-in
- Transparent and predictable deployment for teams with infra control
- Rapidly evolving features with growing enterprise adoption
- Affordable and scalable with cloud or self-managed options
Cons
- Has a steep learning curve, especially for managingthe ClickHouse backend
- Self-hosting may require in-house SRE effort
Best For
- Engineering teams seeking a self-hosted, open-source OTEL observability stack
- Organizations transitioning from commercial APMs to open tooling
- DevOps teams looking for full MELT observability with low vendor overhead
Pricing & Customer Reviews
- Pricing: Free for self-hosted.
- Logs: $0.3/GB ingested
- Traces: $0.3/GB ingested
- G2 Reviews: ★ 4.6/5
Users highlight ease of OTEL onboarding, cost transparency, and developer-first UX. Downsides include log UI limitations and a need for manual scaling effort.
SigNoz vs Chronosphere
Both platforms embrace OpenTelemetry and cost-conscious observability, but take different routes. SigNoz emphasizes self-hosted flexibility, open source governance, and full MELT coverage. Chronosphere, while SaaS-focused, delivers stronger scale for metrics pipelines and tighter cost control for high-cardinality environments. SigNoz is ideal for teams wanting to fully own their observability stack; Chronosphere excels at optimizing telemetry pipelines at cloud scale.
7. Sumo Logic

Known For
Cloud-native log analytics and security intelligence, with broad support for real-time log ingestion, metrics, SIEM, and compliance use cases. Sumo Logic is often adopted in enterprises with hybrid and multicloud environments.
Key Features
- Log Management: Centralized log ingestion, indexing, and search with field extraction, parsing, and alerting.
- Metrics & Time Series Monitoring: Collects metrics from Prometheus, Telegraf, and cloud platforms with customizable dashboards.
- Security Analytics (Cloud SIEM): Detects threats and compliance issues using UEBA, correlation rules, and curated content.
- Application Observability: Includes distributed tracing, service maps, and pre-built dashboards for apps and cloud services.
- Ingest APIs & Integrations: Wide support for cloud logs (e.g., AWS CloudTrail, Azure Monitor), container logs, and OTEL-based pipelines.
Standout Features
- Cloud-Native Architecture: Built for multitenancy and elastic scale, with hosted retention and automatic indexing.
- Prebuilt Compliance Packs: Templates and dashboards for PCI-DSS, HIPAA, SOC2, and GDPR compliance monitoring.
- Search Query Language (LogReduce & LogCompare): Helps reduce log volume noise and compare logs across deployments.
Pros
- Strong log search performance with advanced filtering
- Native SIEM and threat detection add-on
- Integrates well with AWS, Azure, and Kubernetes
- Multiple deployment and ingestion options
Cons
- Expensive at scale — ingestion and retention costs spike fast
- Complex pricing model with multiple SKUs (metrics, logs, SIEM sold separately)
- UI can feel overwhelming, especially for beginners
Best For
- Enterprises needing a combined log + SIEM solution
- Organizations with strict compliance and audit requirements
- Teams prioritizing log analytics and security visibility over metrics-heavy workflows
Pricing & Customer Reviews
- $3.14/TB scanned
- G2 Reviews: 4.1/5
Users praise log analytics capabilities and compliance packs, but complain about high costs, query latency, and lack of OpenTelemetry support.
Sumo Logic vs Chronosphere
Chronosphere is a full MELT observability platform designed for cloud-native scale, offering metrics, logs, and traces with strong data-shaping controls to manage ingest volume and cost. Sumo Logic, meanwhile, is log-centric with strong real-time analytics and security/SIEM capabilities. Teams prioritizing heavy log analysis and security insights often choose Sumo Logic, while those needing MELT visibility with aggressive cost governance tend to prefer Chronosphere.
Conclusion
CubeAPM stands out with its $0.15/GB flat-rate, full OTEL-native MELT coverage, and flexible deployment model. Honeycomb is ideal for high-cardinality debugging, while SigNoz offers a self-hosted, open-source stack. Datadog and New Relic provide broader suites but at a higher cost, and Dynatrace and Sumo Logic bring strength in automation and security analytics. Your best alternative depends on whether you prioritize cost control, trace depth, open standards, or enterprise features.
Disclaimer: The information in this article reflects the latest details available at the time of publication and may change as technologies and products evolve.
FAQs
1. What are the best Chronosphere alternatives for full-stack observability?
If you’re looking beyond Chronosphere for unified MELT observability (Metrics, Events, Logs, Traces), top alternatives include CubeAPM, Datadog, Dynatrace, and New Relic. Among them, CubeAPM stands out for offering full-stack monitoring (including RUM and synthetics), native OpenTelemetry support, and both SaaS and self-hosted deployment at a fraction of the cost.
2. Why do teams switch from Chronosphere to other observability tools?
Most teams move away from Chronosphere due to its metrics-only focus, lack of native log/trace integration, no self-hosting option, and limited ecosystem integrations. As telemetry needs evolve, organizations often seek tools like CubeAPM that provide unified MELT observability, compliance-friendly deployments, and better cost predictability.
3. Does Chronosphere support OpenTelemetry?
Chronosphere supports OpenTelemetry for ingestion but lacks native, unified OTEL-first architecture across metrics, traces, and logs. It uses custom control-plane sampling and dataset behaviors, whereas alternatives like CubeAPM offer full OTEL compatibility with smart contextual sampling out of the box.
4. Is there a self-hosted alternative to Chronosphere?
Yes, platforms like CubeAPM, Uptrace, and Coralogix (with specific configurations) support on-prem or private cloud deployments, giving teams full control over data residency and compliance. Chronosphere, in contrast, is SaaS-only, which limits flexibility for regulated or security-sensitive environments.
5. How does pricing compare between Chronosphere and its alternatives?
Chronosphere doesn’t list public pricing and typically charges based on ingest volume and sampling rules. In contrast, CubeAPM offers transparent, usage-based pricing — $0.15/GB for ingestion, $0.02/GB for infra — with no per-user fees, making it 60–80% more cost-effective for teams scaling observability.


